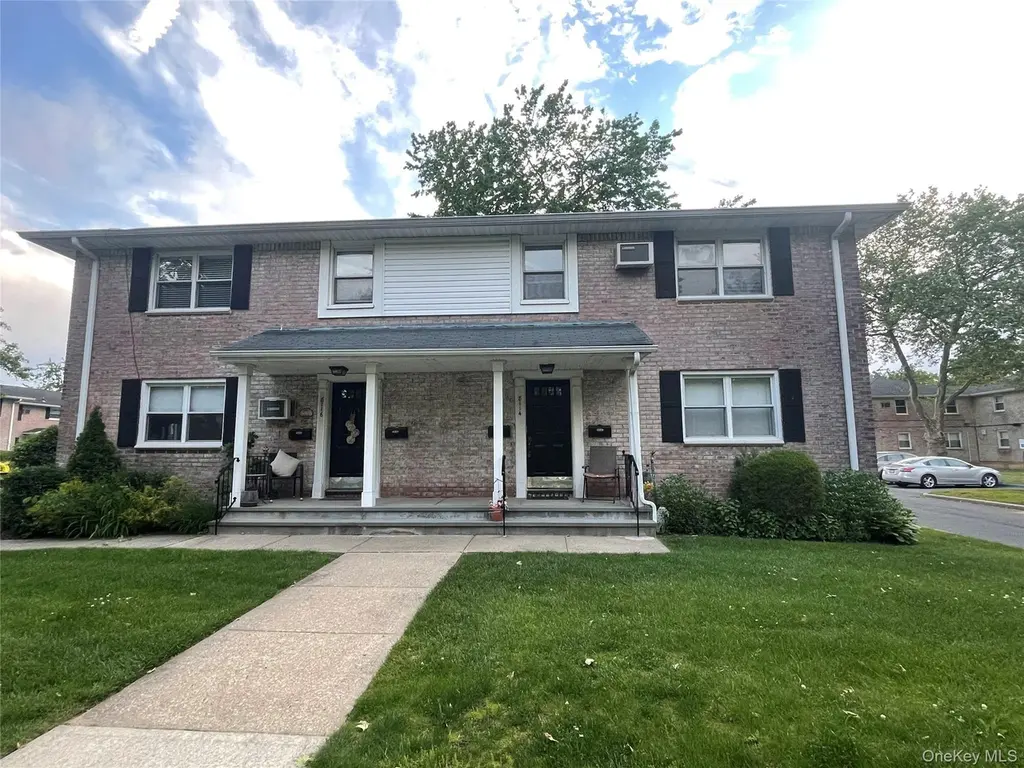
81-14 Langdale St Unit 249B · New York, NY
Flood risk 1/10 · Minimal
- FEMA flood zone
- X (unshaded)
- Chance of flooding over 30 yrs
- 0.0%
- Est. flood insurance / yr
- $507 – $1,088
Fire risk 1/10 · Minimal
- Est. fire insurance / yr
- $691 – $1,283
Heat risk 6/10 · Moderate
- Hot days now (above 97°F)
- 7 days/yr
- Hot days in 30 yrs
- 16 days/yr
Wind risk 6/10 · Moderate
- Chance of severe wind over 30 yrs
- 27.0%
Air-quality risk 3/10 · Minor
- Unhealthy air days now
- 4 days/yr
- Unhealthy air days in 30 yrs
- 4 days/yr
Risk factors via First Street. Map © Google.
Why this score? — see what drove the D grade
The composite is a weighted blend of 9 inputs, each scored 0–100. Each bar is that input's sub-score; the figure is the points it added to the 100-point composite (weight × sub-score).
- Cash flow +12.7/30.0
- ARV discount +7.5/15.0
- Schools +5.0/10.0
- DSCR +3.8/10.0
- Livability +3.8/5.0
- 1% rule +3.6/10.0
- Rent growth +2.5/5.0
- Condition / age +2.2/5.0
- Appreciation +0.0/10.0
$299,000
🖨 Deal sheet (PDF) 📄 Offer letter ✓ Due diligence
Listing remarks
Welcome to this spacious 2nd Floor Corner One Bedroom Unit with Extra Windows. Large Eat in Kitchen, Living Room, Bedroom and Full Bath. Needs Some Work and is being sold in "As Is" Condition. Remodel to your taste! Maintenance includes common area maintenance, exterior maintenance, heat, hot water, gas, ground care, Snow removal and water making for Worry Free Living! Ideally located near shopping, dining, Northwell Health Facilities, and access to highways, public transportation and LIRR. A wonderful opportunity to own in a well maintained and vibrant community. Renting allowed after 2 years.
Key facts
- 2 parking spots
- Built 1950
- Listed 30 days
Property features AI
Finance
- Other: Living area listed as 700 sq ft (source: other)
- Financial info: Details not provided
- HOA & community: Association: Langdale Gardens
Exterior
- Parking: 2 parking spaces; Common parking lot and on-street parking available
- Security: Details not provided
- Utilities: Trash collection is private; Sewer: other
- Home design: Stock cooperative; 2 total stories
- Construction: Brick construction
- Exterior features: Brick construction; Not waterfront
Interior
- Kitchen: Dishwasher; Oven; Refrigerator
- Bedrooms: Details not provided
- Flooring: Details not provided
- Bathrooms: 1 full bathroom
- Heating & cooling: Wall/window air conditioning units; Other heating (unspecified)
- Interior features: Eat-in kitchen; Common laundry area in basement; Pets allowed (cats and dogs, size restrictions may apply); 4 total rooms; One-level living (entry level shown as 2)
- Laundry & utility: Common-area laundry in basement
Neighborhood map
What this means for you Summary
Snapshot
- This is a 1-bed/1.0-bath condo listed at $299k. Condition is rated fair.
Deal economics
- At list price, monthly cash flow is $-31 ($-370/yr) — negative.
- To cash-flow at today's rent, offer at most $295k (1.5% below list).
- To meet the 1% rule (rent ≥ 1% of price), the offer needs to be $258k (13.8% below list).
- Recommended offer: $258k (13.8% below list) — sets the bar for 1% rule.
- Cap rate 6.2% vs local median 2.6% in New York — top-decile yield for the area; either an underpriced asset or a hidden risk that comps aren't pricing in. Stress-test before assuming the spread holds.
Location & tenants
- Location reads 75/100 on livability (#268 in NY, #4,188 nationally) — a middle-class / working-renter tenant base. Strengths: amenities A+, commute A+, health & safety A; Watch: crime F, cost of living F.
- Zoned schools: Elm Tree Elementary School (math 27% / reading 52%, grade F, #1,444 of 2,108 statewide, top 71%, 806 students, 94% FRL); Is 227 Louis Armstrong (math 52% / reading 69%, grade B+, #153 of 729 statewide, top 21%, 1,528 students, 68% FRL); Midwood High School (math 94% / reading 96%, grade A+, #83 of 1,100 statewide, top 8%, 4,062 students, 73% FRL).
- Market conditions: 200 active listings in the ZIP; 12 comparable units currently listed for rent nearby; rentals leasing fast (median 0d on market — plan ~1-2 weeks tenant-placement turnaround); 5,302 units permitted in Queens County in 2024 (4,918 in 5+ unit buildings).
Forward outlook
- Local home prices are declining (-3.0%/yr); year-one equity from $2k of loan paydown is wiped out by about $9k of value loss. Plan a longer hold.
- Queens County population projected at +16% by 2050 — long-run rental-demand tailwind backs the buy-and-hold thesis.
Negotiation context
- It's been on market 30 days — a 2% lower offer ($295k) is reasonable based on typical stale-listing flexibility.
Risks & watch-outs
- Watch-outs: built in 1950 — expect roof / HVAC / electrical / plumbing capex.
- Climate carrying-cost: major wind risk, 27% chance of damaging wind over 30y; extreme-heat days projected 7→16/yr by 2055 (HVAC capex compounding) — expect insurance premiums to compound above CPI over the hold.
Questions for the listing agent
- What do current leases actually rent for vs. the listed asking? Can we see a recent rent roll and the last 12 months of T-12 income?
- Have any recent inspections been done? Can we get a copy of the seller's disclosures and any deferred-maintenance estimates?
- Built in 1950 — when were the roof, HVAC, electrical panel, plumbing, and water heater last replaced?
- Any open or pending special assessments — roof, HVAC, plumbing, elevator, façade? What's the per-unit balance and payoff schedule, and is the seller paying it off at close or rolling it to the buyer?
- Is there a deadline driving the sale (1031 exchange, divorce, estate, relocation)? That informs how much negotiation room exists.
- Schools are B-rated — typically a magnet for longer-tenancy family renters. What's the average tenant stay here, and is there a school-zone premium baked into asking?
- Crime grade is F in this area — have there been break-ins, vandalism, or insurance claims at this property in the last 3 years? What carrier currently insures it and at what premium?
- The area grade is low — what's the realistic commute time and amenity access for the typical tenant pool here? Any planned neighborhood developments (good or bad) we should know about?
- What's the average days-on-market for RENTAL listings here right now (not sales)? A rising rental-DOM trend means longer vacancies and softer asking-rent achievability than the comps imply.
- What's the recent tenant-quality profile in this submarket — average credit score on applications, eviction rate, late-payment / NSF rate, and stable-employment percentage? A property-management company in the area should have these aggregated.
- How much new apartment / multifamily construction is in the pipeline within 1–3 miles? Heavy new supply (>2% of stock underway) typically softens rents 12–24 months out; light construction supports rent growth.
Investment metrics
- 1% rule
- 0.86% ✗
- Cap rate
- 6.17%
- Cash-on-cash
- -0.44%
- DSCR
- 0.98
- GRM
- 9.7
CMA / ARV
No comps found within radius.
Projected returns pro-forma
-3.0% appreciation · 3.0% rent growth · sell at horizon
- IRR
- -17.0%
- Equity multiple
- 0.40×
- Total profit
- $-50,378
- Equity at exit
- $44,582
- IRR
- -8.9%
- Equity multiple
- 0.45×
- Total profit
- $-46,241
- Equity at exit
- $25,852
Cash invested: $83,720 (down + closing). Projections, not guarantees.
Landlord ↔ Tenant lean methodology
- Overall (CITY)
- 0 Strongly Tenant-Friendly
- State New York
- 15 Strongly Tenant-Friendly · D+10
- County
- — inherits STATE
- City New York
- 0 Strongly Tenant-Friendly · D+34
ZIP-level market 11040
- Active inventory
- 200
- Price-to-rent
- 9.7×
Monthly cashflow live
- Estimated rent
- $2,577 high interval (Pro) →
- Mortgage (P&I)
- −$1,568
- Tax est. 1.5%
- −$374 /mo · $4,485/yr
- Insurance
- −$125
- HOA
- −$0
- Vacancy / Maint / Mgmt
- −$541
- Net cashflow
- $-31
Break-even live
Sensitivity live
| Price | -10% $176 | -5% $72 | +0% $-31 | +5% $-134 | +10% $-237 |
|---|---|---|---|---|---|
| Rent | -10% $-234 | -5% $-133 | +0% $-31 | +5% $71 | +10% $173 |
| Rate | -1.0pp $120 | -0.5pp $45 | base $-31 | +0.5pp $-108 | +1.0pp $-187 |
UW: 25.0% down · 7.5% · 30yr · 1.5% tax · 5.0% vac · 8.0% maint · 8.0% mgmt
Financing live
Cash to close
- Down payment
- $74,750
- Closing costs
- $8,970
- Reserves months
- —
- Total cash needed
- —
Loan-product check · same deal, 3 products live
Conventional
25% down · 7.5% · 30yr
- Down + closing
- —
- Monthly P&I
- —
- Monthly cashflow
- —
- DSCR
- —
- Eligible?
- —
Personal DTI + credit; lowest rate.
DSCR
20% down · 8.5% · 30yr
- Down + closing
- —
- Monthly P&I
- —
- Monthly cashflow
- —
- DSCR
- —
- Eligible?
- —
No personal income docs; deal must DSCR.
Hard money
10% down · 12.0% · 12mo
- Down + closing
- —
- Monthly P&I
- —
- Monthly cashflow
- —
- DSCR
- —
- Eligible?
- —
Short-term bridge; refi at stabilization.
Rent comps 12 comps
| Address | Beds | Baths | Sqft | Rent | $/sqft | DOM | Units | Dist |
|---|---|---|---|---|---|---|---|---|
| 260-51 73rd Ave Queens, NY | 1.0 | 1.0 | 518 | $2,200 | $4.25 | 6d | 1 | 0.94mi |
| 322 Jericho Tpke Floral Park, NY | 2.0 | 1.0 | 700 | $2,800 | $4.00 | 13d | 1 | 1.02mi |
| 318 Jericho Tpke Unit 1R Floral Park, NY | 1.0 | 1.0 | 500 | $1,900 | $3.80 | 18d | 1 | 1.02mi |
| 102 Jericho Tpke Unit 3C New Hyde Park, NY | 1.0 | 1.0 | 685 | $2,000 | $2.92 | 0d | 1 | 1.04mi |
| 402 Jericho Tpke Unit 1 New Hyde Park, NY | 1.0 | 1.0 | 616 | $2,850 | $4.63 | 0d | 1 | 1.06mi |
| 36 Lakeville Rd New Hyde Park, NY | 2.0 | 1.0 | 650 | $3,500 | $5.38 | 0d | 1 | 1.06mi |
| 610 Jericho Tpke New Hyde Park, NY | 2.0 | 1.0 | 525 | $2,900 | $5.52 | 0d | 1 | 1.10mi |
| 76-37 Commonwealth Blvd Unit 2 Jamaica, NY | 1.0 | 1.0 | 641 | $2,200 | $3.43 | 26d | 1 | 1.22mi |
| 77 S Tyson Ave Floral Park, NY | 1.0–2.0 | 1.0–2.0 | 807 | $3,095 | $3.83 | 0d | 1 | 1.25mi |
| 145 Tulip Ave Floral Park, NY | 2.0 | 1.0 | 600 | $2,600 | $4.33 | 0d | 1 | 1.34mi |
| 248-15 89th Ave Unit 2nd Queens, NY | 1.0 | 1.0 | 700 | $2,200 | $3.14 | 3d | 1 | 1.44mi |
| 626 Stewart Ave New Hyde Park, NY | 1.0 | 1.0 | 700 | $2,600 | $3.71 | 0d | 1 | 1.48mi |
HOA detail condo
- Monthly dues
- $0 · $0/yr
- Likely covers
- watergassnow removalexterior maint.
- Assessments
- None detected in remarks — confirm with the listing agent.
Listing history 16 events
-
2026-06-21days on market $299,000 Active 30 DOM
-
2026-06-18days on market $299,000 Active 27 DOM
-
2026-06-17days on market $299,000 Active 26 DOM
-
2026-06-16days on market $299,000 Active 25 DOM
-
2026-06-15days on market $299,000 Active 24 DOM
-
2026-06-13days on market $299,000 Active 22 DOM
-
2026-06-10days on market $299,000 Active 18 DOM
-
2026-06-08days on market $299,000 Active 17 DOM
-
2026-06-08days on market $299,000 Active 16 DOM
-
2026-06-04days on market $299,000 Active 13 DOM
-
2026-06-03days on market $299,000 Active 12 DOM
-
2026-06-02days on market $299,000 Active 11 DOM
-
2026-06-01days on market $299,000 Active 10 DOM
-
2026-06-01price $299,000 Active 9 DOM
-
2026-05-31days on market $320,000 Active 9 DOM
-
2026-05-22$320,000 Active
ⓘ Source: listings_history table (triggers on properties + properties_extension) + one-shot
backfill from property_details.listing_events for pre-trigger history.
Climate risk First Street
- Flood 1/10 Low FEMA zone X (unshaded) · 0% chance over 30 yrs
- Wildfire 1/10 Low
- Heat 6/10 Major 7 d/yr ≥97°F today · 16 d/yr by 30 yrs out
- Wind 6/10 Major 27% chance of damaging wind over 30 yrs
- Air quality 3/10 Moderate 4 unhealthy d/yr today · 4 by 30 yrs out
Nearby sold comps map
Loading sold comps map…
Walkable amenities ~0.75 mi
Loading nearby amenities…
Taxation est. · year 1
- Rental income
- $30,918
- − Mortgage interest
- −$16,749
- − Property taxes
- −$4,485
- − Insurance
- −$1,495
- − Repairs & maintenance
- −$2,473
- − Management
- −$2,473
- − Depreciation
- −$8,698
- Taxable loss
- −$5,455
- Est. tax savings @ 24.0%
- +$1,309
- After-tax cash flow
- $939/yr
For passive investors: Depreciation is non-cash, so a rental often shows a tax loss while cash-flowing — sheltering income. Rental losses are passive: they offset passive income freely, and up to $25,000/yr can offset ordinary (W-2) income if you actively participate and your MAGI is under $100k (phasing out to $0 by $150k); unused losses carry forward. On sale, claimed depreciation is recaptured at up to 25%, and gains may owe capital-gains tax (a 1031 exchange can defer both). Figures are a year-1 estimate at your 24.0% rate — not tax advice; consult a CPA.
Condition & rehab AI · 7 photos
This 2nd Floor Corner One Bedroom Unit requires moderate repairs and maintenance to improve its condition and value. Fresh paint, new kitchen cabinets and countertops, and updated bathroom fixtures can significantly enhance its appeal.
Repairs flagged
- Moderate Kitchen cabinets — Worn appearance
- Moderate Kitchen countertops — Worn appearance
- Minor Bathroom shower curtain — Visible wear
- Minor Bathroom fixtures — Visible wear
- Minor Living room carpet — Some wear
Value-add opportunities
- Both Paint and minor repairs throughout — Fresh paint and minor repairs can improve the home's appearance and appeal to buyers/renters
- Both Replace worn kitchen cabinets and countertops — New cabinets and countertops can significantly improve the kitchen's functionality and aesthetic
- Both Replace worn bathroom shower curtain and fixtures — Fresh shower curtain and fixtures can improve the bathroom's functionality and aesthetic
- Both Replace worn living room carpet — New carpet can improve the living room's functionality and aesthetic
Renovation cost estimate screening
| Repair item | Severity | Est. cost |
|---|---|---|
| Kitchen cabinets · Worn appearance | Moderate | $3,000–15,000 |
| Kitchen countertops · Worn appearance | Moderate | $3,000–15,000 |
| Bathroom shower curtain · Visible wear | Minor | $500–3,000 |
| Bathroom fixtures · Visible wear | Minor | $500–3,000 |
| Living room carpet · Some wear | Minor | $500–3,000 |
| Total estimated repair cost · 5 items | $7,500–39,000 |
Value-add ROI direction
- Both Paint and minor repairs throughout — Fresh paint and minor repairs can improve the home's appearance and appeal to buyers/renters ↑
- Both Replace worn kitchen cabinets and countertops — New cabinets and countertops can significantly improve the kitchen's functionality and aesthetic ↑
- Both Replace worn bathroom shower curtain and fixtures — Fresh shower curtain and fixtures can improve the bathroom's functionality and aesthetic ↑
- Both Replace worn living room carpet — New carpet can improve the living room's functionality and aesthetic ↑
ⓘ Cost ranges are severity-bucket heuristics (US national rule-of-thumb). Get contractor quotes + a written scope before underwriting a rehab budget.
Schools (NCES district)
No district data.
Livability — New York
- Score
- 75/100
- State rank
- #268
- US rank
- #4188
Category grades
Schools grade is shown separately in the Schools card above.
Census & demographics
- Census place
- New York, NY
- City population
- 7,731,280
- Population (ZIP)
- 42,344
Population outlook (Queens County) Hauer SSP2
- Today (2025)
- 2,546,320 people
- By 2030
- 2,643,059 · +3.8%
- By 2040
- 2,815,563 · +10.6%
- By 2050
- 2,944,423 · +15.6%
- By 2075
- 3,123,338 · +22.7%
- By 2100
- 3,098,688 · +21.7%
Race, ethnicity, and origin ACS 2023
- Neighborhood character
- Diverse neighborhood (Simpson 0.65)
- Race & ethnicity
- Asian 44% White 39% Hispanic / Latino 11% Two or more races 7% Black 1%
- Hispanic origin (detail)
- Puerto Rican 3%
- Common ancestry
- Romanian 2% Scotch-Irish 2% Russian 1%
- Foreign-born
- 33% · China, Canada, South Korea
- Languages at home
- 57% English-only · Other Indo-European 14% Chinese 8% Other Asian/Pacific 8%
Political lean MEDSL · Queens
- 2024 margin
- Strong D (+24.6) · D 62.3% · R 37.7%
- 2008→2024 swing
- -26.2pp toward R · 2008: 50.8pp · 2024: 24.6pp
- All cycles
- 2024: D+24.6 2020: D+45.2 2016: D+53.4 2012: D+58.5 2008: D+50.8
Not yet ingested
- Civics
- —
Market trends
- HPI YoY
- ▼ -747.29%
- Current HPI
- 308.3913
- Rent YoY
- —
- Metro
- —
- State GDP YoY
- ▲ 2.60%
- F500 in state
- 92
Industry mix (Fortune 500 HQ in NY)
| Industry | F500 HQs | Revenue |
|---|---|---|
| Financial Services | 10 | $950B |
|
||
| Consumer Goods | 9 | $162B |
|
||
| Insurance | 4 | $225B |
|
||
| Telecommunications | 2 | $144B |
|
||
| Pharmaceuticals | 2 | $112B |
|
||
| Media / Entertainment | 2 | $69B |
|
||
Price history
1 event — show timeline
- 2026-05-22 Listed $320,000 OneKey® MLS as Distributed by MLS Grid
Cash-flow waterfall
monthlySold comps — $/sqft
last 12 mo · ≤1 miLoading sold comps…