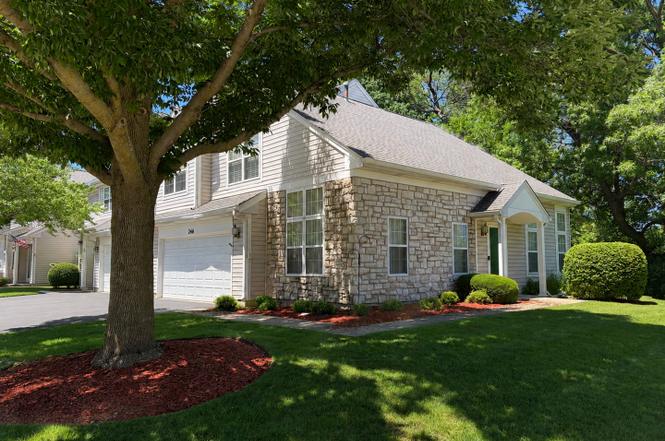
246 Rainier Way · Fox Lake, IL
Flood risk No data
- FEMA flood zone
- —
- Chance of flooding over 30 yrs
- —
- Est. flood insurance / yr
- —
Fire risk No data
- Est. fire insurance / yr
- —
Heat risk No data
- Hot days now (above threshold)
- —
- Hot days in 30 yrs
- —
Wind risk No data
- Chance of severe wind over 30 yrs
- —
Air-quality risk No data
- Unhealthy air days now
- —
- Unhealthy air days in 30 yrs
- —
Risk factors via First Street. Map © Google.
Why this score? — see what drove the C+ grade
The composite is a weighted blend of 9 inputs, each scored 0–100. Each bar is that input's sub-score; the figure is the points it added to the 100-point composite (weight × sub-score).
- Cash flow +30.0/30.0
- 1% rule +10.0/10.0
- DSCR +10.0/10.0
- Livability +3.7/5.0
- Rent growth +2.5/5.0
- Condition / age +2.5/5.0
- Schools +2.3/10.0
- ARV discount +0.0/15.0
- Appreciation +0.0/10.0
$299,900
🖨 Deal sheet 📄 Offer letter ✓ Due diligence
Listing remarks
Welcome to one of the most desirable locations in Rainier Woods! This beautifully maintained end-unit townhome is filled with natural light and showcases soaring vaulted ceilings that create an open, airy feel throughout. Offering 3 bedrooms and generous living spaces, the thoughtfully designed floor plan is ideal for both everyday living and entertaining. Upstairs, you'll find three spacious bedrooms, including a comfortable primary suite with walk-in closets. The convenient second-floor laundry room adds everyday ease, while built-in breakfast nook benches with storage add both charm and functionality. Tucked away on a quiet cul-de-sac, this home also features a private patio-perfect for
Key facts
- Quiet cul-de-sac
- End-unit townhome
- Private patio
Tags
Property features AI
Finance
- Other: Subdivision: Rainier Woods; Located in Fox Lake (Grant Township); Directions: Rollins Rd to Rainier Way
- Financial info: Homeowner tax exemption (per record)
- HOA & community: Monthly association fee of $315; Association fee covers insurance, exterior maintenance, lawn care, and snow removal; Community managed by off-site manager; Pets allowed (cats and dogs permitted)
Exterior
- Parking: Attached garage (owned) with garage door opener; Asphalt driveway; Two total parking spaces (two garage spaces)
- Security: CO detectors
- Utilities: Public water; Public sewer; Electric service with circuit breakers
- Home design: End-unit attached single (townhouse) with two stories; Entry level is 1; Model: EVERGLADE; Fee simple ownership with homeowners association; Building contains 2 units; Neighborhood provides school bus service and commuter train access
- Construction: Built approximately 26-30 years ago; Vinyl siding with stone accents; Asphalt roof; Concrete perimeter foundation
- Exterior features: Patio; Property on a cul-de-sac
Interior
- Kitchen: Range; Refrigerator; Disposal; Eating area with table space
- Bedrooms: Three bedrooms (master on second level; additional bedrooms on second level); Bedroom sizes include 16 x 12 (master), 13 x 10, and 11 x 10
- Flooring: Laminate flooring throughout main living areas; Carpet in bedrooms
- Bathrooms: Two full bathrooms and one half bathroom
- Heating & cooling: Natural gas forced air heating; Central air conditioning
- Interior features: Seven total rooms; All windows have coverings; CO detectors installed; Separate dining room
- Laundry & utility: Laundry area with washer hookup on upper level; Washer and dryer included
Neighborhood map
What this means for you Summary
Snapshot
- This is a 3-bed/1.5-bath townhouse listed at $300k.
Deal economics
- At list price, monthly cash flow is $3k ($30k/yr) — positive.
- The deal already cash-flows at list — no discount required.
- Meets the 1% rule at list price ($6k rent vs $300k).
- Cap rate 16.4% vs local median 6.0% in Fox Lake — top-decile yield for the area; either an underpriced asset or a hidden risk that comps aren't pricing in. Stress-test before assuming the spread holds.
Location & tenants
- Location reads 74/100 on livability (#247 in IL, #4,462 nationally) — a middle-class / working-renter tenant base. Strengths: cost of living A+, housing A+, commute A; Watch: amenities D+, health & safety F.
- Grant Chsd 124 (suburban): math 23% / reading 27% proficiency, ranked #296 of 620 in IL (top 48%) — low school quality limits family demand, transient renter base, plan for 1-2y turnover.
- Zoned schools: Grant Community High School (math 23% / reading 27%, grade F, #247 of 693 statewide, top 36%, 1,837 students, 0% FRL).
- Market conditions: 78 active listings in the ZIP; 2 comparable units currently listed for rent nearby; 948 units permitted in Lake County in 2024 (424 in 5+ unit buildings).
Forward outlook
- Local home prices are declining (-3.0%/yr); year-one equity from $2k of loan paydown is wiped out by about $9k of value loss. Plan a longer hold.
- Lake County population projected to shrink 8% by 2050 — rents likely to lag national; underwrite the cash flow, not the appreciation.
- At projected returns (-3.0% appreciation + 3.0% rent growth), your $84k cash investment doubles in ~4 years — after that, you're playing with house money.
Negotiation context
- Only 2 days on market — expect competitive offers; lowballing is unlikely to land.
Questions for the listing agent
- What does the HOA fee cover, when was the last increase, and are there any pending special assessments or reserve-fund shortfalls?
- Is there a deadline driving the sale (1031 exchange, divorce, estate, relocation)? That informs how much negotiation room exists.
- Schools are F-rated, which usually means shorter tenancies and higher turnover. Who's the typical renter profile here, and what's been the actual vacancy rate?
- What's the average days-on-market for RENTAL listings here right now (not sales)? A rising rental-DOM trend means longer vacancies and softer asking-rent achievability than the comps imply.
- What's the recent tenant-quality profile in this submarket — average credit score on applications, eviction rate, late-payment / NSF rate, and stable-employment percentage? A property-management company in the area should have these aggregated.
- How much new for-sale + rental construction is in the pipeline within 1–3 miles? Heavy new supply typically softens prices + rents 12–24 months out; constrained supply supports both.
Investment metrics
- 1% rule
- 2.08% ✓
- Cap rate
- 16.44%
- Cash-on-cash
- 36.24%
- DSCR
- 2.61
- GRM
- 4.0
CMA / ARV
- ARV (on-the-fly)
- $247,559
- Comps found
- 6
Show comp detail 6 sales within ~0.75 mi
| Address | Dist | Beds/Ba | Sqft | Sold | Price | $/sf | Match |
|---|---|---|---|---|---|---|---|
| 267 Rainier Way | 0.04mi | 3/3.0 | 1,781 (0%) | 22mo | $282,900 | $159 | 74 |
| 263 Rainier Way #263 | 0.03mi | 2/2.5 (-1) | 1,824 (+2%) | 15mo | $254,000 | $139 | 73 |
| 570 Windsor Dr #570 | 0.56mi | 3/1.5 | 1,777 (-0%) | 10mo | $215,000 | $121 | 66 |
| 261 Rainier Way Unit 6-261 | 0.04mi | 3/2.5 | 2,045 (+15%) | 15mo | $300,000 | $147 | 57 |
| 514 Foxridge Dr | 0.46mi | 3/2.5 | 1,777 (-0%) | 20mo | $212,000 | $119 | 57 |
| 627 Windsor Dr Unit 5A | 0.57mi | 3/1.5 | 1,980 (+11%) | 12mo | $220,000 | $111 | 45 |
Match score weights: distance 35% · size 25% · config 20% · recency 20%. Top-matched comps best support the ARV.
Projected returns pro-forma
-3.0% appreciation · 3.0% rent growth · sell at horizon
- IRR
- 32.0%
- Equity multiple
- 2.35×
- Total profit
- $113,213
- Equity at exit
- $44,716
- IRR
- 39.2%
- Equity multiple
- 4.66×
- Total profit
- $307,738
- Equity at exit
- $25,930
Cash invested: $83,972 (down + closing). Projections, not guarantees.
Landlord ↔ Tenant lean methodology
- Overall (STATE)
- 43 Moderately Tenant-Leaning
- State Illinois
- 43 Moderately Tenant-Leaning · D+7
- County
- — inherits STATE
- City
- — inherits STATE
ZIP-level market 60020
- Home prices YoY
- -30.7%
- Active inventory
- 78
- Price-to-rent
- 4.0×
Monthly cashflow live
- Estimated rent
- $6,232 medium interval (Pro) →
- Mortgage (P&I)
- −$1,573
- Tax est. 1.5%
- −$375 /mo · $4,498/yr
- Insurance
- −$125
- HOA
- −$315
- Vacancy / Maint / Mgmt
- −$1,309
- Net cashflow
- $2,536
Break-even live
UW: 25.0% down · 7.5% · 30yr · 1.5% tax · 5.0% vac · 8.0% maint · 8.0% mgmt
Financing live
Cash to close
- Down payment
- $74,975
- Closing costs
- $8,997
- Reserves months
- —
- Total cash needed
- —
Loan-product check · same deal, 3 products live
Conventional
25% down · 7.5% · 30yr
- Down + closing
- —
- Monthly P&I
- —
- Monthly cashflow
- —
- DSCR
- —
- Eligible?
- —
Personal DTI + credit; lowest rate.
DSCR
20% down · 8.5% · 30yr
- Down + closing
- —
- Monthly P&I
- —
- Monthly cashflow
- —
- DSCR
- —
- Eligible?
- —
No personal income docs; deal must DSCR.
Hard money
10% down · 12.0% · 12mo
- Down + closing
- —
- Monthly P&I
- —
- Monthly cashflow
- —
- DSCR
- —
- Eligible?
- —
Short-term bridge; refi at stabilization.
Rent comps 2 comps
| Address | Beds | Baths | Sqft | Rent | $/sqft | DOM | Units | Dist |
|---|---|---|---|---|---|---|---|---|
| 184 E Grand Ave Unit 1374785P Fox Lake, IL | 4.0 | 3.0 | 1593 | $7,875 | $4.94 | 6d | 1 | 0.61mi |
| 601 Blue Springs Dr Unit 289 Fox Lake, IL | 3.0 | 2.5 | 1837 | $2,750 | $1.50 | 24d | 1 | 1.41mi |
HOA detail
- Monthly dues
- $315 · $3,780/yr
Listing history 3 events
-
2026-06-18days on market $299,900 Coming Soon 2 DOM
-
2026-06-17remarks 699-char remark
-
2026-06-17$299,900 Coming Soon 1 DOM
ⓘ Source: listings_history table (triggers on properties + properties_extension) + one-shot
backfill from property_details.listing_events for pre-trigger history.
Nearby sold comps map
Loading sold comps map…
Walkable amenities ~0.75 mi
Loading nearby amenities…
Taxation est. · year 1
- Rental income
- $74,789
- − Mortgage interest
- −$16,799
- − Property taxes
- −$4,498
- − Insurance
- −$1,500
- − Repairs & maintenance
- −$5,983
- − Management
- −$5,983
- − HOA
- −$3,780
- − Depreciation
- −$8,724
- Taxable income
- $27,521
- Est. tax owed @ 24.0%
- −$6,605
- After-tax cash flow
- $23,828/yr
For passive investors: Depreciation is non-cash, so a rental often shows a tax loss while cash-flowing — sheltering income. Rental losses are passive: they offset passive income freely, and up to $25,000/yr can offset ordinary (W-2) income if you actively participate and your MAGI is under $100k (phasing out to $0 by $150k); unused losses carry forward. On sale, claimed depreciation is recaptured at up to 25%, and gains may owe capital-gains tax (a 1031 exchange can defer both). Figures are a year-1 estimate at your 24.0% rate — not tax advice; consult a CPA.
Schools (NCES district)
- District
- Grant Chsd 124
- NCES district ID
- 1717340
- Math proficiency
- 23% ▼ -9.00%
- Reading proficiency
- 27% ▼ -7.00%
- Median HH income
- $59,450
- Composite
- 22.95/100
- National rank
- #7989
- State rank
- #296 of 620 in IL
Livability — Fox Lake
- Score
- 74/100
- State rank
- #247
- US rank
- #4462
Category grades
Schools grade is shown separately in the Schools card above.
Census & demographics
- Census place
- Fox Lake, IL
- City population
- 10,846
- Population (ZIP)
- 10,846
Population outlook (Lake County) Hauer SSP2
- Today (2025)
- 700,217 people
- By 2030
- 693,290 · -1.0%
- By 2040
- 673,588 · -3.8%
- By 2050
- 643,556 · -8.1%
- By 2075
- 562,792 · -19.6%
- By 2100
- 457,715 · -34.6%
Race, ethnicity, and origin ACS 2023
- Neighborhood character
- Predominantly White (80%)
- Race & ethnicity
- White 80% Hispanic / Latino 12% Two or more races 10% Black 3%
- Hispanic origin (detail)
- Mexican 10% Puerto Rican 1%
- Common ancestry
- Romanian 15% Portuguese 2% Italian 2%
- Foreign-born
- 10% · Canada, South Korea
- Languages at home
- 87% English-only · Spanish 6% Russian/Polish/Slavic 3% Other Indo-European 1%
Political lean MEDSL · Lake
- 2024 margin
- Strong D (+20.8) · D 59.7% · R 38.9% · Other 1.4%
- 2008→2024 swing
- +1.1pp toward D · 2008: 19.6pp · 2024: 20.8pp
- All cycles
- 2024: D+20.8 2020: D+24.1 2016: D+20.3 2012: D+8.1 2008: D+19.6
Not yet ingested
- Civics
- —
Market trends
- HPI YoY
- ▼ -97.19%
- Current HPI
- 219.6301
- Rent YoY
- —
- Metro
- —
- State GDP YoY
- ▲ 1.59%
- F500 in state
- 60
Industry mix (Fortune 500 HQ in IL)
| Industry | F500 HQs | Revenue |
|---|---|---|
| Insurance | 4 | $201B |
|
||
| Consumer Goods | 4 | $87B |
|
||
| Industrial Machinery | 3 | $64B |
|
||
| Healthcare | 2 | $55B |
|
||
| Retail / Pharmacy | 1 | $148B |
|
||
| Agriculture / Food | 1 | $86B |
|
||
Cash-flow waterfall
monthlySold comps — $/sqft
last 12 mo · ≤1 miLoading sold comps…