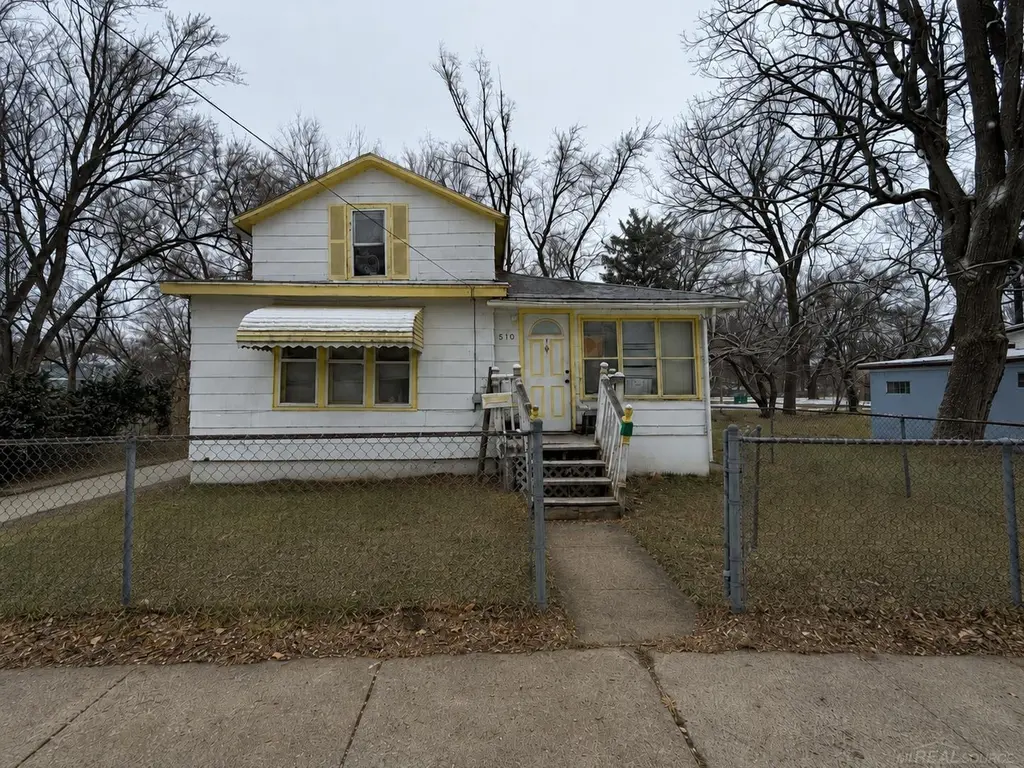
510 Bosker Ave · Kalamazoo, MI
Flood risk 1/10 · Minimal
- FEMA flood zone
- X (unshaded)
- Chance of flooding over 30 yrs
- 0.0%
- Est. flood insurance / yr
- $507 – $1,088
Fire risk 1/10 · Minimal
- Est. fire insurance / yr
- $784 – $1,456
Heat risk 2/10 · Minimal
- Hot days now (above 100°F)
- 7 days/yr
- Hot days in 30 yrs
- 16 days/yr
Wind risk 2/10 · Minimal
- Chance of severe wind over 30 yrs
- —
Air-quality risk 2/10 · Minimal
- Unhealthy air days now
- 1 days/yr
- Unhealthy air days in 30 yrs
- 2 days/yr
Risk factors via First Street. Map © Google.
Why this score? — see what drove the B grade
The composite is a weighted blend of 9 inputs, each scored 0–100. Each bar is that input's sub-score; the figure is the points it added to the 100-point composite (weight × sub-score).
- Cash flow +30.0/30.0
- 1% rule +10.0/10.0
- DSCR +10.0/10.0
- ARV discount +7.5/15.0
- Schools +4.7/10.0
- Livability +3.8/5.0
- Condition / age +2.5/5.0
- Rent growth +2.3/5.0
- Appreciation +0.0/10.0
$43,900
🖨 Deal sheet 📄 Offer letter ✓ Due diligence
Listing remarks MLS
Historic 1885 home located in the heart of Kalamazoo's Northside neighborhood. This 1.5-story traditional property offers timeless character, solid rental or investment potential, and convenient access to downtown Kalamazoo, schools, public transit, and major routes. Features include a covered front porch, spacious upper level, and practical floor plan ready for your vision. Great opportunity for investors, first-time buyers, or anyone looking to restore and add value to a classic home. Property sold as-is.
Key facts
- Covered front porch
- Practical floor plan
- Convenient access
Tags
Property features AI
Finance
- HOA & community: Homeowners association present
Exterior
- Utilities: Public water; Public sewer
- Home design: Single-family residence; One-and-a-half story
- Construction: Aluminum siding
- Exterior features: Lot approximately 0.06 acres; Lot dimensions: 2614
Interior
- Bathrooms: 1 full bathroom
- Heating & cooling: Electric forced-air heating; No cooling system
- Interior features: 5 total rooms; Basement present
Neighborhood map
What this means for you Summary
Snapshot
- This is a 2-bed/1.0-bath single-family listed at $44k.
Deal economics
- At list price, monthly cash flow is $675 ($8k/yr) — positive.
- The deal already cash-flows at list — no discount required.
- Meets the 1% rule at list price ($1k rent vs $44k).
- Recommended offer: $43k (1.5% below list) — sets the bar for market timing.
- Cap rate 24.7% vs local median 4.1% in Kalamazoo — top-decile yield for the area; either an underpriced asset or a hidden risk that comps aren't pricing in. Stress-test before assuming the spread holds.
Location & tenants
- Location reads 76/100 on livability (#141 in MI, #3,492 nationally) — a middle-class / working-renter tenant base. Strengths: commute A+, cost of living A+, housing A+; Watch: crime F, employment D-.
- Kalamazoo Public Schools (urban): math 43% / reading 72% proficiency, ranked #71 of 540 in MI (top 13%) — acceptable for families but not a draw, mixed tenant base, ~2y average lease; 66% free/reduced lunch — lower-income household profile, screen leases tightly.
- Market conditions: Rents soft (-0.8%/yr); 77 active listings in the ZIP; 19 comparable units currently listed for rent nearby; rentals at typical pace (median 21d on market — plan ~3-4 weeks tenant-placement turnaround); lower-income renter base — watch delinquency; 339 units permitted in Kalamazoo County in 2024 (22 in 5+ unit buildings).
- This rent runs 38% of the median local income ($39k/yr) — at the standard rent-burdened threshold; future hikes will face affordability resistance.
Forward outlook
- Local home prices are declining (-3.0%/yr); year-one equity from $304 of loan paydown is wiped out by about $1k of value loss. Plan a longer hold.
- Kalamazoo County population projected at +18% by 2050 — long-run rental-demand tailwind backs the buy-and-hold thesis.
- At projected returns (-3.0% appreciation + 0.0% rent growth), your $12k cash investment doubles in ~2 years — after that, you're playing with house money.
Negotiation context
- It's been on market 30 days — a 2% lower offer ($43k) is reasonable based on typical stale-listing flexibility.
- 4 sale attempts since 30y ago; this cycle's ask has dropped $6k (12%) from the opening price — seller is motivated, your offer sets the floor, not the list.
Risks & watch-outs
- Watch-outs: built in 1885 — expect roof / HVAC / electrical / plumbing capex.
Questions for the listing agent
- Built in 1885 — when were the roof, HVAC, electrical panel, plumbing, and water heater last replaced?
- Is there a deadline driving the sale (1031 exchange, divorce, estate, relocation)? That informs how much negotiation room exists.
- Crime grade is F in this area — have there been break-ins, vandalism, or insurance claims at this property in the last 3 years? What carrier currently insures it and at what premium?
- What's the average days-on-market for RENTAL listings here right now (not sales)? A rising rental-DOM trend means longer vacancies and softer asking-rent achievability than the comps imply.
- What's the recent tenant-quality profile in this submarket — average credit score on applications, eviction rate, late-payment / NSF rate, and stable-employment percentage? A property-management company in the area should have these aggregated.
- How much new for-sale + rental construction is in the pipeline within 1–3 miles? Heavy new supply typically softens prices + rents 12–24 months out; constrained supply supports both.
Investment metrics
- 1% rule
- 2.86% ✓
- Cap rate
- 24.75%
- Cash-on-cash
- 65.92%
- DSCR
- 3.93
- GRM
- 2.9
CMA / ARV
- ARV (on-the-fly)
- $104,580
- Comps found
- 12
Show comp detail 12 sales within ~0.75 mi
| Address | Dist | Beds/Ba | Sqft | Sold | Price | $/sf | Match |
|---|---|---|---|---|---|---|---|
| 610 Bosker Ave | 0.06mi | 2/1.0 | 1,000 (+0%) | 5mo | $37,000 | $37 | 92 |
| 1530 N Park St | 0.19mi | 3/1.0 (+1) | 1,018 (+2%) | 0mo | $110,500 | $109 | 82 |
| 1520 N Park St | 0.19mi | 3/1.0 (+1) | 1,000 (+0%) | 12mo | $105,000 | $105 | 76 |
| 925 N Church St | 0.37mi | 3/1.0 (+1) | 958 (-4%) | 3mo | $53,000 | $55 | 69 |
| 636 Mabel St | 0.33mi | 3/1.5 (+1) | 958 (-4%) | 9mo | $118,900 | $124 | 64 |
| 311 Bessie St | 0.19mi | 3/1.0 (+1) | 900 (-10%) | 10mo | $70,000 | $78 | 62 |
| 916 Hawley St | 0.52mi | 2/1.0 | 900 (-10%) | 6mo | $112,000 | $124 | 55 |
| 1115 Woodward Ave | 0.37mi | 3/1.0 (+1) | 1,144 (+15%) | 1mo | $103,000 | $90 | 52 |
| 1628 N Edwards St | 0.54mi | 2/1.0 | 919 (-8%) | 13mo | $89,500 | $97 | 52 |
| 621 Ada St | 0.49mi | 2/1.0 | 1,131 (+14%) | 10mo | $133,000 | $118 | 46 |
| 1809 Douglas Ave Ave | 0.72mi | 3/1.0 (+1) | 1,091 (+10%) | 8mo | $100,000 | $92 | 39 |
| 1311 Alamo Ave | 0.73mi | 3/1.0 (+1) | 1,073 (+8%) | 14mo | $125,000 | $116 | 37 |
Match score weights: distance 35% · size 25% · config 20% · recency 20%. Top-matched comps best support the ARV.
Projected returns pro-forma
-3.0% appreciation · 0.0% rent growth · sell at horizon
- IRR
- 61.7%
- Equity multiple
- 3.62×
- Total profit
- $32,239
- Equity at exit
- $6,546
- IRR
- 65.2%
- Equity multiple
- 6.64×
- Total profit
- $69,344
- Equity at exit
- $3,796
Cash invested: $12,292 (down + closing). Projections, not guarantees.
Landlord ↔ Tenant lean methodology
- Overall (STATE)
- 62 Landlord-Friendly
- State Michigan
- 62 Landlord-Friendly · EVEN
- County
- — inherits STATE
- City
- — inherits STATE
ZIP-level market 49007
- Rents YoY
- -0.8%
- Active inventory
- 77
- Price-to-rent
- 2.9×
Monthly cashflow live
- Estimated rent
- $1,255 high interval (Pro) →
- Mortgage (P&I)
- −$230
- Tax from tax record
- −$68 /mo · $811/yr
- Insurance
- −$18
- HOA
- −$0
- Vacancy / Maint / Mgmt
- −$264
- Net cashflow
- $675
Break-even live
UW: 25.0% down · 7.5% · 30yr · 1.5% tax · 5.0% vac · 8.0% maint · 8.0% mgmt
Financing live
Cash to close
- Down payment
- $10,975
- Closing costs
- $1,317
- Reserves months
- —
- Total cash needed
- —
Loan-product check · same deal, 3 products live
Conventional
25% down · 7.5% · 30yr
- Down + closing
- —
- Monthly P&I
- —
- Monthly cashflow
- —
- DSCR
- —
- Eligible?
- —
Personal DTI + credit; lowest rate.
DSCR
20% down · 8.5% · 30yr
- Down + closing
- —
- Monthly P&I
- —
- Monthly cashflow
- —
- DSCR
- —
- Eligible?
- —
No personal income docs; deal must DSCR.
Hard money
10% down · 12.0% · 12mo
- Down + closing
- —
- Monthly P&I
- —
- Monthly cashflow
- —
- DSCR
- —
- Eligible?
- —
Short-term bridge; refi at stabilization.
Rent comps 19 comps
| Address | Beds | Baths | Sqft | Rent | $/sqft | DOM | Units | Dist |
|---|---|---|---|---|---|---|---|---|
| 815 N Pitcher St Unit 12 Kalamazoo, MI | 2.0 | 2.0 | 982 | $1,550 | $1.58 | 21d | 1 | 0.65mi |
| 805 Douglas Ave Unit 1 Kalamazoo, MI | 1.0 | 1.0 | 600 | $875 | $1.46 | 13d | 1 | 0.68mi |
| 807 Ferris Ct Unit 1 Kalamazoo, MI | 1.0 | 1.0 | 680 | $910 | $1.34 | 21d | 1 | 0.81mi |
| 807 Ferris Ct Unit 3 Kalamazoo, MI | 1.0 | 1.0 | 680 | $870 | $1.28 | 21d | 1 | 0.81mi |
| 323 Woodward Ave Unit 2 Kalamazoo, MI | 1.0 | 1.0 | 700 | $1,350 | $1.93 | 21d | 1 | 0.82mi |
| 315 Woodward Ave Unit 5 Kalamazoo, MI | 1.0 | 1.0 | 600 | $715 | $1.19 | 13d | 1 | 0.84mi |
| 232 Woodward Ave Apt 1 Kalamazoo, MI | 1.0 | 1.0 | 800 | $1,199 | $1.50 | 21d | 1 | 0.85mi |
| 525 E Ransom St Kalamazoo, MI | 1.0–2.0 | 1.0–2.0 | 807 | $1,625 | $2.01 | 21d | 1 | 0.89mi |
| 816 W Main St Kalamazoo, MI | 3.0 | 1.0 | 1005 | $1,100 | $1.09 | 21d | 1 | 0.94mi |
| 310 E Michigan Ave Kalamazoo, MI | 2.0 | 2.0 | 1100 | $1,385 | $1.26 | 21d | 1 | 1.02mi |
| 266 E Michigan Ave Unit 402 Kalamazoo, MI | 1.0 | 1.5 | 900 | $1,895 | $2.11 | 21d | 1 | 1.02mi |
| 809 W Cedar St Unit 2 Kalamazoo, MI | 1.0 | 1.0 | 600 | $795 | $1.32 | 21d | 1 | 1.24mi |
| 2420 Upper Riverview Dr Kalamazoo, MI | 3.0 | 1.0 | 925 | $1,300 | $1.41 | 21d | 1 | 1.26mi |
| 530 S Rose St Kalamazoo, MI | 1.0 | 1.0 | 695 | $1,352 | $1.94 | 13d | 1 | 1.30mi |
| 3205 Douglas Ave Kalamazoo, MI | 2.0–3.0 | 1.0–2.0 | 912 | $1,169 | $1.28 | 13d | 1 | 1.42mi |
| 136 S Berkley St Kalamazoo, MI | 2.0 | 1.0 | 840 | $1,195 | $1.42 | 21d | 1 | 1.45mi |
| 807 Central Park Cir Kalamazoo, MI | 1.0–3.0 | 1.0–2.0 | 1089 | $1,908 | $1.75 | 13d | 12 | 1.45mi |
| 603 W Vine St Unit 4 Kalamazoo, MI | 1.0 | 1.0 | 657 | $875 | $1.33 | 13d | 1 | 1.46mi |
| 525 Sprague Ave Unit 1 Kalamazoo, MI | 1.0 | 1.0 | 525 | $810 | $1.54 | 21d | 1 | 1.48mi |
Listing history 22 events
-
2026-06-18days on market $43,900 Active 30 DOM
-
2026-06-17days on market $43,900 Active 29 DOM
-
2026-06-16days on market $43,900 Active 28 DOM
-
2026-06-15days on market $43,900 Active 27 DOM
-
2026-06-14days on market $43,900 Active 25 DOM
-
2026-06-13days on market $43,900 Active 24 DOM
-
2026-06-10days on market $43,900 Active 22 DOM
-
2026-06-09pricedays on market $43,900 Active 21 DOM
-
2026-06-08days on market $48,900 Active 20 DOM
-
2026-06-07days on market $48,900 Active 19 DOM
-
2026-06-05days on market $48,900 Active 16 DOM
-
2026-06-03days on market $48,900 Active 15 DOM
-
2026-06-02pricedays on market $48,900 Active 14 DOM
-
2026-06-01days on market $49,900 Active 13 DOM
-
2026-05-31days on market $49,900 Active 12 DOM
-
2026-05-30days on market $49,900 Active 11 DOM
-
2026-05-19$49,900 Active 512-char remark
Show marketing remark (512 chars)
Historic 1885 home located in the heart of Kalamazoo's Northside neighborhood. This 1.5-story traditional property offers timeless character, solid rental or investment potential, and convenient access to downtown Kalamazoo, schools, public transit, and major routes. Features include a covered front porch, spacious upper level, and practical floor plan ready for your vision. Great opportunity for investors, first-time buyers, or anyone looking to restore and add value to a classic home. Property sold as-is.
-
2026-05-19$49,900 Active
Show marketing remark (512 chars)
Historic 1885 home located in the heart of Kalamazoo's Northside neighborhood. This 1.5-story traditional property offers timeless character, solid rental or investment potential, and convenient access to downtown Kalamazoo, schools, public transit, and major routes. Features include a covered front porch, spacious upper level, and practical floor plan ready for your vision. Great opportunity for investors, first-time buyers, or anyone looking to restore and add value to a classic home. Property sold as-is.
-
2014-09-15historical
-
1996-05-28historical
-
1996-02-28$21,900
-
1996-02-28$21,900
ⓘ Source: listings_history table (triggers on properties + properties_extension) + one-shot
backfill from property_details.listing_events for pre-trigger history.
Tax reassessment forecast MI · Partial reset (capped growth)
- Current annual tax
- $811 · $68/mo
- Projected year-2 tax
- $811 · $68/mo
- Expected delta
- $0/yr ($0/mo · -0.0%)
ⓘ Screening estimate from a state-policy table — verify with the county assessor before closing.
Climate risk First Street
- Flood 1/10 Low FEMA zone X (unshaded) · 0% chance over 30 yrs
- Wildfire 1/10 Low
- Heat 2/10 Low 7 d/yr ≥100°F today · 16 d/yr by 30 yrs out
- Wind 2/10 Low
- Air quality 2/10 Low 1 unhealthy d/yr today · 2 by 30 yrs out
Nearby sold comps map
Loading sold comps map…
Walkable amenities ~0.75 mi
Loading nearby amenities…
Taxation est. · year 1
- Rental income
- $15,057
- − Mortgage interest
- −$2,459
- − Property taxes
- −$811
- − Insurance
- −$220
- − Repairs & maintenance
- −$1,205
- − Management
- −$1,205
- − Depreciation
- −$1,277
- Taxable income
- $7,882
- Est. tax owed @ 24.0%
- −$1,892
- After-tax cash flow
- $6,211/yr
For passive investors: Depreciation is non-cash, so a rental often shows a tax loss while cash-flowing — sheltering income. Rental losses are passive: they offset passive income freely, and up to $25,000/yr can offset ordinary (W-2) income if you actively participate and your MAGI is under $100k (phasing out to $0 by $150k); unused losses carry forward. On sale, claimed depreciation is recaptured at up to 25%, and gains may owe capital-gains tax (a 1031 exchange can defer both). Figures are a year-1 estimate at your 24.0% rate — not tax advice; consult a CPA.
Schools (NCES district)
- District
- Kalamazoo Public Schools
- NCES district ID
- 2619950
- Math proficiency
- 43% ▲ 13.00%
- Reading proficiency
- 72% ▲ 33.00%
- Median HH income
- $35,291
- Composite
- 47.48/100
- National rank
- #2275
- State rank
- #71 of 540 in MI
Livability — Kalamazoo
- Score
- 76/100
- State rank
- #141
- US rank
- #3492
Category grades
Schools grade is shown separately in the Schools card above.
Census & demographics
- Census place
- Kalamazoo, MI
- County
- Kalamazoo County · 224,317 people
- City population
- 121,397
- Metro
- Kalamazoo-Portage, MI
- Population (ZIP)
- 9,836
- Household income
- $39,344
- Rent vs Own
- Severe rent burden
- 816.0
Population outlook (Kalamazoo County) Hauer SSP2
- Today (2025)
- 280,982 people
- By 2030
- 292,068 · +3.9%
- By 2040
- 312,191 · +11.1%
- By 2050
- 331,196 · +17.9%
- By 2075
- 379,021 · +34.9%
- By 2100
- 396,579 · +41.1%
Race, ethnicity, and origin ACS 2023
- Neighborhood character
- Diverse neighborhood (Simpson 0.61)
- Race & ethnicity
- White 44% Black 44% Two or more races 7% Hispanic / Latino 3%
- Common ancestry
- Iranian 3% Romanian 2% Lithuanian 1%
- Foreign-born
- 3% · Canada
- Languages at home
- 94% English-only · Spanish 4% French/Haitian/Cajun 1% Arabic 1%
Political lean MEDSL · Kalamazoo
- 2024 margin
- D (+17.7) · D 58.0% · R 40.3% · Other 1.7%
- 2008→2024 swing
- -1.8pp toward R · 2008: 19.5pp · 2024: 17.7pp
- All cycles
- 2024: D+17.7 2020: D+18.7 2016: D+12.8 2012: D+13.3 2008: D+19.5
Not yet ingested
- Civics
- —
Market trends
- HPI YoY
- ▼ -68.80%
- Current HPI
- 112.4973
- Rent YoY
- ▼ -0.85%
- Metro
- Kalamazoo-Portage, MI
- State GDP YoY
- ▲ 1.37%
- F500 in state
- 28
Industry mix (Fortune 500 HQ in MI)
| Industry | F500 HQs | Revenue |
|---|---|---|
| Automotive Parts | 3 | $48B |
|
||
| Automotive | 2 | $372B |
|
||
| Chemicals | 1 | $45B |
|
||
| Automotive Retail | 1 | $29B |
|
||
| Healthcare / Medical Devices | 1 | $23B |
|
||
| Automotive Technology | 1 | $20B |
|
||
Price history
+127.9% since first listed6 events — show timeline
- 2026-05-19 Listed $49,900 REALCOMP
- 2026-05-19 Listed $49,900 MiRealSource-MiMLS
- 2014-09-15 Listing Removed — SW Michigan MLS
- 1996-05-28 Listing Removed — REALCOMP
- 1996-02-28 Listed $21,900 REALCOMP
- 1996-02-28 Listed $21,900 SW Michigan MLS
Property tax history
+3.7%/yrLatest (2025): $811 · -58.0% YoY. Source: county tax records.
Cash-flow waterfall
monthlySold comps — $/sqft
last 12 mo · ≤1 miLoading sold comps…