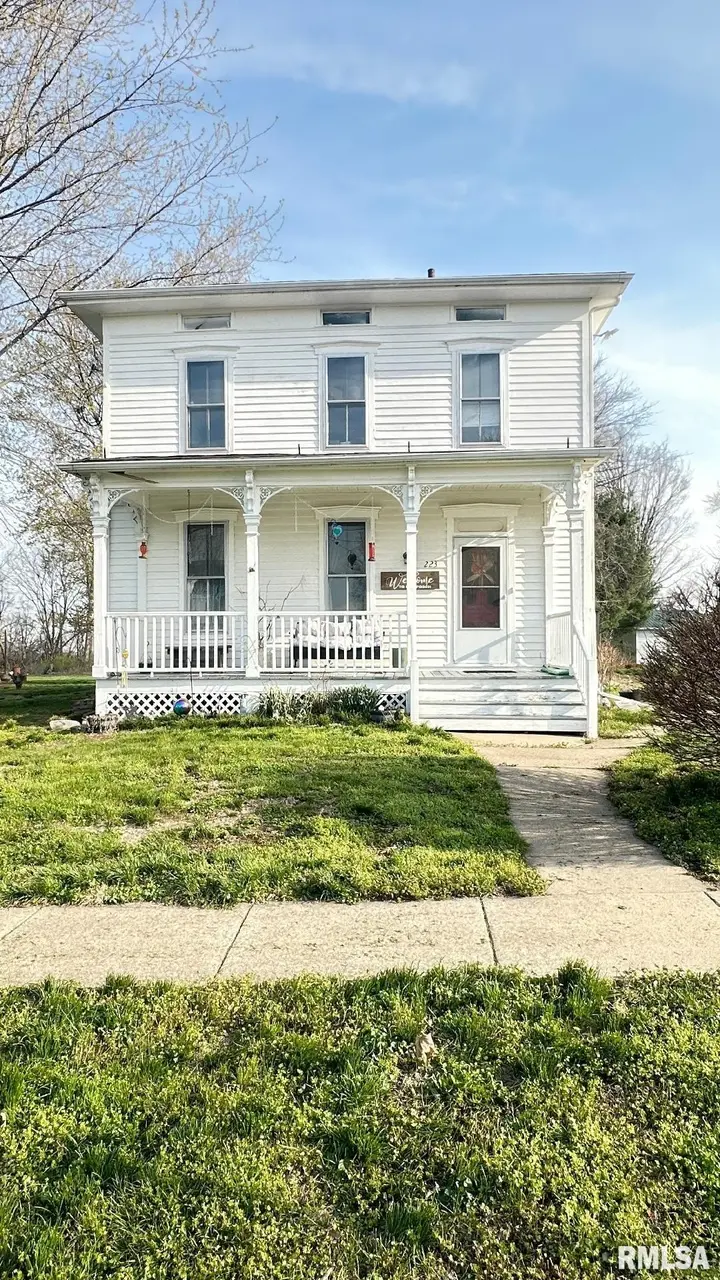
223 W High St · Mendon, IL
Flood risk 1/10 · Minimal
- FEMA flood zone
- X (unshaded)
- Chance of flooding over 30 yrs
- 0.0%
- Est. flood insurance / yr
- $473 – $860
Fire risk 1/10 · Minimal
- Est. fire insurance / yr
- $804 – $1,492
Heat risk 3/10 · Minor
- Hot days now (above 105°F)
- 7 days/yr
- Hot days in 30 yrs
- 17 days/yr
Wind risk 2/10 · Minimal
- Chance of severe wind over 30 yrs
- —
Air-quality risk 2/10 · Minimal
- Unhealthy air days now
- 0 days/yr
- Unhealthy air days in 30 yrs
- 1 days/yr
Risk factors via First Street. Map © Google.
Why this score? — see what drove the C+ grade
The composite is a weighted blend of 9 inputs, each scored 0–100. Each bar is that input's sub-score; the figure is the points it added to the 100-point composite (weight × sub-score).
- Cash flow +22.5/30.0
- Appreciation +8.0/10.0
- ARV discount +7.5/15.0
- DSCR +7.2/10.0
- 1% rule +5.9/10.0
- Livability +3.2/5.0
- Rent growth +2.5/5.0
- Condition / age +2.5/5.0
- Schools +1.7/10.0
$125,000
🖨 Deal sheet (PDF) 📄 Offer letter ✓ Due diligence
Listing remarks
Spacious 2-story home offering over 2,500 sq ft of finished living space, full of character and opportunity. Priced at approximately $50 per square foot, this property presents an incredible value for the size and potential it offers. Step inside and you’ll immediately notice the beautiful original woodwork and a stunning open staircase that creates a grand focal point upon entry. This home features 4 bedrooms, with the potential for a 5th bedroom, along with 2 full bathrooms, providing plenty of space for a growing household or flexible living arrangements. Situated on a large lot, there is ample room for outdoor enjoyment, additional parking, or future improvements. The home does ne
Key facts
- Open staircase
- Large lot
- Outdoor enjoyment
Tags
Property features AI
Exterior
- Parking: Detached parking
- Utilities: Public water; Public sewer
- Home design: Single family residence; Two levels
- Construction: Shingle roof; Building area approximately 2,582 (total living area); Not new construction
- Exterior features: Level lot
Interior
- Kitchen: Kitchen on main level (15 x 17) with vinyl flooring
- Bedrooms: 4 bedrooms; Bedroom 1 on main level (9 x 12) with hardwood flooring and egress window; Bedroom 2 on upper level (15 x 15) with carpet and egress window; Bedroom 3 on upper level (11 x 15) with carpet and egress window; Bedroom 4 on upper level (13 x 11) with carpet and egress window
- Flooring: Hardwood in at least one main-level bedroom; Carpet in multiple main and upper-level rooms (living, dining, several bedrooms); Vinyl in kitchen and laundry
- Bathrooms: 2 full bathrooms
- Heating & cooling: Forced air heating; Electric water heater
- Interior features: Partial basement; No fireplaces
- Laundry & utility: Main level laundry room (8 x 11) with vinyl flooring
Neighborhood map
What this means for you Summary
Snapshot
- This is a 4-bed/2.0-bath single-family listed at $125k.
Deal economics
- At list price, monthly cash flow is $211 ($3k/yr) — positive.
- The deal already cash-flows at list — no discount required.
- Meets the 1% rule at list price ($1k rent vs $125k).
- Recommended offer: $118k (6.0% below list) — sets the bar for market timing.
Location & tenants
- Location reads 65/100 on livability (#636 in IL) — a middle-class / working-renter tenant base. Strengths: crime A+, cost of living A+, housing A+; Watch: amenities F, commute F, health & safety F.
- CUSD 4 (rural): math 16% / reading 23% proficiency, ranked #429 of 620 in IL (top 69%) — low school quality limits family demand, transient renter base, plan for 1-2y turnover.
- Zoned schools: Unity High School (math 15% / reading 24%, grade F, #379 of 693 statewide, top 57%, 182 students, 0% FRL) — zoned schools average 0% FRL vs 28% district-wide (28 pts lower); this property's tenant base skews higher-income than the district average.
- Market conditions: 8 active listings in the ZIP; 68 units permitted in Adams County in 2024 (0 in 5+ unit buildings).
Forward outlook
- In year one you build about $8k of equity ($864 loan paydown + $7k appreciation (5.9% local appreciation)).
- Adams County population projected at -14% by 2050 — secular population decline; favor cash flow + early exit over multi-decade hold.
- At projected returns (5.9% appreciation + 3.0% rent growth), your $35k cash investment doubles in ~4 years — after that, you're playing with house money.
- By year 5, paydown + projected appreciation supports a ~$36k cash-out refi (75% LTV) — recoverable capital for the next deal without selling this one.
Negotiation context
- It's been on market 72 days — a 6% lower offer ($118k) is reasonable based on typical stale-listing flexibility.
Questions for the listing agent
- It's been on market 72 days. Have you received any prior offers? Is the seller open to a 6% concession, seller financing, or rate buy-down credit?
- Why hasn't it sold? Are there any deal-killer items the seller is aware of (foundation, flood, title, zoning, code violations)?
- Is there a deadline driving the sale (1031 exchange, divorce, estate, relocation)? That informs how much negotiation room exists.
- Schools are D-rated, which usually means shorter tenancies and higher turnover. Who's the typical renter profile here, and what's been the actual vacancy rate?
- What's the average days-on-market for RENTAL listings here right now (not sales)? A rising rental-DOM trend means longer vacancies and softer asking-rent achievability than the comps imply.
- What's the recent tenant-quality profile in this submarket — average credit score on applications, eviction rate, late-payment / NSF rate, and stable-employment percentage? A property-management company in the area should have these aggregated.
- How much new for-sale + rental construction is in the pipeline within 1–3 miles? Heavy new supply typically softens prices + rents 12–24 months out; constrained supply supports both.
Investment metrics
- 1% rule
- 1.09% ✓
- Cap rate
- 8.32%
- Cash-on-cash
- 7.22%
- DSCR
- 1.32
- GRM
- 7.7
CMA / ARV
No comps found within radius.
Projected returns pro-forma
5.93% appreciation · 3.0% rent growth · sell at horizon
- IRR
- 21.2%
- Equity multiple
- 2.40×
- Total profit
- $49,007
- Equity at exit
- $78,024
- IRR
- 20.3%
- Equity multiple
- 4.82×
- Total profit
- $133,822
- Equity at exit
- $141,016
Cash invested: $35,000 (down + closing). Projections, not guarantees.
Landlord ↔ Tenant lean methodology
- Overall (STATE)
- 43 Moderately Tenant-Leaning
- State Illinois
- 43 Moderately Tenant-Leaning · D+7
- County
- — inherits STATE
- City
- — inherits STATE
ZIP-level market 62351
- Home prices YoY
- 3.7%
- Active inventory
- 8
- Price-to-rent
- 7.7×
Monthly cashflow live
- Estimated rent
- $1,360 medium interval (Pro) →
- Mortgage (P&I)
- −$656
- Tax est. 1.5%
- −$156 /mo · $1,875/yr
- Insurance
- −$52
- HOA
- −$0
- Vacancy / Maint / Mgmt
- −$286
- Net cashflow
- $211
Break-even live
Sensitivity live
| Price | -10% $297 | -5% $254 | +0% $211 | +5% $167 | +10% $124 |
|---|---|---|---|---|---|
| Rent | -10% $103 | -5% $157 | +0% $211 | +5% $264 | +10% $318 |
| Rate | -1.0pp $274 | -0.5pp $242 | base $211 | +0.5pp $178 | +1.0pp $145 |
UW: 25.0% down · 7.5% · 30yr · 1.5% tax · 5.0% vac · 8.0% maint · 8.0% mgmt
Financing live
Cash to close
- Down payment
- $31,250
- Closing costs
- $3,750
- Reserves months
- —
- Total cash needed
- —
Loan-product check · same deal, 3 products live
Conventional
25% down · 7.5% · 30yr
- Down + closing
- —
- Monthly P&I
- —
- Monthly cashflow
- —
- DSCR
- —
- Eligible?
- —
Personal DTI + credit; lowest rate.
DSCR
20% down · 8.5% · 30yr
- Down + closing
- —
- Monthly P&I
- —
- Monthly cashflow
- —
- DSCR
- —
- Eligible?
- —
No personal income docs; deal must DSCR.
Hard money
10% down · 12.0% · 12mo
- Down + closing
- —
- Monthly P&I
- —
- Monthly cashflow
- —
- DSCR
- —
- Eligible?
- —
Short-term bridge; refi at stabilization.
Listing history 18 events
-
2026-06-21days on market $125,000 Under Contract 72 DOM
-
2026-06-18days on market $125,000 Under Contract 70 DOM
-
2026-06-17days on market $125,000 Under Contract 69 DOM
-
2026-06-16days on market $125,000 Under Contract 68 DOM
-
2026-06-15days on market $125,000 Under Contract 67 DOM
-
2026-06-13days on market $125,000 Under Contract 65 DOM
-
2026-06-12days on market $125,000 Under Contract 64 DOM
-
2026-06-09days on market $125,000 Under Contract 61 DOM
-
2026-06-08days on market $125,000 Under Contract 60 DOM
-
2026-06-07days on market $125,000 Under Contract 59 DOM
-
2026-06-07days on market $125,000 Under Contract 58 DOM
-
2026-06-04days on market $125,000 Under Contract 55 DOM
-
2026-06-02days on market $125,000 Under Contract 54 DOM
-
2026-06-01days on market $125,000 Under Contract 53 DOM
-
2026-05-31days on market $125,000 Under Contract 52 DOM
-
2026-05-31days on market $125,000 Under Contract 51 DOM
-
2026-04-20historical Under Contract
-
2026-04-09$125,000 Active
ⓘ Source: listings_history table (triggers on properties + properties_extension) + one-shot
backfill from property_details.listing_events for pre-trigger history.
Climate risk First Street
- Flood 1/10 Low FEMA zone X (unshaded) · 0% chance over 30 yrs
- Wildfire 1/10 Low
- Heat 3/10 Moderate 7 d/yr ≥105°F today · 17 d/yr by 30 yrs out
- Wind 2/10 Low
- Air quality 2/10 Low 0 unhealthy d/yr today · 1 by 30 yrs out
Nearby sold comps map
Loading sold comps map…
Walkable amenities ~0.75 mi
Loading nearby amenities…
Taxation est. · year 1
- Rental income
- $16,322
- − Mortgage interest
- −$7,002
- − Property taxes
- −$1,875
- − Insurance
- −$625
- − Repairs & maintenance
- −$1,306
- − Management
- −$1,306
- − Depreciation
- −$3,636
- Taxable income
- $572
- Est. tax owed @ 24.0%
- −$137
- After-tax cash flow
- $2,391/yr
For passive investors: Depreciation is non-cash, so a rental often shows a tax loss while cash-flowing — sheltering income. Rental losses are passive: they offset passive income freely, and up to $25,000/yr can offset ordinary (W-2) income if you actively participate and your MAGI is under $100k (phasing out to $0 by $150k); unused losses carry forward. On sale, claimed depreciation is recaptured at up to 25%, and gains may owe capital-gains tax (a 1031 exchange can defer both). Figures are a year-1 estimate at your 24.0% rate — not tax advice; consult a CPA.
Schools (NCES district)
- District
- CUSD 4
- NCES district ID
- 1725590
- Math proficiency
- 16% ▼ -5.00%
- Reading proficiency
- 23% ▼ -6.00%
- Median HH income
- $48,758
- Composite
- 17.36/100
- National rank
- #9077
- State rank
- #429 of 620 in IL
Livability — Mendon
- Score
- 65/100
- State rank
- #636
- US rank
- #13015
Category grades
Schools grade is shown separately in the Schools card above.
Census & demographics
- Census place
- Mendon, IL
- Population (ZIP)
- 2,026
Population outlook (Adams County) Hauer SSP2
- Today (2025)
- 65,795 people
- By 2030
- 64,436 · -2.1%
- By 2040
- 61,007 · -7.3%
- By 2050
- 56,851 · -13.6%
- By 2075
- 46,424 · -29.4%
- By 2100
- 34,305 · -47.9%
Race, ethnicity, and origin ACS 2023
- Neighborhood character
- Predominantly White (99%)
- Race & ethnicity
- White 99%
- Common ancestry
- Lithuanian 1% Scottish 1% Romanian 1%
- Foreign-born
- 0%
Political lean MEDSL · Adams
- 2024 margin
- Solid R (+47.4) · D 25.6% · R 73.0% · Other 1.5%
- 2008→2024 swing
- -25.0pp toward R · 2008: -22.4pp · 2024: -47.4pp
- All cycles
- 2024: R+47.4 2020: R+46.5 2016: R+47.5 2012: R+35.2 2008: R+22.4
Not yet ingested
- Civics
- —
Market trends
- HPI YoY
- ▲ 5.93%
- Current HPI
- 166.7847
- Rent YoY
- —
- Metro
- —
- State GDP YoY
- ▲ 1.59%
- F500 in state
- 60
Industry mix (Fortune 500 HQ in IL)
| Industry | F500 HQs | Revenue |
|---|---|---|
| Insurance | 4 | $201B |
|
||
| Consumer Goods | 4 | $87B |
|
||
| Industrial Machinery | 3 | $64B |
|
||
| Healthcare | 2 | $55B |
|
||
| Retail / Pharmacy | 1 | $148B |
|
||
| Agriculture / Food | 1 | $86B |
|
||
Price history
2 events — show timeline
- 2026-04-20 Contingent — RMLSA as Distributed by MLS Grid
- 2026-04-09 Listed $125,000 RMLSA as Distributed by MLS Grid
Cash-flow waterfall
monthlySold comps — $/sqft
last 12 mo · ≤1 miLoading sold comps…