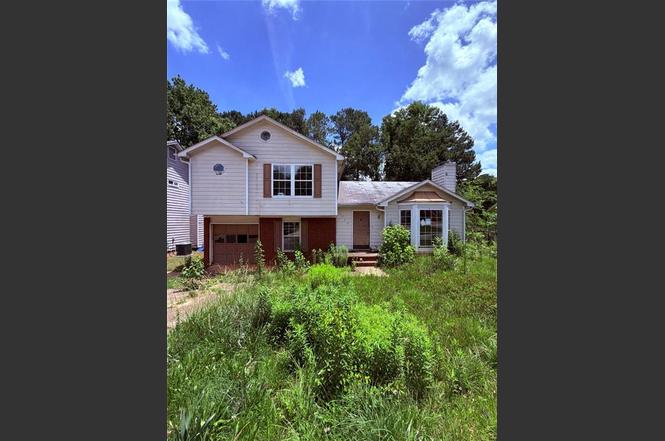
3738 Sandy Shoals Ln · Panthersville, GA
Flood risk 1/10 · Minimal
- FEMA flood zone
- X (unshaded)
- Chance of flooding over 30 yrs
- 0.0%
- Est. flood insurance / yr
- $507 – $1,088
Fire risk 3/10 · Minor
- Est. fire insurance / yr
- $963 – $1,789
Heat risk 6/10 · Moderate
- Hot days now (above 105°F)
- 7 days/yr
- Hot days in 30 yrs
- 19 days/yr
Wind risk 6/10 · Moderate
- Chance of severe wind over 30 yrs
- 27.0%
Air-quality risk 5/10 · Moderate
- Unhealthy air days now
- 6 days/yr
- Unhealthy air days in 30 yrs
- 8 days/yr
Risk factors via First Street. Map © Google.
Why this score? — see what drove the C grade
The composite is a weighted blend of 9 inputs, each scored 0–100. Each bar is that input's sub-score; the figure is the points it added to the 100-point composite (weight × sub-score).
- Cash flow +20.1/30.0
- ARV discount +15.0/15.0
- DSCR +6.4/10.0
- 1% rule +5.9/10.0
- Livability +3.3/5.0
- Rent growth +3.0/5.0
- Condition / age +2.5/5.0
- Schools +2.1/10.0
- Appreciation +0.0/10.0
$179,900
🖨 Deal sheet 📄 Offer letter ✓ Due diligence
Listing remarks MLS
Situated in an established Decatur neighborhood, 3738 Sandy Shoals Lane presents an excellent opportunity for investors, renovators, or buyers looking to add value through improvements. The property has has a brand new electrical system installed (permitted and done to code) and offers a functional floor plan with solid bones and the chance to customize and modernize to fit your vision. With ample outdoor space and convenient access to schools, shopping, dining, and major transportation routes, this home is well-positioned for future appreciation. Whether you're seeking your next investment project or a property to make your own, Sandy Shoals offers strong potential at an attractive entry point.
Key facts
- Ample outdoor space
- 6,098 sq ft lot
- Garage
Tags
Property features AI
Exterior
- Parking: Garage (1 garage space); Total parking for 2 vehicles
- Utilities: Public water; Public sewer; Electric service with 220 volts (220V available in garage); Electricity available; Cable available; Sewer available
- Home design: Multi/split levels; Fixer condition; Slab foundation
- Construction: Frame construction; Composition roof; Built on slab foundation
- Exterior features: Front porch; Deck
Interior
- Kitchen: Stained cabinets
- Bedrooms: Three bedrooms on the upper level
- Flooring: Hardwood floors
- Bathrooms: Two full bathrooms; One half bathroom; Master bath with tub/shower combo
- Heating & cooling: Forced-air heating; Cooling: Other
- Interior features: One fireplace in the living room; Open-concept dining area; Den; Other interior features
- Laundry & utility: Laundry located in the garage
Neighborhood map
What this means for you Summary
Snapshot
- This is a 3-bed/2.0-bath single-family listed at $180k.
Deal economics
- At list price, monthly cash flow is $225 ($3k/yr) — positive.
- The deal already cash-flows at list — no discount required.
- Meets the 1% rule at list price ($2k rent vs $180k).
- Cap rate 7.8% vs local median 5.3% in Panthersville — top-decile yield for the area; either an underpriced asset or a hidden risk that comps aren't pricing in. Stress-test before assuming the spread holds.
Location & tenants
- Location reads 66/100 on livability (#180 in GA) — a middle-class / working-renter tenant base. Strengths: cost of living A+, housing A+; Watch: crime C-, employment D, amenities F.
- Dekalb County (suburban): math 19% / reading 28% proficiency, ranked #125 of 174 in GA (top 72%) — low school quality limits family demand, transient renter base, plan for 1-2y turnover; 68% free/reduced lunch — lower-income household profile, screen leases tightly.
- Zoned schools: Cedar Grove Middle School (math 2% / reading 17%, grade F, #433 of 470 statewide, top 93%, 777 students, 100% FRL); Cedar Grove High School (math 8% / reading 17%, grade F, #336 of 424 statewide, top 80%, 1,123 students, 100% FRL) — zoned schools average 100% FRL vs 68% district-wide (32 pts higher); higher-poverty schools than district average — tighter screening recommended.
- Zoned-school proficiency averages 11% at this address vs 24% district-wide (-12 pts) — the specific schools serving this property underperform the Dekalb County average; the district grade overstates school quality for this exact location.
- Market conditions: Rents rising (+2.2%/yr); 353 active listings in the ZIP; 40 comparable units currently listed for rent nearby; rentals at typical pace (median 24d on market — plan ~3-4 weeks tenant-placement turnaround); 48% of comp listings sitting > 30 days — soft ceiling on asking rent; 1,240 units permitted in DeKalb County in 2024 (385 in 5+ unit buildings).
- This rent runs 37% of the median local income ($64k/yr) — at the standard rent-burdened threshold; future hikes will face affordability resistance.
Forward outlook
- Local home prices are declining (-3.0%/yr); year-one equity from $1k of loan paydown is wiped out by about $5k of value loss. Plan a longer hold.
- DeKalb County population projected at +28% by 2050 — long-run rental-demand tailwind backs the buy-and-hold thesis.
Negotiation context
- Only 8 days on market — expect competitive offers; lowballing is unlikely to land.
- 3 sale attempts with the ask held roughly flat each time — persistent listings suggest the price (not the market) is what's stuck; bring a comps-based counter.
- Current owner paid $87k; list at $180k implies a 106% gain — meaningful room to come down on a strong offer.
Risks & watch-outs
- Climate carrying-cost: major wind risk, 27% chance of damaging wind over 30y; extreme-heat days projected 7→19/yr by 2055 (HVAC capex compounding) — expect insurance premiums to compound above CPI over the hold.
Questions for the listing agent
- Is there a deadline driving the sale (1031 exchange, divorce, estate, relocation)? That informs how much negotiation room exists.
- Schools are D-rated, which usually means shorter tenancies and higher turnover. Who's the typical renter profile here, and what's been the actual vacancy rate?
- What's the average days-on-market for RENTAL listings here right now (not sales)? A rising rental-DOM trend means longer vacancies and softer asking-rent achievability than the comps imply.
- What's the recent tenant-quality profile in this submarket — average credit score on applications, eviction rate, late-payment / NSF rate, and stable-employment percentage? A property-management company in the area should have these aggregated.
- How much new for-sale + rental construction is in the pipeline within 1–3 miles? Heavy new supply typically softens prices + rents 12–24 months out; constrained supply supports both.
Investment metrics
- 1% rule
- 1.09% ✓
- Cap rate
- 7.79%
- Cash-on-cash
- 5.35%
- DSCR
- 1.24
- GRM
- 7.6
CMA / ARV
- ARV (on-the-fly)
- $223,795
- Comps found
- 12
Show comp detail 12 sales within ~0.75 mi
| Address | Dist | Beds/Ba | Sqft | Sold | Price | $/sf | Match |
|---|---|---|---|---|---|---|---|
| 4105 Conley Pond Ct | 0.21mi | 3/2.5 | 1,448 (-8%) | 1mo | $251,000 | $173 | 75 |
| 3865 Cress Way Dr | 0.19mi | 3/2.0 | 1,474 (-6%) | 8mo | $188,000 | $128 | 75 |
| 4069 Cress Way Run | 0.17mi | 3/2.5 | 1,715 (+10%) | 5mo | $214,000 | $125 | 70 |
| 2993 Oakvale Hts | 0.45mi | 3/2.0 | 1,608 (+3%) | 6mo | $210,000 | $131 | 70 |
| 3308 River Run Trl | 0.30mi | 3/2.5 | 1,676 (+7%) | 6mo | $210,000 | $125 | 67 |
| 3375 River Run Trl | 0.37mi | 3/2.5 | 1,454 (-7%) | 4mo | $236,000 | $162 | 66 |
| 4169 Riverbank Ct | 0.42mi | 3/1.5 | 1,460 (-7%) | 4mo | $209,000 | $143 | 64 |
| 3954 Riverside Pkwy | 0.35mi | 3/2.5 | 1,715 (+10%) | 4mo | $269,900 | $157 | 62 |
| 3268 Rivermist Cv | 0.32mi | 3/2.0 | 1,742 (+11%) | 6mo | $245,000 | $141 | 61 |
| 2876 River Close Dr | 0.72mi | 3/2.5 | 1,607 (+3%) | 1mo | $255,000 | $159 | 59 |
| 3716 Cress Way Dr | 0.43mi | 4/2.5 (+1) | 1,669 (+7%) | 4mo | $170,000 | $102 | 58 |
| 3028 N Oak Ct | 0.71mi | 3/2.5 | 1,643 (+5%) | 3mo | $250,000 | $152 | 54 |
Match score weights: distance 35% · size 25% · config 20% · recency 20%. Top-matched comps best support the ARV.
Projected returns pro-forma
-3.0% appreciation · 2.18% rent growth · sell at horizon
- IRR
- -8.9%
- Equity multiple
- 0.68×
- Total profit
- $-16,367
- Equity at exit
- $26,824
- IRR
- -0.6%
- Equity multiple
- 0.96×
- Total profit
- $-1,982
- Equity at exit
- $15,554
Cash invested: $50,372 (down + closing). Projections, not guarantees.
Landlord ↔ Tenant lean methodology
- Overall (STATE)
- 90 Strongly Landlord-Friendly
- State Georgia
- 90 Strongly Landlord-Friendly · R+3
- County
- — inherits STATE
- City
- — inherits STATE
ZIP-level market 30034
- Home prices YoY
- -27.4%
- Rents YoY
- 2.2%
- Active inventory
- 353
- Price-to-rent
- 7.6×
Monthly cashflow live
- Estimated rent
- $1,964 high interval (Pro) →
- Mortgage (P&I)
- −$943
- Tax from tax record
- −$308 /mo · $3,698/yr
- Insurance
- −$75
- HOA
- −$0
- Vacancy / Maint / Mgmt
- −$412
- Net cashflow
- $225
Break-even live
UW: 25.0% down · 7.5% · 30yr · 1.5% tax · 5.0% vac · 8.0% maint · 8.0% mgmt
Financing live
Cash to close
- Down payment
- $44,975
- Closing costs
- $5,397
- Reserves months
- —
- Total cash needed
- —
Loan-product check · same deal, 3 products live
Conventional
25% down · 7.5% · 30yr
- Down + closing
- —
- Monthly P&I
- —
- Monthly cashflow
- —
- DSCR
- —
- Eligible?
- —
Personal DTI + credit; lowest rate.
DSCR
20% down · 8.5% · 30yr
- Down + closing
- —
- Monthly P&I
- —
- Monthly cashflow
- —
- DSCR
- —
- Eligible?
- —
No personal income docs; deal must DSCR.
Hard money
10% down · 12.0% · 12mo
- Down + closing
- —
- Monthly P&I
- —
- Monthly cashflow
- —
- DSCR
- —
- Eligible?
- —
Short-term bridge; refi at stabilization.
Rent comps 40 comps
| Address | Beds | Baths | Sqft | Rent | $/sqft | DOM | Units | Dist |
|---|---|---|---|---|---|---|---|---|
| 3828 Landgraf Cv Decatur, GA | 3.0 | 2.0 | 1548 | $2,073 | $1.34 | 5d | 1 | 0.09mi |
| 3830 Riverside Pkwy Decatur, GA | 3.0 | 2.5 | 1286 | $1,860 | $1.45 | 1d | 1 | 0.18mi |
| 3868 Leyland Dr Decatur, GA | 3.0 | 2.5 | 1312 | $1,923 | $1.47 | 43d | 1 | 0.22mi |
| 4023 Riverside Pkwy Decatur, GA | 4.0 | 3.0 | 1870 | $2,090 | $1.12 | 43d | 1 | 0.27mi |
| 3328 River Run Trl Decatur, GA | 3.0 | 2.0 | 1665 | $1,981 | $1.19 | 1d | 1 | 0.29mi |
| 3075 Dogwood Ave Decatur, GA | 4.0 | 2.5 | 1902 | $2,270 | $1.19 | 5d | 1 | 0.32mi |
| 3644 Gray Birch Dr Decatur, GA | 3.0 | 2.0 | 1860 | $2,000 | $1.08 | 20d | 1 | 0.33mi |
| 3848 Laurenhill Ln Decatur, GA | 3.0 | 2.5 | 1834 | $1,900 | $1.04 | 5d | 1 | 0.33mi |
| 3833 Conley Downs Dr Decatur, GA | 3.0 | 1.5 | 1248 | $1,743 | $1.40 | 5d | 1 | 0.36mi |
| 3716 Cress Way Dr Decatur, GA | 4.0 | 2.5 | 1669 | $2,185 | $1.31 | 5d | 1 | 0.44mi |
| 2945 Woody Ct Decatur, GA | 3.0 | 2.5 | 1488 | $1,850 | $1.24 | 24d | 1 | 0.48mi |
| 3075 Oakvale Hts Decatur, GA | 3.0 | 2.5 | 1810 | $2,120 | $1.17 | 12d | 1 | 0.54mi |
| 2943 Duncan Pl Decatur, GA | 4.0 | 2.5 | 2168 | $2,800 | $1.29 | 43d | 1 | 0.57mi |
| 3189 Kingswood Gln Decatur, GA | 2.0 | 2.5 | 1152 | $2,100 | $1.82 | 43d | 1 | 0.66mi |
| 3914 Waldrop Ln Decatur, GA | 3.0 | 3.0 | 1560 | $1,697 | $1.09 | 3d | 1 | 0.68mi |
| 3906 Waldrop Ln Decatur, GA | 3.0 | 2.5 | 1560 | $1,700 | $1.09 | 43d | 1 | 0.68mi |
| 3525 Waldrop Trl Decatur, GA | 3.0 | 2.5 | 1560 | $1,695 | $1.09 | 21d | 1 | 0.68mi |
| 3516 Waldrop Trl Decatur, GA | 3.0 | 2.5 | 1560 | $1,800 | $1.15 | 43d | 1 | 0.70mi |
| 3169 Kingswood Gln Decatur, GA | 3.0 | 2.5 | 1560 | $1,575 | $1.01 | 43d | 1 | 0.70mi |
| 3489 Waldrop Trl Decatur, GA | 3.0 | 2.5 | 1400 | $1,400 | $1.00 | 43d | 1 | 0.72mi |
| 3474 Waldrop Trl Decatur, GA | 3.0 | 2.5 | 1412 | $800 | $0.57 | 43d | 1 | 0.74mi |
| 6303 Waldrop Pl Decatur, GA | 3.0 | 2.0 | 1292 | $1,900 | $1.47 | 43d | 1 | 0.75mi |
| 6201 Waldrop Pl Decatur, GA | 3.0 | 2.0 | 1300 | $1,350 | $1.04 | 18d | 1 | 0.75mi |
| 3575 Oakvale Rd Decatur, GA | 3.0–4.0 | 2.0 | 1374 | $1,095 | $0.80 | 15d | 4 | 0.76mi |
| 3733 Waldrop Hills Dr Decatur, GA | 3.0 | 2.5 | 1646 | $2,023 | $1.23 | 43d | 1 | 0.77mi |
| 11101 Waldrop Pl Decatur, GA | 3.0 | 2.0 | 1293 | $1,550 | $1.20 | 43d | 1 | 0.80mi |
| 3725 Patti Pkwy Decatur, GA | 4.0 | 2.0 | 1914 | $2,220 | $1.16 | 43d | 1 | 0.80mi |
| 3804 Waldrop Ln Decatur, GA | 3.0 | 2.5 | 1412 | $1,850 | $1.31 | 24d | 1 | 0.81mi |
| 3798 Waldrop Ln Decatur, GA | 3.0 | 2.5 | 1412 | $1,680 | $1.19 | 20d | 1 | 0.82mi |
| 3101 Waldrop Pl Decatur, GA | 3.0 | 2.0 | 1290 | $1,395 | $1.08 | 43d | 1 | 0.82mi |
| 3554 Waldrop Rd Decatur, GA | 3.0 | 2.5 | 1646 | $2,135 | $1.30 | 2d | 1 | 0.83mi |
| 3754 Waldrop Ln Decatur, GA | 3.0 | 2.5 | 1560 | $1,625 | $1.04 | 43d | 1 | 0.84mi |
| 3574 Saratoga Cir Decatur, GA | 3.0 | 2.5 | 1500 | $2,103 | $1.40 | 21d | 1 | 0.85mi |
| 3575 Oakvale Rd #402 Decatur, GA | 3.0 | 2.0 | 1420 | $1,623 | $1.14 | 1d | 1 | 0.85mi |
| 17301 Waldrop Cv Decatur, GA | 3.0 | 2.0 | 1292 | $1,550 | $1.20 | 18d | 1 | 0.87mi |
| 17301 Waldrop Cv Decatur, GA | 3.0 | 2.0 | 1292 | $1,550 | $1.20 | 43d | 1 | 0.87mi |
| 3763 Soapstone Rd Decatur, GA | 3.0 | 3.0 | 1400 | $1,700 | $1.21 | 24d | 1 | 0.87mi |
| 3364 Waldrop Trl Decatur, GA | 3.0 | 3.0 | 1200 | $1,800 | $1.50 | 43d | 1 | 0.88mi |
| 3581 Oakvale Falls Ct Decatur, GA | 3.0 | 2.5 | 1998 | $2,080 | $1.04 | 43d | 1 | 0.90mi |
| 4210 Waldrop Hills Ter Decatur, GA | 3.0 | 2.5 | 1200 | $1,666 | $1.39 | 43d | 1 | 0.93mi |
Listing history 6 events
-
2026-06-18days on market $179,900 Active 8 DOM
-
2026-06-17days on market $179,900 Active 7 DOM
-
2026-06-16days on market $179,900 Active 6 DOM
-
2026-06-15days on market $179,900 Active 5 DOM
-
2026-06-13remarks 699-char remark
-
2026-06-13$179,900 Active 3 DOM
ⓘ Source: listings_history table (triggers on properties + properties_extension) + one-shot
backfill from property_details.listing_events for pre-trigger history.
Tax reassessment forecast GA · Resets to sale price
- Current annual tax
- $3,698 · $308/mo
- Projected year-2 tax
- $3,698 · $308/mo
- Expected delta
- $0/yr ($0/mo · 0.0%)
ⓘ Screening estimate from a state-policy table — verify with the county assessor before closing.
Climate risk First Street
- Flood 1/10 Low FEMA zone X (unshaded) · 0% chance over 30 yrs
- Wildfire 3/10 Moderate
- Heat 6/10 Major 7 d/yr ≥105°F today · 19 d/yr by 30 yrs out
- Wind 6/10 Major 27% chance of damaging wind over 30 yrs
- Air quality 5/10 Major 6 unhealthy d/yr today · 8 by 30 yrs out
Nearby sold comps map
Loading sold comps map…
Walkable amenities ~0.75 mi
Loading nearby amenities…
Taxation est. · year 1
- Rental income
- $23,563
- − Mortgage interest
- −$10,077
- − Property taxes
- −$3,698
- − Insurance
- −$900
- − Repairs & maintenance
- −$1,885
- − Management
- −$1,885
- − Depreciation
- −$5,233
- Taxable loss
- −$115
- Est. tax savings @ 24.0%
- +$28
- After-tax cash flow
- $2,724/yr
For passive investors: Depreciation is non-cash, so a rental often shows a tax loss while cash-flowing — sheltering income. Rental losses are passive: they offset passive income freely, and up to $25,000/yr can offset ordinary (W-2) income if you actively participate and your MAGI is under $100k (phasing out to $0 by $150k); unused losses carry forward. On sale, claimed depreciation is recaptured at up to 25%, and gains may owe capital-gains tax (a 1031 exchange can defer both). Figures are a year-1 estimate at your 24.0% rate — not tax advice; consult a CPA.
Schools (NCES district)
- District
- Dekalb County
- NCES district ID
- 1301740
- Math proficiency
- 19% ▼ -12.00%
- Reading proficiency
- 28% ▼ -7.00%
- Median HH income
- $51,448
- Composite
- 20.92/100
- National rank
- #8482
- State rank
- #125 of 174 in GA
Livability — Panthersville
- Score
- 66/100
- State rank
- #180
- US rank
- #11244
Category grades
Schools grade is shown separately in the Schools card above.
Census & demographics
- County
- Dekalb County · 782,738 people
- Metro
- Atlanta-Sandy Springs-Alpharetta, GA
- Population (ZIP)
- 41,847
- Household income
- $63,517
- Rent vs Own
- Severe rent burden
- 1659.0
Population outlook (DeKalb County) Hauer SSP2
- Today (2025)
- 839,977 people
- By 2030
- 891,768 · +6.2%
- By 2040
- 988,894 · +17.7%
- By 2050
- 1,074,583 · +27.9%
- By 2075
- 1,245,026 · +48.2%
- By 2100
- 1,303,135 · +55.1%
Race, ethnicity, and origin ACS 2023
- Neighborhood character
- Predominantly Black (90%)
- Race & ethnicity
- Black 90% White 4% Two or more races 3% Hispanic / Latino 2%
- Common ancestry
- Hispanic 1% Lithuanian 1%
- Foreign-born
- 8% · Canada
- Languages at home
- 93% English-only · Spanish 2% French/Haitian/Cajun 1%
Political lean MEDSL · DeKalb
- 2024 margin
- Solid D (+64.8) · D 81.9% · R 17.1% · Other 1.0%
- 2008→2024 swing
- +6.1pp toward D · 2008: 58.6pp · 2024: 64.8pp
- All cycles
- 2024: D+64.8 2020: D+67.4 2016: D+64.8 2012: D+56.8 2008: D+58.6
Not yet ingested
- Civics
- —
Market trends
- HPI YoY
- ▼ -78.92%
- Current HPI
- 209.5638
- Rent YoY
- ▲ 2.18%
- Metro
- Atlanta-Sandy Springs-Alpharetta, GA
- State GDP YoY
- ▲ 2.66%
- F500 in state
- 28
Industry mix (Fortune 500 HQ in GA)
| Industry | F500 HQs | Revenue |
|---|---|---|
| Paper / Packaging | 2 | $29B |
|
||
| Retail | 1 | $160B |
|
||
| Transportation / Logistics | 1 | $91B |
|
||
| Airlines | 1 | $62B |
|
||
| Consumer Goods | 1 | $47B |
|
||
| Utilities | 1 | $25B |
|
||
Price history
+242.7% since first listed6 events — show timeline
- 2026-06-08 Listed $179,900 FMLS
- 2026-06-08 Listed $179,900 GAMLS
- 2026-02-25 Listing Removed — GAMLS
- 2026-01-22 Listed $184,000 GAMLS
- 1990-08-08 Sold (Public Records) $87,400 Public Records
- 1988-11-01 Sold (Public Records) $52,500 Public Records
Property tax history
+2.9%/yrLatest (2024): $3,698 · +0.7% YoY. Source: county tax records.
Cash-flow waterfall
monthlySold comps — $/sqft
last 12 mo · ≤1 miLoading sold comps…