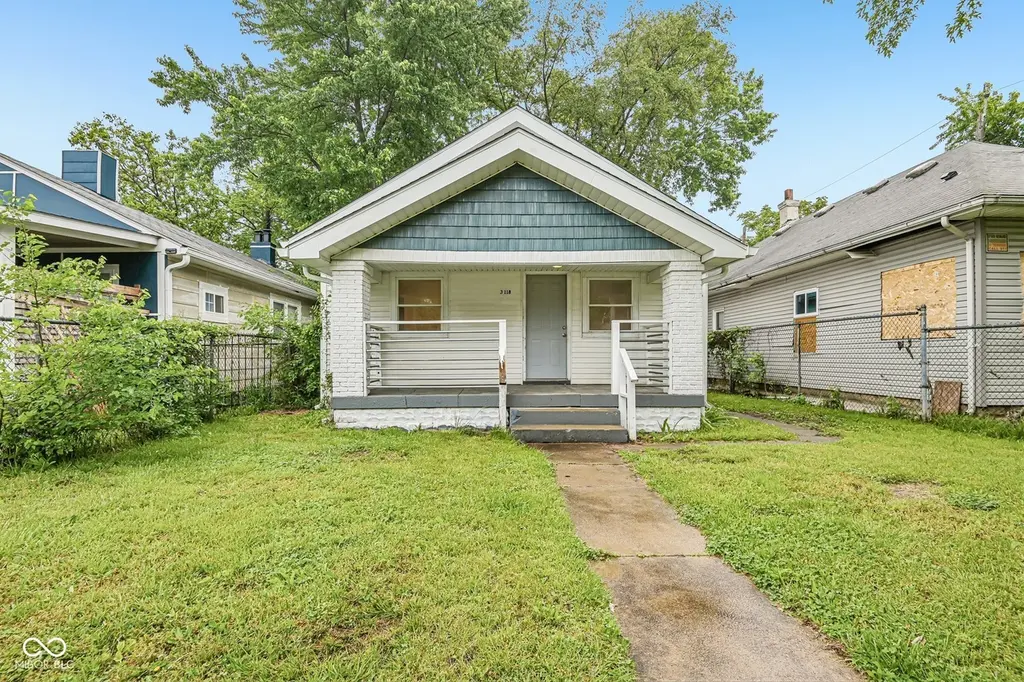
3118 W 9th St · Indianapolis city (balance), IN
Flood risk 1/10 · Minimal
- FEMA flood zone
- X (unshaded)
- Chance of flooding over 30 yrs
- 0.0%
- Est. flood insurance / yr
- $473 – $860
Fire risk 1/10 · Minimal
- Est. fire insurance / yr
- $717 – $1,331
Heat risk 4/10 · Minor
- Hot days now (above 102°F)
- 7 days/yr
- Hot days in 30 yrs
- 19 days/yr
Wind risk 2/10 · Minimal
- Chance of severe wind over 30 yrs
- 0.0%
Air-quality risk 4/10 · Minor
- Unhealthy air days now
- 5 days/yr
- Unhealthy air days in 30 yrs
- 7 days/yr
Risk factors via First Street. Map © Google.
Why this score? — see what drove the C- grade
The composite is a weighted blend of 9 inputs, each scored 0–100. Each bar is that input's sub-score; the figure is the points it added to the 100-point composite (weight × sub-score).
- Cash flow +23.1/30.0
- ARV discount +7.5/15.0
- DSCR +7.4/10.0
- 1% rule +6.8/10.0
- Rent growth +3.1/5.0
- Livability +2.5/5.0
- Condition / age +2.5/5.0
- Schools +1.4/10.0
- Appreciation +0.0/10.0
$115,000
🖨 Deal sheet 📄 Offer letter ✓ Due diligence
Listing remarks
Great starter home ready for new owners. Updated 3 BR/1 BA shotgun/bungalow w/ tasteful updates boasts new LVP flooring and fresh paint throughout. Kitchen has new fridge & stove. . The bathroom has new tile shower surround and wood grain vanity. Main level Laundry space and breakfast nook round out the main level. Small Basement adds some additional storage space. Newer pex plumbing and New flush mount LED light fixtures. Nice covered front porch and partially fenced front yard. Plenty of parking in the back of the home.
Key facts
- New stove
- Fresh paint
- New lvp flooring
Tags
Property features AI
Finance
- Other: Lot size approximately 0.12 acres (< 1/4 acre)
Exterior
- Parking: Alley access with concrete and gravel surfaces
- Security: Smoke alarm installed
- Utilities: Public water; Municipal sewer; 100 amp electric service; Cable, electricity, natural gas, sewer, and water connected; Solid waste service available
- Home design: Single-family residence; Updated/remodeled condition; One story
- Construction: Vinyl siding; Block foundation
- Exterior features: Covered patio/porch; Chain-link fence; Sidewalks; Mature trees
Interior
- Kitchen: Electric cooktop; Refrigerator
- Bedrooms: Three main-level bedrooms
- Bathrooms: One full bathroom with tub and shower on the main level
- Heating & cooling: Forced-air heating (natural gas); No central air
- Interior features: Attic access; Partial basement
- Laundry & utility: Laundry connections available (washer/dryer hookups)
Neighborhood map
What this means for you Summary
Snapshot
- This is a 3-bed/1.0-bath single-family listed at $115k.
Deal economics
- At list price, monthly cash flow is $206 ($2k/yr) — positive.
- The deal already cash-flows at list — no discount required.
- Meets the 1% rule at list price ($1k rent vs $115k).
- Recommended offer: $113k (1.5% below list) — sets the bar for market timing.
- Cap rate 8.4% vs local median 4.4% in Indianapolis city (balance) — top-decile yield for the area; either an underpriced asset or a hidden risk that comps aren't pricing in. Stress-test before assuming the spread holds.
Location & tenants
- Location reads: area grade C — affects rentability + tenant quality, not the cash-flow math above.
- Indianapolis Public Schools (urban): math 14% / reading 20% proficiency, ranked #286 of 301 in IN (top 95%) — low school quality limits family demand, transient renter base, plan for 1-2y turnover; 77% free/reduced lunch — lower-income household profile, screen leases tightly.
- Market conditions: Rents rising (+2.5%/yr); 170 active listings in the ZIP; 8 comparable units currently listed for rent nearby; rentals leasing fast (median 7d on market — plan ~1-2 weeks tenant-placement turnaround); 1,906 units permitted in Marion County in 2024 (621 in 5+ unit buildings).
- This rent runs 32% of the median local income ($51k/yr) — at the standard rent-burdened threshold; future hikes will face affordability resistance.
Forward outlook
- Local home prices are declining (-3.0%/yr); year-one equity from $795 of loan paydown is wiped out by about $3k of value loss. Plan a longer hold.
- Marion County population projected at +18% by 2050 — long-run rental-demand tailwind backs the buy-and-hold thesis.
Negotiation context
- It's been on market 30 days — a 2% lower offer ($113k) is reasonable based on typical stale-listing flexibility.
- 7 sale attempts since 22y ago; this cycle's ask has dropped $10k (8%) from the opening price — seller is motivated, your offer sets the floor, not the list.
Risks & watch-outs
- Watch-outs: built in 1926 — expect roof / HVAC / electrical / plumbing capex.
Questions for the listing agent
- Built in 1926 — when were the roof, HVAC, electrical panel, plumbing, and water heater last replaced?
- Is there a deadline driving the sale (1031 exchange, divorce, estate, relocation)? That informs how much negotiation room exists.
- What's the average days-on-market for RENTAL listings here right now (not sales)? A rising rental-DOM trend means longer vacancies and softer asking-rent achievability than the comps imply.
- What's the recent tenant-quality profile in this submarket — average credit score on applications, eviction rate, late-payment / NSF rate, and stable-employment percentage? A property-management company in the area should have these aggregated.
- How much new for-sale + rental construction is in the pipeline within 1–3 miles? Heavy new supply typically softens prices + rents 12–24 months out; constrained supply supports both.
Investment metrics
- 1% rule
- 1.18% ✓
- Cap rate
- 8.44%
- Cash-on-cash
- 7.66%
- DSCR
- 1.34
- GRM
- 7.1
CMA / ARV
- ARV (on-the-fly)
- $65,400
- Comps found
- 3
Show comp detail 3 sales within ~0.75 mi
| Address | Dist | Beds/Ba | Sqft | Sold | Price | $/sf | Match |
|---|---|---|---|---|---|---|---|
| 3453 W 12th St | 0.45mi | 2/1.0 (-1) | 640 (+7%) | 12mo | $115,000 | $180 | 53 |
| 935 N Belleview Pl | 0.48mi | 2/2.0 (-1) | 690 (+15%) | 21mo | $75,000 | $109 | 26 |
| 1414 N Rochester Ave | 0.70mi | 2/1.0 (-1) | 672 (+12%) | 20mo | $73,400 | $109 | 26 |
Match score weights: distance 35% · size 25% · config 20% · recency 20%. Top-matched comps best support the ARV.
Projected returns pro-forma
-3.0% appreciation · 2.46% rent growth · sell at horizon
- IRR
- -5.2%
- Equity multiple
- 0.81×
- Total profit
- $-6,211
- Equity at exit
- $17,147
- IRR
- 3.8%
- Equity multiple
- 1.27×
- Total profit
- $8,736
- Equity at exit
- $9,943
Cash invested: $32,200 (down + closing). Projections, not guarantees.
Landlord ↔ Tenant lean methodology
- Overall (STATE)
- 90 Strongly Landlord-Friendly
- State Indiana
- 90 Strongly Landlord-Friendly · R+11
- County
- — inherits STATE
- City
- — inherits STATE
ZIP-level market 46222
- Home prices YoY
- -16.7%
- Rents YoY
- 2.5%
- Active inventory
- 170
- Price-to-rent
- 7.1×
Monthly cashflow live
- Estimated rent
- $1,353 high interval (Pro) →
- Mortgage (P&I)
- −$603
- Tax from tax record
- −$212 /mo · $2,549/yr
- Insurance
- −$48
- HOA
- −$0
- Vacancy / Maint / Mgmt
- −$284
- Net cashflow
- $206
Break-even live
UW: 25.0% down · 7.5% · 30yr · 1.5% tax · 5.0% vac · 8.0% maint · 8.0% mgmt
Financing live
Cash to close
- Down payment
- $28,750
- Closing costs
- $3,450
- Reserves months
- —
- Total cash needed
- —
Loan-product check · same deal, 3 products live
Conventional
25% down · 7.5% · 30yr
- Down + closing
- —
- Monthly P&I
- —
- Monthly cashflow
- —
- DSCR
- —
- Eligible?
- —
Personal DTI + credit; lowest rate.
DSCR
20% down · 8.5% · 30yr
- Down + closing
- —
- Monthly P&I
- —
- Monthly cashflow
- —
- DSCR
- —
- Eligible?
- —
No personal income docs; deal must DSCR.
Hard money
10% down · 12.0% · 12mo
- Down + closing
- —
- Monthly P&I
- —
- Monthly cashflow
- —
- DSCR
- —
- Eligible?
- —
Short-term bridge; refi at stabilization.
Rent comps 8 comps
| Address | Beds | Baths | Sqft | Rent | $/sqft | DOM | Units | Dist |
|---|---|---|---|---|---|---|---|---|
| 771 Haugh St Indianapolis, IN | 2.0 | 1.0 | 714 | $1,250 | $1.75 | 19d | 1 | 0.23mi |
| 411 N Centennial St Indianapolis, IN | 2.0 | 1.0 | 750 | $995 | $1.33 | 7d | 1 | 0.52mi |
| 1150 N White River Pkwy West Dr Indianapolis, IN | 1.0–2.0 | 1.0 | 722 | $1,224 | $1.69 | 1d | 9 | 1.08mi |
| 2014 N Exeter Ave Indianapolis, IN | 2.0 | 1.0 | 660 | $1,295 | $1.96 | 7d | 1 | 1.09mi |
| 460 N White River Parkway Dr W Indianapolis, IN | 2.0 | 1.0 | 681 | $1,725 | $2.53 | 2d | 14 | 1.18mi |
| 3621 Lawnview Ln Indianapolis, IN | 1.0–4.0 | 1.0–1.5 | 1012 | $1,162 | $1.15 | 1d | 13 | 1.36mi |
| 2418 N Centennial St Indianapolis, IN | 2.0 | 1.0 | 725 | $1,099 | $1.52 | 43d | 1 | 1.42mi |
| 1410 Breedlove Ln Indianapolis, IN | 2.0 | 1.0–2.0 | 886 | $2,557 | $2.88 | 1d | 63 | 1.43mi |
Listing history 29 events
-
2026-06-18days on market $115,000 Active 30 DOM
-
2026-06-17days on market $115,000 Active 29 DOM
-
2026-06-16days on market $115,000 Active 28 DOM
-
2026-06-15days on market $115,000 Active 27 DOM
-
2026-06-13days on market $115,000 Active 25 DOM
-
2026-06-13days on market $115,000 Active 24 DOM
-
2026-06-10price $115,000 Active 21 DOM
-
2026-06-09days on market $125,000 Active 21 DOM
-
2026-06-08days on market $125,000 Active 20 DOM
-
2026-06-07days on market $125,000 Active 19 DOM
-
2026-06-03days on market $125,000 Active 15 DOM
-
2026-06-02days on market $125,000 Active 14 DOM
-
2026-06-01days on market $125,000 Active 13 DOM
-
2026-05-31days on market $125,000 Active 12 DOM
-
2026-05-18$125,000 Active
-
2024-06-05historical $1,100
-
2024-05-15$1,100
-
2021-06-03soldstatus $915,000
-
2019-03-13soldstatus $100,000 Sold
-
2019-03-05$10,000
-
2019-03-05historical
-
2008-05-13historical
-
2007-08-17$38,900
-
2006-12-31historical
-
2006-05-15$49,900
-
2006-04-30historical
-
2005-10-18$54,900
-
2005-03-01soldstatus $6,000
-
2004-12-03$8,500
ⓘ Source: listings_history table (triggers on properties + properties_extension) + one-shot
backfill from property_details.listing_events for pre-trigger history.
Tax reassessment forecast IN · Partial reset (capped growth)
- Current annual tax
- $2,549 · $212/mo
- Projected year-2 tax
- $2,549 · $212/mo
- Expected delta
- $0/yr ($0/mo · 0.0%)
ⓘ Screening estimate from a state-policy table — verify with the county assessor before closing.
Climate risk First Street
- Flood 1/10 Low FEMA zone X (unshaded) · 0% chance over 30 yrs
- Wildfire 1/10 Low
- Heat 4/10 Moderate 7 d/yr ≥102°F today · 19 d/yr by 30 yrs out
- Wind 2/10 Low 0% chance of damaging wind over 30 yrs
- Air quality 4/10 Moderate 5 unhealthy d/yr today · 7 by 30 yrs out
Nearby sold comps map
Loading sold comps map…
Walkable amenities ~0.75 mi
Loading nearby amenities…
Taxation est. · year 1
- Rental income
- $16,238
- − Mortgage interest
- −$6,442
- − Property taxes
- −$2,549
- − Insurance
- −$575
- − Repairs & maintenance
- −$1,299
- − Management
- −$1,299
- − Depreciation
- −$3,345
- Taxable income
- $728
- Est. tax owed @ 24.0%
- −$175
- After-tax cash flow
- $2,292/yr
For passive investors: Depreciation is non-cash, so a rental often shows a tax loss while cash-flowing — sheltering income. Rental losses are passive: they offset passive income freely, and up to $25,000/yr can offset ordinary (W-2) income if you actively participate and your MAGI is under $100k (phasing out to $0 by $150k); unused losses carry forward. On sale, claimed depreciation is recaptured at up to 25%, and gains may owe capital-gains tax (a 1031 exchange can defer both). Figures are a year-1 estimate at your 24.0% rate — not tax advice; consult a CPA.
Schools (NCES district)
- District
- Indianapolis Public Schools
- NCES district ID
- 1804770
- Math proficiency
- 14% ▼ -7.00%
- Reading proficiency
- 20% ▼ -3.00%
- Median HH income
- $32,034
- Composite
- 13.69/100
- National rank
- #9499
- State rank
- #286 of 301 in IN
Livability — Indianapolis city (balance)
No livability data for this city. (Only ~50 U.S. cities are tracked.)
Census & demographics
- Census place
- Indianapolis city (balance), IN
- County
- Marion County · 998,460 people
- City population
- 881,119
- Metro
- Indianapolis-Carmel-Anderson, IN
- Population (ZIP)
- 38,887
- Household income
- $50,783
- Rent vs Own
- Severe rent burden
- 1750.0
Population outlook (Marion County) Hauer SSP2
- Today (2025)
- 1,025,572 people
- By 2030
- 1,065,727 · +3.9%
- By 2040
- 1,141,577 · +11.3%
- By 2050
- 1,208,920 · +17.9%
- By 2075
- 1,367,288 · +33.3%
- By 2100
- 1,438,201 · +40.2%
Race, ethnicity, and origin ACS 2023
- Neighborhood character
- Highly diverse neighborhood (Simpson 0.72)
- Race & ethnicity
- White 32% Black 30% Hispanic / Latino 30% Two or more races 12% Asian 2%
- Hispanic origin (detail)
- Mexican 24% Puerto Rican 1%
- Common ancestry
- Lithuanian 1% Iranian 1% Slovak 1%
- Foreign-born
- 21% · Canada, Jamaica
- Languages at home
- 67% English-only · Spanish 25% Other Indo-European 3% Arabic 2%
Political lean MEDSL · Marion
- 2024 margin
- Strong D (+27.7) · D 63.0% · R 35.3% · Other 1.7%
- 2008→2024 swing
- -0.7pp no change · 2008: 28.4pp · 2024: 27.7pp
- All cycles
- 2024: D+27.7 2020: D+29.1 2016: D+22.8 2012: D+22.2 2008: D+28.4
Not yet ingested
- Civics
- —
Market trends
- HPI YoY
- ▼ -75.47%
- Current HPI
- 375.8479
- Rent YoY
- ▲ 2.46%
- Metro
- Indianapolis-Carmel-Anderson, IN
- State GDP YoY
- ▲ 2.90%
- F500 in state
- 18
Industry mix (Fortune 500 HQ in IN)
| Industry | F500 HQs | Revenue |
|---|---|---|
| Industrial Machinery | 2 | $37B |
|
||
| Healthcare | 1 | $177B |
|
||
| Pharmaceuticals | 1 | $45B |
|
||
| Metals / Steel | 1 | $18B |
|
||
| Agriculture | 1 | $17B |
|
||
| Packaging | 1 | $12B |
|
||
Price history
+1370.6% since first listed15 events — show timeline
- 2026-05-18 Listed $125,000 MIBOR as Distributed by MLS Grid
- 2024-06-05 Rental Removed $1,100 MIBOR
- 2024-05-15 Listed for Rent $1,100 MIBOR
- 2021-06-03 Sold (Public Records) $915,000 Public Records
- 2019-03-13 Sold (MLS) $100,000 MIBOR as Distributed by MLS Grid
- 2019-03-05 Listed $10,000 MIBOR as Distributed by MLS Grid
- 2019-03-05 Listing Removed — MIBOR as Distributed by MLS Grid
- 2008-05-13 Listing Removed — MIBOR as Distributed by MLS Grid
- 2007-08-17 Listed $38,900 MIBOR as Distributed by MLS Grid
- 2006-12-31 Listing Removed — MIBOR as Distributed by MLS Grid
- 2006-05-15 Listed $49,900 MIBOR as Distributed by MLS Grid
- 2006-04-30 Listing Removed — MIBOR as Distributed by MLS Grid
- 2005-10-18 Listed $54,900 MIBOR as Distributed by MLS Grid
- 2005-03-01 Sold (MLS) $6,000 MIBOR as Distributed by MLS Grid
- 2004-12-03 Listed $8,500 MIBOR as Distributed by MLS Grid
Property tax history
+16.6%/yrLatest (2025): $2,549 · +20.9% YoY. Source: county tax records.
Cash-flow waterfall
monthlySold comps — $/sqft
last 12 mo · ≤1 miLoading sold comps…