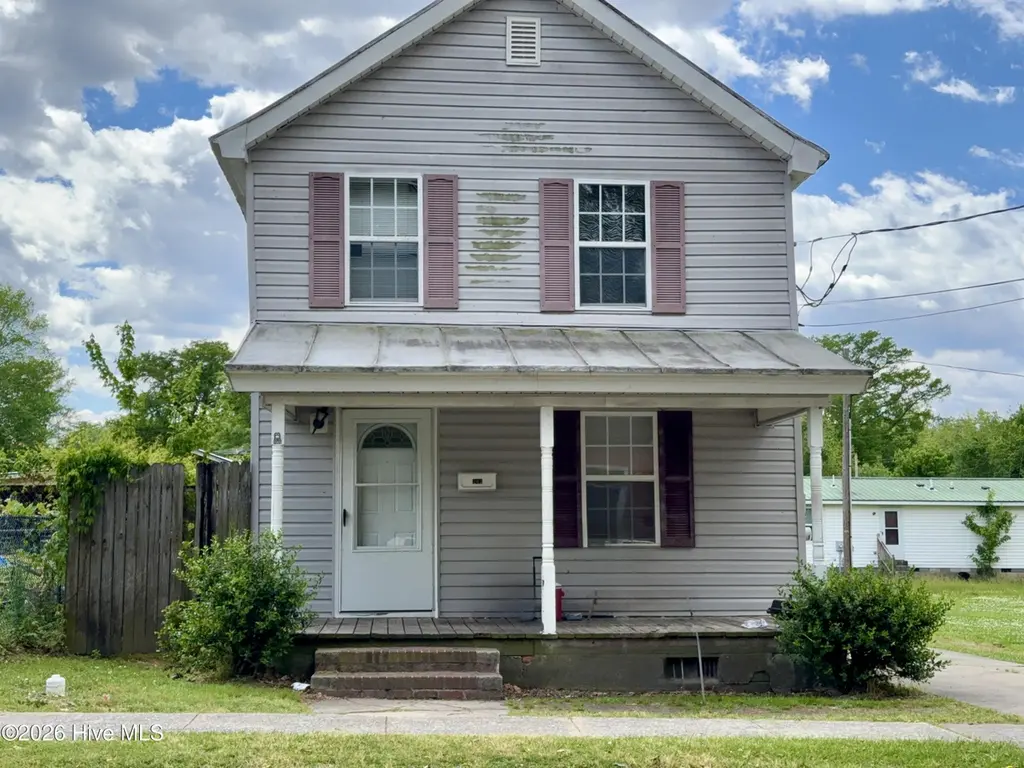
203 King St · Hertford, NC
Flood risk 9/10 · Severe
- FEMA flood zone
- X (unshaded)
- Chance of flooding over 30 yrs
- 0.99%
- Est. flood insurance / yr
- $507 – $1,088
Fire risk 2/10 · Minimal
- Est. fire insurance / yr
- $906 – $1,684
Heat risk 9/10 · Severe
- Hot days now (above 108°F)
- 7 days/yr
- Hot days in 30 yrs
- 17 days/yr
Wind risk 8/10 · Major
- Chance of severe wind over 30 yrs
- 80.0%
Air-quality risk 1/10 · Minimal
- Unhealthy air days now
- 0 days/yr
- Unhealthy air days in 30 yrs
- 0 days/yr
Risk factors via First Street. Map © Google.
Why this score? — see what drove the B+ grade
The composite is a weighted blend of 9 inputs, each scored 0–100. Each bar is that input's sub-score; the figure is the points it added to the 100-point composite (weight × sub-score).
- Cash flow +30.0/30.0
- DSCR +10.0/10.0
- Appreciation +10.0/10.0
- 1% rule +9.6/10.0
- ARV discount +7.5/15.0
- Schools +3.9/10.0
- Livability +2.9/5.0
- Rent growth +2.5/5.0
- Condition / age +2.5/5.0
$119,000
🖨 Deal sheet 📄 Offer letter ✓ Due diligence
Listing remarks MLS
Priced SO nice and there is a GREAT Tenant in place! Tenant currently pays $750 a month and wishes to stay for a very long time. Tenant wants to renew lease in April 2020. Well maintained property managed by The Bradford Corp. Wood plank floors throughout, master with bathroom on first floor. Turn key investment property.
Key facts
- 3,920 sq ft lot
- Built 1985
- Listed 58 days
Neighborhood map
What this means for you Summary
Snapshot
- This is a 3-bed/2.0-bath other listed at $119k.
Deal economics
- At list price, monthly cash flow is $526 ($6k/yr) — positive.
- The deal already cash-flows at list — no discount required.
- Meets the 1% rule at list price ($2k rent vs $119k).
- Recommended offer: $115k (3.0% below list) — sets the bar for market timing.
- Cap rate 12.3% vs local median 2.2% in Hertford — top-decile yield for the area; either an underpriced asset or a hidden risk that comps aren't pricing in. Stress-test before assuming the spread holds.
Location & tenants
- Location reads 58/100 on livability (#570 in NC) — a working-class tenant base; expect higher turnover. Strengths: cost of living A+, housing A+, crime A; Watch: schools F, amenities F, commute F.
- Perquimans County Schools (rural): math 44% / reading 48% proficiency, ranked #83 of 178 in NC (top 47%) — families likely to look elsewhere, expect single-tenant / working-renter base with shorter leases.
- Market conditions: 339 active listings in the ZIP; 46 units permitted in Perquimans County in 2024 (0 in 5+ unit buildings).
Forward outlook
- In year one you build about $13k of equity ($823 loan paydown + $12k appreciation (10.0% local appreciation)).
- Perquimans County population projected at -16% by 2050 — secular population decline; favor cash flow + early exit over multi-decade hold.
- At projected returns (10.0% appreciation + 3.0% rent growth), your $33k cash investment doubles in ~2 years — after that, you're playing with house money.
- By year 3, paydown + projected appreciation supports a ~$32k cash-out refi (75% LTV) — recoverable capital for the next deal without selling this one.
Negotiation context
- It's been on market 59 days — a 3% lower offer ($115k) is reasonable based on typical stale-listing flexibility.
- 2 sale attempts since 6y ago; this cycle's ask has dropped $11k (8%) from the opening price — seller is motivated, your offer sets the floor, not the list.
- Current owner paid $40k; list at $119k implies a 194% gain — meaningful room to come down on a strong offer.
Risks & watch-outs
- Watch-outs: flood insurance adds $66/mo.
- Climate carrying-cost: severe flood risk; severe wind risk, 80% chance of damaging wind over 30y; extreme-heat days projected 7→17/yr by 2055 (HVAC capex compounding) — expect insurance premiums to compound above CPI over the hold.
Questions for the listing agent
- It's been on market 59 days. Have you received any prior offers? Is the seller open to a 3% concession, seller financing, or rate buy-down credit?
- What's the actual annual flood-insurance premium (NFIP or private), and is the property in a SFHA with mandatory coverage?
- Is there a deadline driving the sale (1031 exchange, divorce, estate, relocation)? That informs how much negotiation room exists.
- Schools are F-rated, which usually means shorter tenancies and higher turnover. Who's the typical renter profile here, and what's been the actual vacancy rate?
- What's the average days-on-market for RENTAL listings here right now (not sales)? A rising rental-DOM trend means longer vacancies and softer asking-rent achievability than the comps imply.
- What's the recent tenant-quality profile in this submarket — average credit score on applications, eviction rate, late-payment / NSF rate, and stable-employment percentage? A property-management company in the area should have these aggregated.
- How much new for-sale + rental construction is in the pipeline within 1–3 miles? Heavy new supply typically softens prices + rents 12–24 months out; constrained supply supports both.
Investment metrics
- 1% rule
- 1.46% ✓
- Cap rate
- 12.26%
- Cash-on-cash
- 21.32%
- DSCR
- 1.95
- GRM
- 5.7
CMA / ARV
No comps found within radius.
Projected returns pro-forma
10.0% appreciation · 3.0% rent growth · sell at horizon
- IRR
- 38.4%
- Equity multiple
- 3.95×
- Total profit
- $98,324
- Equity at exit
- $107,205
- IRR
- 33.1%
- Equity multiple
- 8.90×
- Total profit
- $263,313
- Equity at exit
- $231,191
Cash invested: $33,320 (down + closing). Projections, not guarantees.
Landlord ↔ Tenant lean methodology
- Overall (STATE)
- 85 Strongly Landlord-Friendly
- State North Carolina
- 85 Strongly Landlord-Friendly · R+3
- County
- — inherits STATE
- City
- — inherits STATE
ZIP-level market 27944
- Home prices YoY
- 9.5%
- Active inventory
- 339
- Price-to-rent
- 5.7×
Monthly cashflow live
- Estimated rent
- $1,741 medium interval (Pro) →
- Mortgage (P&I)
- −$624
- Tax from tax record
- −$110 /mo · $1,314/yr
- Insurance
- −$50
- Flood insurance flood zone
- −$66 /mo · $798/yr
- HOA
- −$0
- Vacancy / Maint / Mgmt
- −$366
- Net cashflow
- $526
Break-even live
UW: 25.0% down · 7.5% · 30yr · 1.5% tax · 5.0% vac · 8.0% maint · 8.0% mgmt
Financing live
Cash to close
- Down payment
- $29,750
- Closing costs
- $3,570
- Reserves months
- —
- Total cash needed
- —
Loan-product check · same deal, 3 products live
Conventional
25% down · 7.5% · 30yr
- Down + closing
- —
- Monthly P&I
- —
- Monthly cashflow
- —
- DSCR
- —
- Eligible?
- —
Personal DTI + credit; lowest rate.
DSCR
20% down · 8.5% · 30yr
- Down + closing
- —
- Monthly P&I
- —
- Monthly cashflow
- —
- DSCR
- —
- Eligible?
- —
No personal income docs; deal must DSCR.
Hard money
10% down · 12.0% · 12mo
- Down + closing
- —
- Monthly P&I
- —
- Monthly cashflow
- —
- DSCR
- —
- Eligible?
- —
Short-term bridge; refi at stabilization.
Listing history 18 events
-
2026-06-19days on market $119,000 Active 59 DOM
-
2026-06-18days on market $119,000 Active 58 DOM
-
2026-06-17days on market $119,000 Active 57 DOM
-
2026-06-16days on market $119,000 Active 56 DOM
-
2026-06-15days on market $119,000 Active 55 DOM
-
2026-06-14days on market $119,000 Active 53 DOM
-
2026-06-12days on market $119,000 Active 52 DOM
-
2026-06-09days on market $119,000 Active 49 DOM
-
2026-06-08days on market $119,000 Active 48 DOM
-
2026-06-07days on market $119,000 Active 47 DOM
-
2026-06-03pricedays on market $119,000 Active 43 DOM
-
2026-06-02days on market $129,900 Active 42 DOM
-
2026-06-01days on market $129,900 Active 41 DOM
-
2026-05-31days on market $129,900 Active 40 DOM
-
2026-05-30days on market $129,900 Active 39 DOM
-
2025-04-21$129,900 Active
-
2020-05-08soldstatus $40,500 324-char remark
Show marketing remark (324 chars)
Priced SO nice and there is a GREAT Tenant in place! Tenant currently pays $750 a month and wishes to stay for a very long time. Tenant wants to renew lease in April 2020. Well maintained property managed by The Bradford Corp. Wood plank floors throughout, master with bathroom on first floor. Turn key investment property.
-
2020-01-13$49,900 324-char remark
Show marketing remark (324 chars)
Priced SO nice and there is a GREAT Tenant in place! Tenant currently pays $750 a month and wishes to stay for a very long time. Tenant wants to renew lease in April 2020. Well maintained property managed by The Bradford Corp. Wood plank floors throughout, master with bathroom on first floor. Turn key investment property.
ⓘ Source: listings_history table (triggers on properties + properties_extension) + one-shot
backfill from property_details.listing_events for pre-trigger history.
Tax reassessment forecast NC · Resets to sale price
- Current annual tax
- $1,314 · $110/mo
- Projected year-2 tax
- $1,314 · $110/mo
- Expected delta
- $0/yr ($0/mo · 0.0%)
ⓘ Screening estimate from a state-policy table — verify with the county assessor before closing.
Climate risk First Street
- Flood 9/10 Extreme FEMA zone X (unshaded) · 99% chance over 30 yrs
- Wildfire 2/10 Low
- Heat 9/10 Extreme 7 d/yr ≥108°F today · 17 d/yr by 30 yrs out
- Wind 8/10 Severe 80% chance of damaging wind over 30 yrs
- Air quality 1/10 Low 0 unhealthy d/yr today · 0 by 30 yrs out
Nearby sold comps map
Loading sold comps map…
Walkable amenities ~0.75 mi
Loading nearby amenities…
Taxation est. · year 1
- Rental income
- $20,888
- − Mortgage interest
- −$6,666
- − Property taxes
- −$1,314
- − Insurance
- −$1,392
- − Repairs & maintenance
- −$1,671
- − Management
- −$1,671
- − Depreciation
- −$3,462
- Taxable income
- $4,712
- Est. tax owed @ 24.0%
- −$1,131
- After-tax cash flow
- $5,175/yr
For passive investors: Depreciation is non-cash, so a rental often shows a tax loss while cash-flowing — sheltering income. Rental losses are passive: they offset passive income freely, and up to $25,000/yr can offset ordinary (W-2) income if you actively participate and your MAGI is under $100k (phasing out to $0 by $150k); unused losses carry forward. On sale, claimed depreciation is recaptured at up to 25%, and gains may owe capital-gains tax (a 1031 exchange can defer both). Figures are a year-1 estimate at your 24.0% rate — not tax advice; consult a CPA.
Schools (NCES district)
- District
- Perquimans County Schools
- NCES district ID
- 3703600
- Math proficiency
- 44% ▲ 6.00%
- Reading proficiency
- 48% ▲ 7.00%
- Median HH income
- $42,593
- Composite
- 38.75/100
- National rank
- #4124
- State rank
- #83 of 178 in NC
Livability — Hertford
- Score
- 58/100
- State rank
- #570
- US rank
- #21148
Category grades
Schools grade is shown separately in the Schools card above.
Census & demographics
- Census place
- Hertford, NC
- Population (ZIP)
- 11,255
Population outlook (Perquimans County) Hauer SSP2
- Today (2025)
- 13,018 people
- By 2030
- 12,716 · -2.3%
- By 2040
- 11,895 · -8.6%
- By 2050
- 10,981 · -15.6%
- By 2075
- 8,931 · -31.4%
- By 2100
- 7,101 · -45.5%
Race, ethnicity, and origin ACS 2023
- Neighborhood character
- Predominantly White (71%)
- Race & ethnicity
- White 71% Black 20% Two or more races 5% Hispanic / Latino 3%
- Common ancestry
- Lithuanian 3% Serbian 2% Slovak 2%
- Foreign-born
- 3% · Canada, China, Dominican Republic
- Languages at home
- 96% English-only · Spanish 3%
Political lean MEDSL · Perquimans
- 2024 margin
- Solid R (+39.4) · D 29.7% · R 69.1% · Other 1.2%
- 2008→2024 swing
- -25.4pp toward R · 2008: -13.9pp · 2024: -39.4pp
- All cycles
- 2024: R+39.4 2020: R+32.2 2016: R+28.1 2012: R+16.1 2008: R+13.9
Not yet ingested
- Civics
- —
Market trends
- HPI YoY
- ▲ 22.77%
- Current HPI
- 261.91
- Rent YoY
- —
- Metro
- —
- State GDP YoY
- ▲ 3.28%
- F500 in state
- 26
Industry mix (Fortune 500 HQ in NC)
| Industry | F500 HQs | Revenue |
|---|---|---|
| Financial Services | 2 | $213B |
|
||
| Retail | 2 | $95B |
|
||
| Industrial Conglomerate | 1 | $38B |
|
||
| Metals / Steel | 1 | $35B |
|
||
| Utilities | 1 | $30B |
|
||
| Industrial Machinery | 1 | $19B |
|
||
Price history
+160.3% since first listed3 events — show timeline
- 2025-04-21 Listed $129,900 Hive MLS
- 2020-05-08 Sold (MLS) $40,500 Hive MLS
- 2020-01-13 Listed $49,900 Hive MLS
Property tax history
+6.9%/yrLatest (2025): $1,314 · +0.0% YoY. Source: county tax records.
Cash-flow waterfall
monthlySold comps — $/sqft
last 12 mo · ≤1 miLoading sold comps…