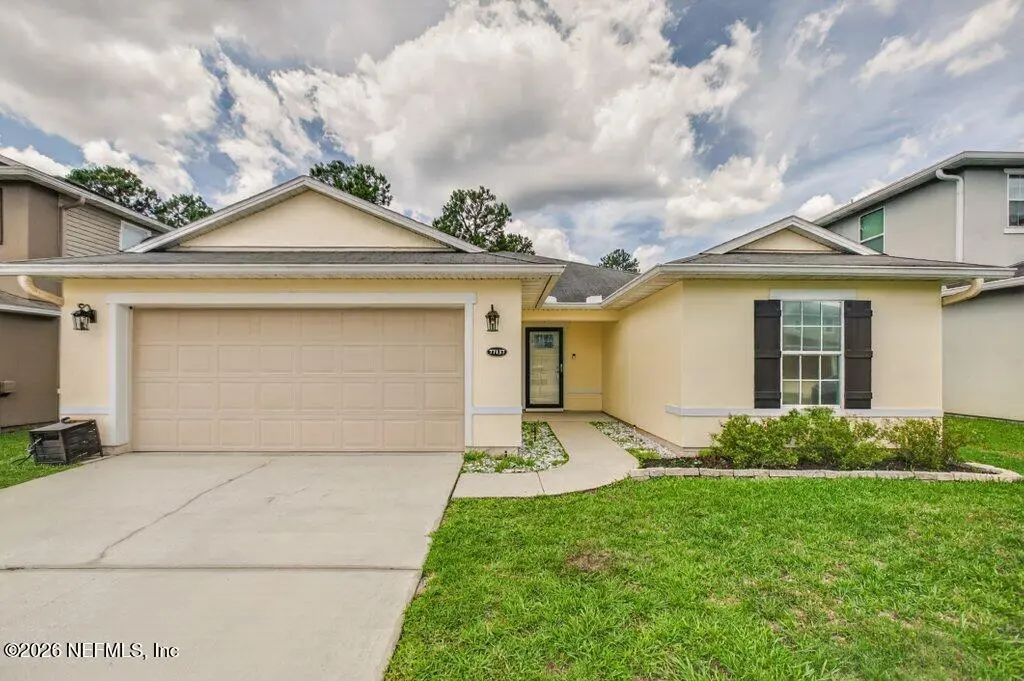
77137 Cobblestone Dr · Jacksonville, FL
Flood risk 1/10 · Minimal
- FEMA flood zone
- X (unshaded)
- Chance of flooding over 30 yrs
- 0.0%
- Est. flood insurance / yr
- $507 – $1,088
Fire risk 7/10 · Major
- Est. fire insurance / yr
- $947 – $1,759
Heat risk 9/10 · Severe
- Hot days now (above 107°F)
- 7 days/yr
- Hot days in 30 yrs
- 21 days/yr
Wind risk 9/10 · Severe
- Chance of severe wind over 30 yrs
- 99.0%
Air-quality risk 5/10 · Moderate
- Unhealthy air days now
- 8 days/yr
- Unhealthy air days in 30 yrs
- 10 days/yr
Risk factors via First Street. Map © Google.
Why this score? — see what drove the D- grade
The composite is a weighted blend of 9 inputs, each scored 0–100. Each bar is that input's sub-score; the figure is the points it added to the 100-point composite (weight × sub-score).
- Appreciation +10.0/10.0
- Cash flow +6.1/30.0
- Schools +6.0/10.0
- Livability +4.2/5.0
- Rent growth +3.2/5.0
- Condition / age +2.5/5.0
- ARV discount +2.1/15.0
- 1% rule +0.9/10.0
- DSCR +0.4/10.0
$415,000
🖨 Deal sheet (PDF) 📄 Offer letter ✓ Due diligence
Listing remarks MLS
Stunning pool home alert! Feast your eyes on this adorable Timbercreek beauty with a newer SALTWATER POOL complete with a large pavered patio, fully fenced backyard, and all the oasis vibes you can handle. This open concept floor plan boasts wood look flooring throughout, tons of windows and natural light, a massive family room and the perfect office/library space with custom entry design that will have you head over heels in love. Spacious kitchen offers plenty of cabinet storage, brushed nickel hardware, walk-in pantry, and everyone's favorite window over the kitchen sink. Large dining room space is perfect for your farmhouse table and all your HGTV goals to come to life! Split bedrooms offer your master tucked away for privacy, complete with oversized walk in closet and custom built-ins built-ins
Key facts
- Massive family room
- Large paver patio
- 8,276 sq ft lot
Tags
Property features AI
Finance
- HOA & community: Homeowners association with semi-annual fee of $270.50; Not a senior community
Exterior
- Parking: 2-car garage
- Utilities: Public sewer; Electricity available; Water connected; Sewer connected
- Home design: Single family residence; One story
- Construction: Shingle roof
- Exterior features: Private in-ground saltwater pool (fenced); Wood backyard fencing
Interior
- Kitchen: Dishwasher; Disposal; Electric oven; Electric range; Microwave; Refrigerator; Plumbed for ice maker
- Bedrooms: 3 bedrooms
- Bathrooms: 2 full bathrooms
- Heating & cooling: Central heating (heat pump); Central air conditioning
- Interior features: Built-in features; Ceiling fans; Eat-in kitchen; Open floorplan; Split bedrooms; Walk-in closets
- Laundry & utility: Washer; Dryer; Electric water heater
Neighborhood map
What this means for you Summary
Snapshot
- This is a 3-bed/2.0-bath single-family listed at $415k.
Deal economics
- At list price, monthly cash flow is $-782 ($-9k/yr) — negative.
- To cash-flow at today's rent, offer at most $277k (33.3% below list).
- To meet the 1% rule (rent ≥ 1% of price), the offer needs to be $246k (40.7% below list).
- Recommended offer: $246k (40.7% below list) — sets the bar for 1% rule.
Location & tenants
- Location reads 83/100 on livability (#50 in FL, #911 nationally) — a professional / high-income tenant draw. Strengths: amenities A+, commute A+, housing A+.
- Nassau (town): math 74% / reading 65% proficiency, ranked #4 of 73 in FL (top 6%) — acceptable for families but not a draw, mixed tenant base, ~2y average lease.
- Market conditions: Rents rising (+2.9%/yr); 601 active listings in the ZIP; 11 comparable units currently listed for rent nearby; rentals at typical pace (median 26d on market — plan ~3-4 weeks tenant-placement turnaround); solid renter incomes; 953 units permitted in Nassau County in 2024 (24 in 5+ unit buildings).
- This rent runs 32% of the median local income ($93k/yr) — at the standard rent-burdened threshold; future hikes will face affordability resistance.
Forward outlook
- In year one you build about $44k of equity ($3k loan paydown + $42k appreciation (10.0% local appreciation)).
- Nassau County population projected at +17% by 2050 — long-run rental-demand tailwind backs the buy-and-hold thesis.
- By year 2, paydown + projected appreciation supports a ~$71k cash-out refi (75% LTV) — recoverable capital for the next deal without selling this one.
Negotiation context
- It's been on market 15 days — a 2% lower offer ($409k) is reasonable based on typical stale-listing flexibility.
- 4 sale attempts since 15y ago with the ask held roughly flat each time — persistent listings suggest the price (not the market) is what's stuck; bring a comps-based counter.
Risks & watch-outs
- Climate carrying-cost: severe wind risk, 99% chance of damaging wind over 30y; major wildfire risk; extreme-heat days projected 7→21/yr by 2055 (HVAC capex compounding) — expect insurance premiums to compound above CPI over the hold.
Questions for the listing agent
- What do current leases actually rent for vs. the listed asking? Can we see a recent rent roll and the last 12 months of T-12 income?
- What does the HOA fee cover, when was the last increase, and are there any pending special assessments or reserve-fund shortfalls?
- Is there a deadline driving the sale (1031 exchange, divorce, estate, relocation)? That informs how much negotiation room exists.
- Schools are B-rated — typically a magnet for longer-tenancy family renters. What's the average tenant stay here, and is there a school-zone premium baked into asking?
- The area grade is low — what's the realistic commute time and amenity access for the typical tenant pool here? Any planned neighborhood developments (good or bad) we should know about?
- What's the average days-on-market for RENTAL listings here right now (not sales)? A rising rental-DOM trend means longer vacancies and softer asking-rent achievability than the comps imply.
- What's the recent tenant-quality profile in this submarket — average credit score on applications, eviction rate, late-payment / NSF rate, and stable-employment percentage? A property-management company in the area should have these aggregated.
- How much new for-sale + rental construction is in the pipeline within 1–3 miles? Heavy new supply typically softens prices + rents 12–24 months out; constrained supply supports both.
Investment metrics
- 1% rule
- 0.59% ✗
- Cap rate
- 4.03%
- Cash-on-cash
- -8.08%
- DSCR
- 0.64
- GRM
- 14.0
CMA / ARV
- ARV (on-the-fly)
- $370,367
- Comps found
- 12
Show comp detail 12 sales within ~0.75 mi
| Address | Dist | Beds/Ba | Sqft | Sold | Price | $/sf | Match |
|---|---|---|---|---|---|---|---|
| 65656 Edgewater Dr | 0.24mi | 4/2.0 (+1) | 1,812 (-6%) | 3mo | $374,900 | $207 | 72 |
| 70414 Winding River Dr | 0.28mi | 4/3.0 (+1) | 2,036 (+6%) | 3mo | $387,000 | $190 | 65 |
| 65062 Mossy Creek Ln | 0.62mi | 3/2.0 | 1,874 (-2%) | 3mo | $299,000 | $160 | 65 |
| 65554 Bowfin Spring Ct | 0.37mi | 4/3.0 (+1) | 2,043 (+6%) | 2mo | $400,000 | $196 | 62 |
| 65394 River Glen Pkwy | 0.43mi | 3/2.0 | 1,711 (-11%) | 1mo | $348,000 | $203 | 61 |
| 65138 Forest Glen Ln | 0.66mi | 4/2.0 (+1) | 1,856 (-3%) | 2mo | $330,000 | $178 | 57 |
| 75599 Bridgewater Dr | 0.61mi | 4/2.0 (+1) | 1,856 (-3%) | 5mo | $330,000 | $178 | 57 |
| 70013 Misty Lake Ct | 0.44mi | 4/2.0 (+1) | 1,705 (-11%) | 2mo | $329,000 | $193 | 54 |
| 75394 Bridgewater Dr | 0.40mi | 4/2.0 (+1) | 2,129 (+11%) | 5mo | $355,000 | $167 | 54 |
| 65570 Bowfin Spring Ct | 0.39mi | 4/2.0 (+1) | 2,132 (+11%) | 5mo | $439,900 | $206 | 54 |
| 65114 Forest Glen Ln | 0.67mi | 3/2.0 | 1,711 (-11%) | 2mo | $332,000 | $194 | 49 |
| 65506 River Glen Pkwy | 0.59mi | 4/2.0 (+1) | 2,160 (+13%) | 3mo | $400,000 | $185 | 44 |
Match score weights: distance 35% · size 25% · config 20% · recency 20%. Top-matched comps best support the ARV.
Projected returns pro-forma
10.0% appreciation · 2.88% rent growth · sell at horizon
- IRR
- 18.6%
- Equity multiple
- 2.51×
- Total profit
- $175,864
- Equity at exit
- $373,865
- IRR
- 17.2%
- Equity multiple
- 5.79×
- Total profit
- $556,363
- Equity at exit
- $806,254
Cash invested: $116,200 (down + closing). Projections, not guarantees.
Landlord ↔ Tenant lean methodology
- Overall (STATE)
- 87 Strongly Landlord-Friendly
- State Florida
- 87 Strongly Landlord-Friendly · R+3
- County
- — inherits STATE
- City
- — inherits STATE
ZIP-level market 32097
- Home prices YoY
- 19.5%
- Rents YoY
- 2.9%
- Active inventory
- 601
- Price-to-rent
- 14.0×
Monthly cashflow live
- Estimated rent
- $2,462 high interval (Pro) →
- Mortgage (P&I)
- −$2,176
- Tax from tax record
- −$333 /mo · $3,993/yr
- Insurance
- −$173
- HOA
- −$45
- Vacancy / Maint / Mgmt
- −$517
- Net cashflow
- $-782
Break-even live
Sensitivity live
| Price | -10% $-547 | -5% $-665 | +0% $-782 | +5% $-900 | +10% $-1,017 |
|---|---|---|---|---|---|
| Rent | -10% $-977 | -5% $-879 | +0% $-782 | +5% $-685 | +10% $-588 |
| Rate | -1.0pp $-573 | -0.5pp $-677 | base $-782 | +0.5pp $-890 | +1.0pp $-999 |
UW: 25.0% down · 7.5% · 30yr · 1.5% tax · 5.0% vac · 8.0% maint · 8.0% mgmt
Financing live
Cash to close
- Down payment
- $103,750
- Closing costs
- $12,450
- Reserves months
- —
- Total cash needed
- —
Loan-product check · same deal, 3 products live
Conventional
25% down · 7.5% · 30yr
- Down + closing
- —
- Monthly P&I
- —
- Monthly cashflow
- —
- DSCR
- —
- Eligible?
- —
Personal DTI + credit; lowest rate.
DSCR
20% down · 8.5% · 30yr
- Down + closing
- —
- Monthly P&I
- —
- Monthly cashflow
- —
- DSCR
- —
- Eligible?
- —
No personal income docs; deal must DSCR.
Hard money
10% down · 12.0% · 12mo
- Down + closing
- —
- Monthly P&I
- —
- Monthly cashflow
- —
- DSCR
- —
- Eligible?
- —
Short-term bridge; refi at stabilization.
Rent comps 11 comps
| Address | Beds | Baths | Sqft | Rent | $/sqft | DOM | Units | Dist |
|---|---|---|---|---|---|---|---|---|
| 75075 Morning Glen Ct Yulee, FL | 4.0 | 2.0 | 1856 | $2,399 | $1.29 | 6d | 1 | 0.17mi |
| 70305 Winding River Dr Yulee, FL | 4.0 | 3.0 | 2042 | $2,500 | $1.22 | 25d | 1 | 0.21mi |
| 75045 Morning Glen Ct Yulee, FL | 3.0 | 2.0 | 1685 | $2,310 | $1.37 | 22d | 1 | 0.24mi |
| 75008 Morning Glen Ct Yulee, FL | 4.0 | 2.0 | 1856 | $2,300 | $1.24 | 25d | 1 | 0.28mi |
| 65303 River Glen Pkwy Yulee, FL | 4.0 | 2.0 | 2160 | $2,400 | $1.11 | 25d | 1 | 0.31mi |
| 65343 River Glen Pkwy Yulee, FL | 3.0 | 2.0 | 1714 | $2,195 | $1.28 | 25d | 1 | 0.34mi |
| 75346 Bridgewater Dr Yulee, FL | 3.0 | 2.0 | 1711 | $2,300 | $1.34 | 25d | 1 | 0.36mi |
| 75094 Glenspring Way Yulee, FL | 3.0 | 2.0 | 2055 | $2,500 | $1.22 | 25d | 1 | 0.42mi |
| 75094 Fern Creek Dr Yulee, FL | 4.0 | 2.0 | 2193 | $2,530 | $1.15 | 0d | 1 | 0.56mi |
| 65013 Lagoon Forest Dr Yulee, FL | 4.0 | 2.5 | 2245 | $2,800 | $1.25 | 12d | 1 | 0.64mi |
| 74700 Mills Preserve Cir Yulee, FL | 1.0–3.0 | 1.0–2.0 | 1127 | $2,025 | $1.80 | 25d | 1 | 1.17mi |
HOA detail
- Monthly dues
- $45 · $540/yr
- Likely covers
- waterpool
Listing history 12 events
-
2026-06-22price $415,000 Active 15 DOM
-
2026-06-21days on market $425,000 Active 15 DOM
-
2026-06-18days on market $425,000 Active 12 DOM
-
2026-06-17days on market $425,000 Active 11 DOM
-
2026-06-16days on market $425,000 Active 10 DOM
-
2026-06-15days on market $425,000 Active 9 DOM
-
2026-06-13days on market $425,000 Active 7 DOM
-
2026-06-13days on market $425,000 Active 6 DOM
-
2026-06-09days on market $425,000 Active 3 DOM
-
2026-06-08days on market $425,000 Active 2 DOM
-
2026-06-07remarks 671-char remark
-
2026-06-07$425,000 Active 1 DOM
ⓘ Source: listings_history table (triggers on properties + properties_extension) + one-shot
backfill from property_details.listing_events for pre-trigger history.
Tax reassessment forecast FL · Resets to sale price
- Current annual tax
- $3,993 · $333/mo
- Projected year-2 tax
- $3,993 · $333/mo
- Expected delta
- $0/yr ($0/mo · -0.0%)
ⓘ Screening estimate from a state-policy table — verify with the county assessor before closing.
Climate risk First Street
- Flood 1/10 Low FEMA zone X (unshaded) · 0% chance over 30 yrs
- Wildfire 7/10 Severe
- Heat 9/10 Extreme 7 d/yr ≥107°F today · 21 d/yr by 30 yrs out
- Wind 9/10 Extreme 99% chance of damaging wind over 30 yrs
- Air quality 5/10 Major 8 unhealthy d/yr today · 10 by 30 yrs out
Nearby sold comps map
Loading sold comps map…
Walkable amenities ~0.75 mi
Loading nearby amenities…
Taxation est. · year 1
- Rental income
- $29,543
- − Mortgage interest
- −$23,246
- − Property taxes
- −$3,993
- − Insurance
- −$2,075
- − Repairs & maintenance
- −$2,363
- − Management
- −$2,363
- − HOA
- −$540
- − Depreciation
- −$12,073
- Taxable loss
- −$17,111
- Est. tax savings @ 24.0%
- +$4,107
- After-tax cash flow
- $-5,278/yr
For passive investors: Depreciation is non-cash, so a rental often shows a tax loss while cash-flowing — sheltering income. Rental losses are passive: they offset passive income freely, and up to $25,000/yr can offset ordinary (W-2) income if you actively participate and your MAGI is under $100k (phasing out to $0 by $150k); unused losses carry forward. On sale, claimed depreciation is recaptured at up to 25%, and gains may owe capital-gains tax (a 1031 exchange can defer both). Figures are a year-1 estimate at your 24.0% rate — not tax advice; consult a CPA.
Schools (NCES district)
- District
- Nassau
- NCES district ID
- 1201350
- Math proficiency
- 74% ▼ -2.00%
- Reading proficiency
- 65% ▼ -2.00%
- Median HH income
- $58,267
- Composite
- 59.79/100
- National rank
- #899
- State rank
- #4 of 73 in FL
Livability — Jacksonville
- Score
- 83/100
- State rank
- #50
- US rank
- #911
Category grades
Schools grade is shown separately in the Schools card above.
Census & demographics
- County
- Nassau County · 67,729 people
- City population
- 979,034
- Metro
- Jacksonville, FL
- Population (ZIP)
- 26,700
- Household income
- $93,161
- Rent vs Own
- Severe rent burden
- 404.0
Population outlook (Nassau County) Hauer SSP2
- Today (2025)
- 88,419 people
- By 2030
- 92,679 · +4.8%
- By 2040
- 99,257 · +12.3%
- By 2050
- 103,378 · +16.9%
- By 2075
- 109,726 · +24.1%
- By 2100
- 107,006 · +21.0%
Race, ethnicity, and origin ACS 2023
- Neighborhood character
- Predominantly White (75%)
- Race & ethnicity
- White 75% Two or more races 9% Black 9% Hispanic / Latino 8% Asian 1% Native American 1%
- Hispanic origin (detail)
- Mexican 2% Puerto Rican 2%
- Common ancestry
- Lithuanian 4% Italian 3% Romanian 2%
- Foreign-born
- 4% · Canada, Vietnam
- Languages at home
- 93% English-only · Spanish 5% Vietnamese 1%
Political lean MEDSL · Nassau
- 2024 margin
- Solid R (+46.9) · D 26.1% · R 73.1%
- 2008→2024 swing
- -3.1pp toward R · 2008: -43.8pp · 2024: -46.9pp
- All cycles
- 2024: R+46.9 2020: R+45.9 2016: R+50.2 2012: R+48.6 2008: R+43.8
Not yet ingested
- Civics
- —
Market trends
- HPI YoY
- ▲ 49.35%
- Current HPI
- 301.9299
- Rent YoY
- ▲ 2.88%
- Metro
- Jacksonville, FL
- State GDP YoY
- ▲ 3.28%
- F500 in state
- 36
Industry mix (Fortune 500 HQ in FL)
| Industry | F500 HQs | Revenue |
|---|---|---|
| Industrial Technology | 2 | $29B |
|
||
| Insurance | 2 | $17B |
|
||
| Retail | 1 | $60B |
|
||
| Technology Distribution | 1 | $58B |
|
||
| Homebuilding | 1 | $35B |
|
||
| Technology Manufacturing | 1 | $35B |
|
||
Price history
-77.9% since first listed13 events — show timeline
- 2026-06-06 Listed $425,000 realMLS
- 2022-02-24 Sold (Public Records) $370,000 Public Records
- 2022-02-18 Sold (MLS) $370,000 AINCAR
- 2022-02-18 Sold (MLS) $370,000 realMLS
- 2021-12-29 Pending — realMLS
- 2021-12-23 Price Changed $405,000 realMLS
- 2021-12-16 Price Changed $425,000 realMLS
- 2021-12-10 Listed $405,000 AINCAR
- 2021-12-10 Listed $450,000 realMLS
- 2017-08-07 Sold (Public Records) $181,000 Public Records
- 2011-12-01 Sold (MLS) $146,990 realMLS
- 2011-09-12 Listed $148,990 realMLS
- 2011-04-01 Sold (Public Records) $1,920,000 Public Records
Property tax history
+10.6%/yrLatest (2025): $3,993 · +1.3% YoY. Source: county tax records.
Cash-flow waterfall
monthlySold comps — $/sqft
last 12 mo · ≤1 miLoading sold comps…