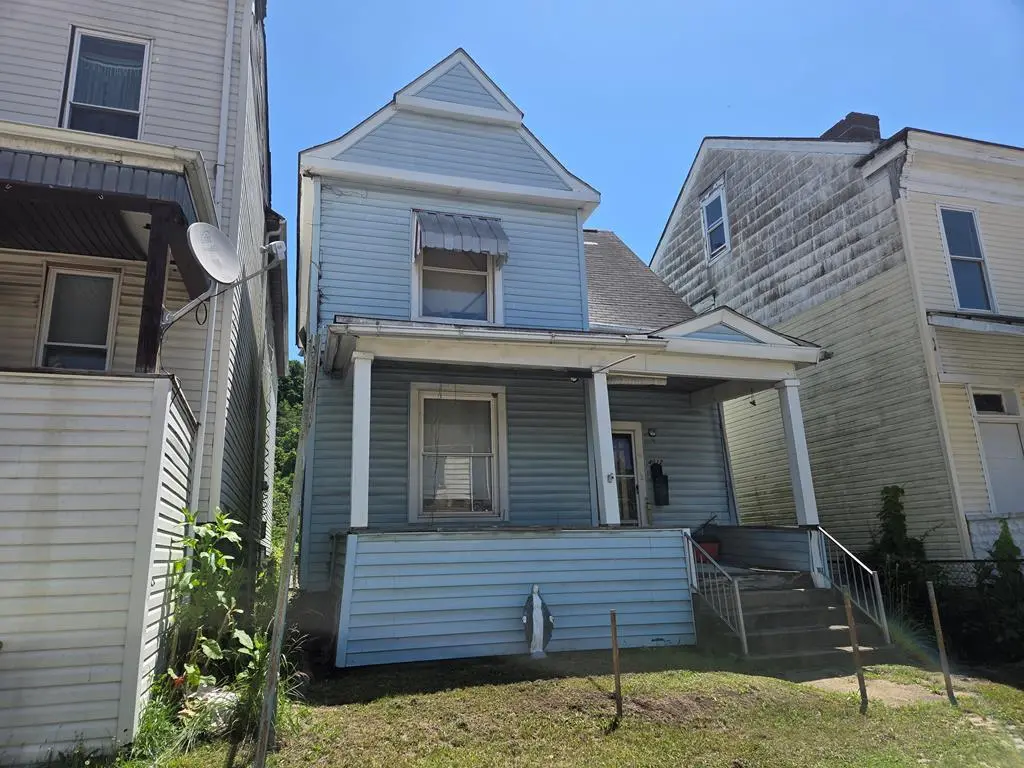
4012 Wood St · Wheeling, WV
Flood risk 10/10 · Severe
- FEMA flood zone
- AE
- Chance of flooding over 30 yrs
- 0.99%
- Est. flood insurance / yr
- $2,026 – $9,024
Fire risk 1/10 · Minimal
- Est. fire insurance / yr
- $787 – $1,461
Heat risk 4/10 · Minor
- Hot days now (above 95°F)
- 7 days/yr
- Hot days in 30 yrs
- 20 days/yr
Wind risk 1/10 · Minimal
- Chance of severe wind over 30 yrs
- —
Air-quality risk 2/10 · Minimal
- Unhealthy air days now
- 0 days/yr
- Unhealthy air days in 30 yrs
- 1 days/yr
Risk factors via First Street. Map © Google.
Why this score? — see what drove the C- grade
The composite is a weighted blend of 9 inputs, each scored 0–100. Each bar is that input's sub-score; the figure is the points it added to the 100-point composite (weight × sub-score).
- Cash flow +15.0/30.0
- Appreciation +10.0/10.0
- ARV discount +7.5/15.0
- 1% rule +5.0/10.0
- DSCR +5.0/10.0
- Schools +3.5/10.0
- Livability +3.5/5.0
- Rent growth +2.5/5.0
- Condition / age +2.5/5.0
$20,000
🖨 Deal sheet 📄 Offer letter ✓ Due diligence
Listing remarks
This unique property offers the best of both worlds! Once a duplex, this home has been thoughtfully converted into a spacious single-family residence, providing plenty of room to spread out and make it your own. With its versatile layout, it could easily be converted back into a duplex for investment opportunities or multi-generational living. Whether you're searching for a roomy home with flexible space or considering an income-producing property, this one has the potential to fit your vision. Don't miss the chance to explore the possibilities this charming home has to offer, schedule your showing today!
Key facts
- Versatile layout
- 2,701 sq ft lot
- Built 1890
Tags
Property features AI
Exterior
- Utilities: Public water; Public sewer
- Home design: Single-family residence (Traditional); 2 stories
- Construction: Aluminum siding
- Exterior features: Porch; Fenced yard; Shingle roof
Interior
- Kitchen: Range; Refrigerator; Electric water heater
- Bedrooms: 6 total rooms (includes bedrooms and living spaces)
- Flooring: Hardwood
- Bathrooms: 2 full bathrooms
- Heating & cooling: Natural gas heating; Space heater
- Interior features: Hardwood flooring; Full basement
Neighborhood map
What this means for you Summary
Snapshot
- This is a 3-bed/2.0-bath single-family listed at $20k.
Deal economics
- At list price, monthly cash flow is $326 ($4k/yr) — positive.
- The deal already cash-flows at list — no discount required.
- Meets the 1% rule at list price ($1k rent vs $20k).
- Cap rate 53.5% vs local median 4.3% in Wheeling — top-decile yield for the area; either an underpriced asset or a hidden risk that comps aren't pricing in. Stress-test before assuming the spread holds.
Location & tenants
- Location reads 69/100 on livability (#74 in WV) — a middle-class / working-renter tenant base. Strengths: cost of living A+, housing A+, health & safety A-; Watch: crime F, amenities F, commute F.
- Ohio County Schools (urban): math 34% / reading 49% proficiency, ranked #5 of 55 in WV (top 9%) — families likely to look elsewhere, expect single-tenant / working-renter base with shorter leases.
- Market conditions: 7 active listings in the ZIP; 2 units permitted in Ohio County in 2024 (0 in 5+ unit buildings).
Forward outlook
- In year one you build about $2k of equity ($138 loan paydown + $2k appreciation (10.0% local appreciation)).
- Ohio County population projected at -17% by 2050 — secular population decline; favor cash flow + early exit over multi-decade hold.
- At projected returns (10.0% appreciation + 3.0% rent growth), your $6k cash investment doubles in ~1 year — after that, you're playing with house money.
Negotiation context
- Only 3 days on market — expect competitive offers; lowballing is unlikely to land.
- 3 sale attempts with the ask held roughly flat each time — persistent listings suggest the price (not the market) is what's stuck; bring a comps-based counter.
Risks & watch-outs
- Watch-outs: flood insurance adds $460/mo; built in 1890 — expect roof / HVAC / electrical / plumbing capex.
- Climate carrying-cost: in FEMA flood zone AE (mandatory federal flood insurance) — expect insurance premiums to compound above CPI over the hold.
Questions for the listing agent
- Built in 1890 — when were the roof, HVAC, electrical panel, plumbing, and water heater last replaced?
- What's the actual annual flood-insurance premium (NFIP or private), and is the property in a SFHA with mandatory coverage?
- Is there a deadline driving the sale (1031 exchange, divorce, estate, relocation)? That informs how much negotiation room exists.
- Schools are B-rated — typically a magnet for longer-tenancy family renters. What's the average tenant stay here, and is there a school-zone premium baked into asking?
- Crime grade is F in this area — have there been break-ins, vandalism, or insurance claims at this property in the last 3 years? What carrier currently insures it and at what premium?
- What's the average days-on-market for RENTAL listings here right now (not sales)? A rising rental-DOM trend means longer vacancies and softer asking-rent achievability than the comps imply.
- What's the recent tenant-quality profile in this submarket — average credit score on applications, eviction rate, late-payment / NSF rate, and stable-employment percentage? A property-management company in the area should have these aggregated.
- How much new for-sale + rental construction is in the pipeline within 1–3 miles? Heavy new supply typically softens prices + rents 12–24 months out; constrained supply supports both.
Investment metrics
- 1% rule
- 5.84% ✓
- Cap rate
- 53.47%
- Cash-on-cash
- 168.49%
- DSCR
- 8.50
- GRM
- 1.4
CMA / ARV
- ARV (on-the-fly)
- $64,272
- Comps found
- 12
Show comp detail 12 sales within ~0.75 mi
| Address | Dist | Beds/Ba | Sqft | Sold | Price | $/sf | Match |
|---|---|---|---|---|---|---|---|
| 3942 Wood St | 0.05mi | 3/2.0 | 1,817 (+10%) | 8mo | $63,500 | $35 | 74 |
| 3707 Wetzel St | 0.29mi | 3/2.0 | 1,572 (-5%) | 14mo | $48,900 | $31 | 67 |
| 4327 Jacob St | 0.29mi | 3/2.0 | 1,724 (+5%) | 18mo | $20,000 | $12 | 64 |
| 3639 Eoff St | 0.34mi | 3/2.0 | 1,600 (-3%) | 20mo | $25,000 | $16 | 63 |
| 41 Ridge Ave | 0.63mi | 3/2.5 | 1,638 (-1%) | 8mo | $64,000 | $39 | 60 |
| 21 48th St | 0.55mi | 3/2.0 | 1,694 (+3%) | 12mo | $34,500 | $20 | 60 |
| 3516 Eoff St | 0.45mi | 2/2.0 (-1) | 1,800 (+9%) | 2mo | $85,000 | $47 | 57 |
| 9 Indian Point Ests | 0.41mi | 3/2.0 | 1,400 (-15%) | 13mo | $225,000 | $161 | 45 |
| 918 Frazier Run Rd | 0.63mi | 4/2.5 (+1) | 1,735 (+5%) | 14mo | $257,000 | $148 | 43 |
| 10 Ark Ave | 0.64mi | 2/2.0 (-1) | 1,444 (-12%) | 11mo | $174,900 | $121 | 36 |
| 4802 Eoff St | 0.57mi | 2/1.0 (-1) | 1,484 (-10%) | 18mo | $41,900 | $28 | 33 |
| 8 S Frazier Ave | 0.68mi | 4/2.0 (+1) | 1,864 (+13%) | 16mo | $152,250 | $82 | 28 |
Match score weights: distance 35% · size 25% · config 20% · recency 20%. Top-matched comps best support the ARV.
Projected returns pro-forma
10.0% appreciation · 3.0% rent growth · sell at horizon
- IRR
- 81.3%
- Equity multiple
- 6.71×
- Total profit
- $31,948
- Equity at exit
- $18,018
- IRR
- 75.7%
- Equity multiple
- 14.99×
- Total profit
- $78,356
- Equity at exit
- $38,856
Cash invested: $5,600 (down + closing). Projections, not guarantees.
Landlord ↔ Tenant lean methodology
- Overall (STATE)
- 83 Strongly Landlord-Friendly
- State West Virginia
- 83 Strongly Landlord-Friendly · R+22
- County
- — inherits STATE
- City
- — inherits STATE
ZIP-level market 26040
- Home prices YoY
- 10.7%
- Active inventory
- 7
- Price-to-rent
- 1.4×
Monthly cashflow live
- Estimated rent
- $1,169 medium interval (Pro) →
- Mortgage (P&I)
- −$105
- Tax from tax record
- −$24 /mo · $287/yr
- Insurance
- −$8
- Flood insurance flood zone
- −$460 /mo · $5,525/yr
- HOA
- −$0
- Vacancy / Maint / Mgmt
- −$245
- Net cashflow
- $326
Break-even live
UW: 25.0% down · 7.5% · 30yr · 1.5% tax · 5.0% vac · 8.0% maint · 8.0% mgmt
Financing live
Cash to close
- Down payment
- $5,000
- Closing costs
- $600
- Reserves months
- —
- Total cash needed
- —
Loan-product check · same deal, 3 products live
Conventional
25% down · 7.5% · 30yr
- Down + closing
- —
- Monthly P&I
- —
- Monthly cashflow
- —
- DSCR
- —
- Eligible?
- —
Personal DTI + credit; lowest rate.
DSCR
20% down · 8.5% · 30yr
- Down + closing
- —
- Monthly P&I
- —
- Monthly cashflow
- —
- DSCR
- —
- Eligible?
- —
No personal income docs; deal must DSCR.
Hard money
10% down · 12.0% · 12mo
- Down + closing
- —
- Monthly P&I
- —
- Monthly cashflow
- —
- DSCR
- —
- Eligible?
- —
Short-term bridge; refi at stabilization.
Listing history 10 events
-
2026-05-31status $20,000 Pending 3 DOM
-
2026-05-31days on market $20,000 Active 3 DOM
-
2026-05-30days on market $20,000 Active 2 DOM
-
2026-05-28$20,000 Active
-
2025-11-26price $25,000
-
2025-10-14price $35,000
-
2025-10-14historical
-
2025-09-18price $35,000
-
2025-04-15$50,000 Active
-
2025-04-14$50,000 Active
ⓘ Source: listings_history table (triggers on properties + properties_extension) + one-shot
backfill from property_details.listing_events for pre-trigger history.
Tax reassessment forecast WV · Resets to sale price
- Current annual tax
- $287 · $24/mo
- Projected year-2 tax
- $287 · $24/mo
- Expected delta
- $0/yr ($0/mo · 0.0%)
ⓘ Screening estimate from a state-policy table — verify with the county assessor before closing.
Climate risk First Street
- Flood 10/10 Extreme FEMA zone AE · 99% chance over 30 yrs
- Wildfire 1/10 Low
- Heat 4/10 Moderate 7 d/yr ≥95°F today · 20 d/yr by 30 yrs out
- Wind 1/10 Low
- Air quality 2/10 Low 0 unhealthy d/yr today · 1 by 30 yrs out
Nearby sold comps map
Loading sold comps map…
Walkable amenities ~0.75 mi
Loading nearby amenities…
Taxation est. · year 1
- Rental income
- $14,027
- − Mortgage interest
- −$1,120
- − Property taxes
- −$287
- − Insurance
- −$5,625
- − Repairs & maintenance
- −$1,122
- − Management
- −$1,122
- − Depreciation
- −$582
- Taxable income
- $4,168
- Est. tax owed @ 24.0%
- −$1,000
- After-tax cash flow
- $2,910/yr
For passive investors: Depreciation is non-cash, so a rental often shows a tax loss while cash-flowing — sheltering income. Rental losses are passive: they offset passive income freely, and up to $25,000/yr can offset ordinary (W-2) income if you actively participate and your MAGI is under $100k (phasing out to $0 by $150k); unused losses carry forward. On sale, claimed depreciation is recaptured at up to 25%, and gains may owe capital-gains tax (a 1031 exchange can defer both). Figures are a year-1 estimate at your 24.0% rate — not tax advice; consult a CPA.
Schools (NCES district)
- District
- Ohio County Schools
- NCES district ID
- 5401050
- Math proficiency
- 34% ▼ -9.00%
- Reading proficiency
- 49% ▼ -6.00%
- Median HH income
- $41,572
- Composite
- 34.88/100
- National rank
- #5085
- State rank
- #5 of 55 in WV
Livability — Wheeling
- Score
- 69/100
- State rank
- #74
- US rank
- #8950
Category grades
Schools grade is shown separately in the Schools card above.
Census & demographics
- Census place
- Wheeling, WV
- City population
- 39,982
- Population (ZIP)
- 1,855
Population outlook (Ohio County) Hauer SSP2
- Today (2025)
- 40,604 people
- By 2030
- 39,150 · -3.6%
- By 2040
- 36,039 · -11.2%
- By 2050
- 33,582 · -17.3%
- By 2075
- 28,662 · -29.4%
- By 2100
- 22,963 · -43.4%
Race, ethnicity, and origin ACS 2023
- Neighborhood character
- Predominantly White (87%)
- Race & ethnicity
- White 87% Two or more races 12%
- Common ancestry
- Slovak 7% Romanian 4% Serbian 3%
- Foreign-born
- 1%
- Languages at home
- 99% English-only · Spanish 1%
Political lean MEDSL · Ohio
- 2024 margin
- Strong R (+26.0) · D 36.0% · R 62.0% · Other 2.0%
- 2008→2024 swing
- -15.3pp toward R · 2008: -10.8pp · 2024: -26.0pp
- All cycles
- 2024: R+26.0 2020: R+25.8 2016: R+31.6 2012: R+22.5 2008: R+10.8
Not yet ingested
- Civics
- —
Market trends
- HPI YoY
- ▲ 17.95%
- Current HPI
- 186.1524
- Rent YoY
- —
- Metro
- —
- State GDP YoY
- —
- F500 in state
- 0
Price history
-60.0% since first listed7 events — show timeline
- 2026-05-28 Listed $20,000 WBOR
- 2025-11-26 Price Changed $25,000 WBOR
- 2025-10-14 Price Changed $35,000 MLSNOW
- 2025-10-14 Listing Removed — MLSNOW
- 2025-09-18 Price Changed $35,000 WBOR
- 2025-04-15 Listed $50,000 WBOR
- 2025-04-14 Listed $50,000 MLSNOW
Property tax history
+2.0%/yrLatest (2025): $287 · +4.6% YoY. Source: county tax records.
Cash-flow waterfall
monthlySold comps — $/sqft
last 12 mo · ≤1 miLoading sold comps…