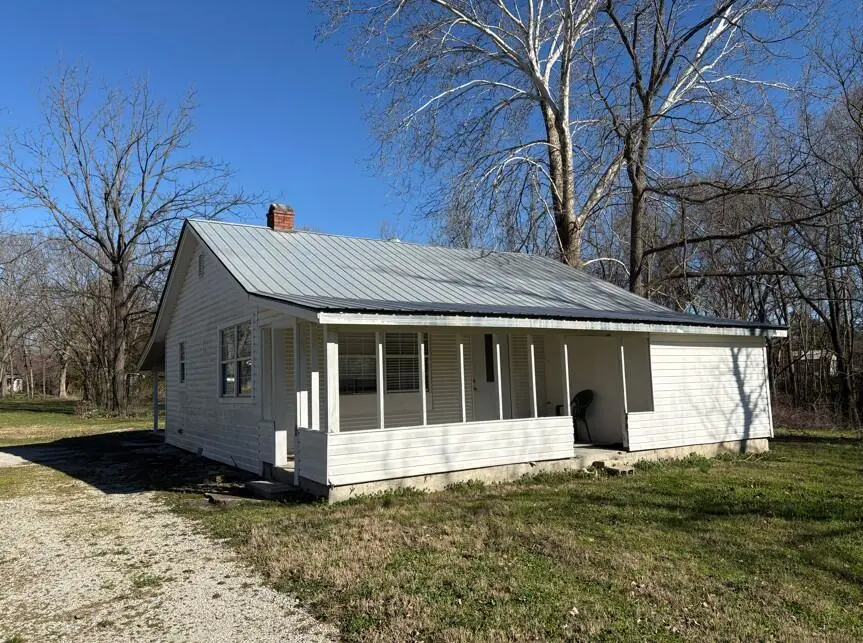
29060 Main St · Seligman, MO
Flood risk 1/10 · Minimal
- FEMA flood zone
- X (unshaded)
- Chance of flooding over 30 yrs
- 0.0%
- Est. flood insurance / yr
- $507 – $1,088
Fire risk 4/10 · Minor
- Est. fire insurance / yr
- $1,054 – $1,958
Heat risk 4/10 · Minor
- Hot days now (above 103°F)
- 7 days/yr
- Hot days in 30 yrs
- 20 days/yr
Wind risk 2/10 · Minimal
- Chance of severe wind over 30 yrs
- 2.0%
Air-quality risk 2/10 · Minimal
- Unhealthy air days now
- 1 days/yr
- Unhealthy air days in 30 yrs
- 1 days/yr
Risk factors via First Street. Map © Google.
Why this score? — see what drove the D grade
The composite is a weighted blend of 9 inputs, each scored 0–100. Each bar is that input's sub-score; the figure is the points it added to the 100-point composite (weight × sub-score).
- ARV discount +10.7/15.0
- Cash flow +10.2/30.0
- Appreciation +8.2/10.0
- Livability +3.2/5.0
- DSCR +2.9/10.0
- Rent growth +2.5/5.0
- Condition / age +2.5/5.0
- Schools +2.1/10.0
- 1% rule +1.8/10.0
$119,900
🖨 Deal sheet (PDF) 📄 Offer letter ✓ Due diligence
Listing remarks MLS
Large city lot. Property has many mature trees, Very private setting, but in town. City water and sewer, potential for 5 or more building sites. Frontage on Stapleton and /Main Streets Investors! Let's go see this great opportunity, so close to Northwest Arkansas!
Key facts
- Vinyl windows
- Metal roof
- Remodeled farmhouse
Tags
Property features AI
Exterior
- Parking: 2-car garage
- Utilities: Public water
- Home design: Single-family residence; One level
- Exterior features: Shingle roof; Shed(s) and additional outbuilding on the property; Few trees and mostly cleared lot; Asphalt road frontage on a public, city-maintained street; Approximately 0.5 acre lot
Interior
- Bathrooms: 1 full bathroom
- Heating & cooling: Central air; Wall unit(s); Electric forced-air heat
- Interior features: Central and wall-unit air conditioning; Forced-air electric heating
Neighborhood map
What this means for you Summary
Snapshot
- This is a 2-bed/1.0-bath single-family listed at $120k.
Deal economics
- At list price, monthly cash flow is $-69 ($-823/yr) — negative.
- To cash-flow at today's rent, offer at most $108k (10.1% below list).
- To meet the 1% rule (rent ≥ 1% of price), the offer needs to be $82k (31.8% below list).
- Recommended offer: $82k (31.8% below list) — sets the bar for 1% rule.
Location & tenants
- Location reads 65/100 on livability (#274 in MO) — a middle-class / working-renter tenant base. Strengths: crime A+, cost of living A+, housing A+; Watch: amenities F, commute F, employment F.
- Southwest R-V (rural): math 19% / reading 32% proficiency, ranked #288 of 324 in MO (top 89%) — low school quality limits family demand, transient renter base, plan for 1-2y turnover.
- Zoned schools: Southwest Elem. (math 22% / reading 27%, grade F, #879 of 1,115 statewide, top 81%, 347 students, 64% FRL); Southwest Middle (math 18% / reading 28%, grade F, #330 of 391 statewide, top 84%, 219 students, 61% FRL); Southwest High (math 17% / reading 54%, grade F, #314 of 521 statewide, top 61%, 262 students, 56% FRL).
- Market conditions: 36 active listings in the ZIP; 57 units permitted in Barry County in 2024 (0 in 5+ unit buildings).
Forward outlook
- In year one you build about $9k of equity ($829 loan paydown + $8k appreciation (6.5% local appreciation)).
- Barry County population projected at -13% by 2050 — secular population decline; favor cash flow + early exit over multi-decade hold.
- At projected returns (6.5% appreciation + 3.0% rent growth), your $34k cash investment doubles in ~4 years — after that, you're playing with house money.
- By year 5, paydown + projected appreciation supports a ~$38k cash-out refi (75% LTV) — recoverable capital for the next deal without selling this one.
Negotiation context
- Only 9 days on market — expect competitive offers; lowballing is unlikely to land.
- 7 sale attempts since 7y ago with the ask held roughly flat each time — persistent listings suggest the price (not the market) is what's stuck; bring a comps-based counter.
Risks & watch-outs
- Watch-outs: built in 1934 — expect roof / HVAC / electrical / plumbing capex.
Questions for the listing agent
- What do current leases actually rent for vs. the listed asking? Can we see a recent rent roll and the last 12 months of T-12 income?
- Built in 1934 — when were the roof, HVAC, electrical panel, plumbing, and water heater last replaced?
- Is there a deadline driving the sale (1031 exchange, divorce, estate, relocation)? That informs how much negotiation room exists.
- Schools are F-rated, which usually means shorter tenancies and higher turnover. Who's the typical renter profile here, and what's been the actual vacancy rate?
- The area grade is low — what's the realistic commute time and amenity access for the typical tenant pool here? Any planned neighborhood developments (good or bad) we should know about?
- What's the average days-on-market for RENTAL listings here right now (not sales)? A rising rental-DOM trend means longer vacancies and softer asking-rent achievability than the comps imply.
- What's the recent tenant-quality profile in this submarket — average credit score on applications, eviction rate, late-payment / NSF rate, and stable-employment percentage? A property-management company in the area should have these aggregated.
- How much new for-sale + rental construction is in the pipeline within 1–3 miles? Heavy new supply typically softens prices + rents 12–24 months out; constrained supply supports both.
Investment metrics
- 1% rule
- 0.68% ✗
- Cap rate
- 5.61%
- Cash-on-cash
- -2.45%
- DSCR
- 0.89
- GRM
- 12.2
CMA / ARV
- ARV (median comp)
- $129,069
- List price
- $119,900
- Delta
- 54.18%
- Verdict
- OVERPRICED
- Comps
- 6 within 1.0 mi
Projected returns pro-forma
6.47% appreciation · 3.0% rent growth · sell at horizon
- IRR
- 14.5%
- Equity multiple
- 2.00×
- Total profit
- $33,577
- Equity at exit
- $78,976
- IRR
- 14.6%
- Equity multiple
- 4.02×
- Total profit
- $101,272
- Equity at exit
- $146,436
Cash invested: $33,572 (down + closing). Projections, not guarantees.
Landlord ↔ Tenant lean methodology
- Overall (STATE)
- 81 Strongly Landlord-Friendly
- State Missouri
- 81 Strongly Landlord-Friendly · R+10
- County
- — inherits STATE
- City
- — inherits STATE
ZIP-level market 65745
- Home prices YoY
- 2.9%
- Active inventory
- 36
- Price-to-rent
- 12.2×
Monthly cashflow live
- Estimated rent
- $818 medium interval (Pro) →
- Mortgage (P&I)
- −$629
- Tax from tax record
- −$36 /mo · $436/yr
- Insurance
- −$50
- HOA
- −$0
- Vacancy / Maint / Mgmt
- −$172
- Net cashflow
- $-69
Break-even live
Sensitivity live
| Price | -10% $-1 | -5% $-35 | +0% $-69 | +5% $-103 | +10% $-136 |
|---|---|---|---|---|---|
| Rent | -10% $-133 | -5% $-101 | +0% $-69 | +5% $-36 | +10% $-4 |
| Rate | -1.0pp $-8 | -0.5pp $-38 | base $-69 | +0.5pp $-100 | +1.0pp $-131 |
UW: 25.0% down · 7.5% · 30yr · 1.5% tax · 5.0% vac · 8.0% maint · 8.0% mgmt
Financing live
Cash to close
- Down payment
- $29,975
- Closing costs
- $3,597
- Reserves months
- —
- Total cash needed
- —
Loan-product check · same deal, 3 products live
Conventional
25% down · 7.5% · 30yr
- Down + closing
- —
- Monthly P&I
- —
- Monthly cashflow
- —
- DSCR
- —
- Eligible?
- —
Personal DTI + credit; lowest rate.
DSCR
20% down · 8.5% · 30yr
- Down + closing
- —
- Monthly P&I
- —
- Monthly cashflow
- —
- DSCR
- —
- Eligible?
- —
No personal income docs; deal must DSCR.
Hard money
10% down · 12.0% · 12mo
- Down + closing
- —
- Monthly P&I
- —
- Monthly cashflow
- —
- DSCR
- —
- Eligible?
- —
Short-term bridge; refi at stabilization.
Listing history 26 events
-
2026-06-21days on market $119,900 Active 9 DOM
-
2026-06-18days on market $119,900 Active 6 DOM
-
2026-06-17days on market $119,900 Active 5 DOM
-
2026-06-16days on market $119,900 Active 4 DOM
-
2026-06-15days on market $119,900 Active 3 DOM
-
2026-06-13pricedays on market $119,900 Active 1 DOM
-
2026-06-10days on market $199,000 Active 94 DOM
-
2026-06-09days on market $199,000 Active 93 DOM
-
2026-06-08days on market $199,000 Active 92 DOM
-
2026-06-07days on market $199,000 Active 91 DOM
-
2026-06-03days on market $199,000 Active 87 DOM
-
2026-06-02days on market $199,000 Active 86 DOM
-
2026-06-01days on market $199,000 Active 85 DOM
-
2026-05-31days on market $199,000 Active 84 DOM
-
2026-05-31days on market $199,000 Active 83 DOM
-
2026-04-04price $199,000 494-char remark
Show marketing remark (494 chars)
Small acreage with fully remodeled farmhouse. All new sheetrock, paint, LVP floors. Metal roof. High efficiency HVAC unit. All new Vinyl windows. Move in ready. Lot has many mature trees, very private setting, but in town. Detached garage, utility shed and well house. Investors! Paved road frontage on 2 sides! This lot could easily accommodate 4 or more additional homes to take advantage of public water and sewer access. Let's go see this great opportunity, so close to Northwest Arkansas!
-
2026-03-09$209,000 Active 494-char remark
Show marketing remark (494 chars)
Small acreage with fully remodeled farmhouse. All new sheetrock, paint, LVP floors. Metal roof. High efficiency HVAC unit. All new Vinyl windows. Move in ready. Lot has many mature trees, very private setting, but in town. Detached garage, utility shed and well house. Investors! Paved road frontage on 2 sides! This lot could easily accommodate 4 or more additional homes to take advantage of public water and sewer access. Let's go see this great opportunity, so close to Northwest Arkansas!
-
2025-09-02status Active
-
2025-05-07price $199,950
-
2025-05-07price $199,950
-
2025-05-07price $199,950
-
2025-02-27$209,000 Active
-
2024-08-15$199,950 Active
-
2021-08-24soldstatus
-
2019-02-25soldstatus
-
2019-01-08$67,900
ⓘ Source: listings_history table (triggers on properties + properties_extension) + one-shot
backfill from property_details.listing_events for pre-trigger history.
Tax reassessment forecast MO · Resets to sale price
- Current annual tax
- $436 · $36/mo
- Projected year-2 tax
- $1,163 · $97/mo
- Expected delta
- +$728/yr (+$61/mo · 167.0%)
ⓘ Screening estimate from a state-policy table — verify with the county assessor before closing.
Climate risk First Street
- Flood 1/10 Low FEMA zone X (unshaded) · 0% chance over 30 yrs
- Wildfire 4/10 Moderate
- Heat 4/10 Moderate 7 d/yr ≥103°F today · 20 d/yr by 30 yrs out
- Wind 2/10 Low 2% chance of damaging wind over 30 yrs
- Air quality 2/10 Low 1 unhealthy d/yr today · 1 by 30 yrs out
Nearby sold comps map
Loading sold comps map…
Walkable amenities ~0.75 mi
Loading nearby amenities…
Taxation est. · year 1
- Rental income
- $9,819
- − Mortgage interest
- −$6,716
- − Property taxes
- −$436
- − Insurance
- −$600
- − Repairs & maintenance
- −$786
- − Management
- −$786
- − Depreciation
- −$3,488
- Taxable loss
- −$2,991
- Est. tax savings @ 24.0%
- +$718
- After-tax cash flow
- $-105/yr
For passive investors: Depreciation is non-cash, so a rental often shows a tax loss while cash-flowing — sheltering income. Rental losses are passive: they offset passive income freely, and up to $25,000/yr can offset ordinary (W-2) income if you actively participate and your MAGI is under $100k (phasing out to $0 by $150k); unused losses carry forward. On sale, claimed depreciation is recaptured at up to 25%, and gains may owe capital-gains tax (a 1031 exchange can defer both). Figures are a year-1 estimate at your 24.0% rate — not tax advice; consult a CPA.
Schools (NCES district)
- District
- Southwest R-V
- NCES district ID
- 2928710
- Math proficiency
- 19% ▼ -4.00%
- Reading proficiency
- 32% ▼ -3.00%
- Median HH income
- $35,609
- Composite
- 21.05/100
- National rank
- #8449
- State rank
- #288 of 324 in MO
Livability — Seligman
- Score
- 65/100
- State rank
- #274
- US rank
- #12859
Category grades
Schools grade is shown separately in the Schools card above.
Census & demographics
- Census place
- Seligman, MO
- Population (ZIP)
- 3,230
Population outlook (Barry County) Hauer SSP2
- Today (2025)
- 35,207 people
- By 2030
- 34,460 · -2.1%
- By 2040
- 32,643 · -7.3%
- By 2050
- 30,688 · -12.8%
- By 2075
- 26,898 · -23.6%
- By 2100
- 22,000 · -37.5%
Race, ethnicity, and origin ACS 2023
- Neighborhood character
- Predominantly White (89%)
- Race & ethnicity
- White 89% Two or more races 7% Hispanic / Latino 4% Native American 1%
- Common ancestry
- Romanian 4% Lithuanian 4% Slovak 3%
- Foreign-born
- 2% · Canada
- Languages at home
- 97% English-only · Spanish 2%
Political lean MEDSL · Barry
- 2024 margin
- Solid R (+63.5) · D 17.8% · R 81.3%
- 2008→2024 swing
- -28.5pp toward R · 2008: -35.0pp · 2024: -63.5pp
- All cycles
- 2024: R+63.5 2020: R+60.8 2016: R+59.7 2012: R+44.7 2008: R+35.0
Not yet ingested
- Civics
- —
Market trends
- HPI YoY
- ▲ 6.47%
- Current HPI
- 227.5875
- Rent YoY
- —
- Metro
- —
- State GDP YoY
- ▲ 1.84%
- F500 in state
- 20
Industry mix (Fortune 500 HQ in MO)
| Industry | F500 HQs | Revenue |
|---|---|---|
| Healthcare | 1 | $163B |
|
||
| Insurance | 1 | $21B |
|
||
| Industrial Technology | 1 | $17B |
|
||
| Retail | 1 | $16B |
|
||
| Industrial Distribution | 1 | $10B |
|
||
| Utilities | 1 | $9B |
|
||
Price history
+76.6% since first listed13 events — show timeline
- 2026-06-12 Listed $119,900 SOMO
- 2026-06-12 Listed $89,900 SOMO
- 2026-04-04 Price Changed $199,000 SOMO
- 2026-03-09 Listed $209,000 SOMO
- 2025-09-02 Relisted — SOMO
- 2025-05-07 Price Changed $199,950 SOMO
- 2025-05-07 Price Changed $199,950 OGAR
- 2025-05-07 Price Changed $199,950 NWARMLS
- 2025-02-27 Listed $209,000 SOMO
- 2024-08-15 Listed $199,950 SOMO
- 2021-08-24 Sold (Public Records) — Public Records
- 2019-02-25 Sold (MLS) — SOMO
- 2019-01-08 Listed $67,900 SOMO
Property tax history
+2.9%/yrLatest (2025): $436 · +6.1% YoY. Source: county tax records.
Cash-flow waterfall
monthlySold comps — $/sqft
last 12 mo · ≤1 miLoading sold comps…