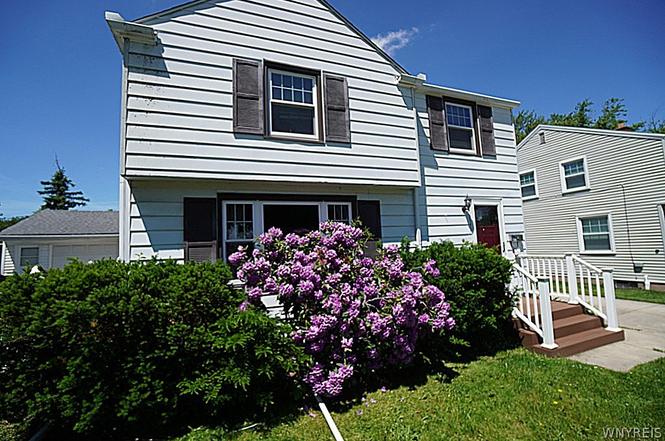
318 Belmont Ave · Tonawanda Town, NY
Flood risk 1/10 · Minimal
- FEMA flood zone
- X (unshaded)
- Chance of flooding over 30 yrs
- 0.0%
- Est. flood insurance / yr
- $473 – $860
Fire risk 1/10 · Minimal
- Est. fire insurance / yr
- $691 – $1,283
Heat risk 3/10 · Minor
- Hot days now (above 92°F)
- 7 days/yr
- Hot days in 30 yrs
- 15 days/yr
Wind risk 1/10 · Minimal
- Chance of severe wind over 30 yrs
- —
Air-quality risk 3/10 · Minor
- Unhealthy air days now
- 3 days/yr
- Unhealthy air days in 30 yrs
- 4 days/yr
Risk factors via First Street. Map © Google.
Why this score? — see what drove the C- grade
The composite is a weighted blend of 9 inputs, each scored 0–100. Each bar is that input's sub-score; the figure is the points it added to the 100-point composite (weight × sub-score).
- Cash flow +15.0/30.0
- ARV discount +15.0/15.0
- DSCR +4.6/10.0
- 1% rule +4.3/10.0
- Schools +3.9/10.0
- Rent growth +2.5/5.0
- Livability +2.5/5.0
- Condition / age +2.5/5.0
- Appreciation +0.0/10.0
$249,900
🖨 Deal sheet (PDF) 📄 Offer letter ✓ Due diligence
Listing remarks
Welcome home to this lovingly maintained 3-bedroom, 2 full bath residence in the heart of the Town of Tonawanda! Owned by the same family for 53 years, this home reflects decades of pride in ownership. The spacious layout features a beautiful family room addition, offering the perfect gathering space for relaxing, entertaining, or creating lasting memories. Generous living areas, comfortable bedrooms, and two full baths provide plenty of room for everyday living. Conveniently located close to shopping, restaurants, parks, schools, and major conveniences, this is a wonderful opportunity to own a cherished home in a highly desirable location. Updates include: Roof 2023, Furnace and central ai
Key facts
- Family room addition
- Updates include roof
- 7,508 sq ft lot
Tags
Property features AI
Exterior
- Parking: Detached garage; Approximately 1.5 garage spaces
- Utilities: Public water connected; Sewer connected; Electric with circuit breakers
- Home design: 2-story house; Existing (previously built) structure
- Construction: Aluminum and vinyl siding; Asphalt roof; Poured foundation; Resale condition
- Exterior features: Concrete driveway; Fully fenced yard; Rectangular residential lot; Road frontage on a city street; Lot dimensions approximately 47 x 159
Interior
- Kitchen: Gas oven; Gas range; Refrigerator
- Bedrooms: 7 total rooms (includes living and family rooms)
- Flooring: Carpet; Vinyl; Varies
- Bathrooms: 2 full bathrooms; 1 main-level bathroom
- Heating & cooling: Gas forced-air heating; Central air conditioning
- Interior features: Separate/formal dining room; Eat-in kitchen; Separate/formal living room; Partial basement
- Laundry & utility: Gas water heater
Neighborhood map
What this means for you Summary
Snapshot
- This is a 4-bed/2.0-bath single-family listed at $250k.
Deal economics
- At list price, monthly cash flow is $79 ($943/yr) — positive.
- The deal already cash-flows at list — no discount required.
- To meet the 1% rule (rent ≥ 1% of price), the offer needs to be $233k (6.6% below list).
- Recommended offer: $233k (6.6% below list) — sets the bar for 1% rule.
- Cap rate 6.7% vs local median 4.1% in Tonawanda Town — top-decile yield for the area; either an underpriced asset or a hidden risk that comps aren't pricing in. Stress-test before assuming the spread holds.
Location & tenants
- Location reads: area grade C — affects rentability + tenant quality, not the cash-flow math above.
- Kenmore-Tonawanda Union Free School District (suburban): math 44% / reading 47% proficiency, ranked #453 of 590 in NY (top 77%) — families likely to look elsewhere, expect single-tenant / working-renter base with shorter leases.
- Zoned schools: Herbert Hoover Elementary School (math 37% / reading 52%, grade F, #1,277 of 2,108 statewide, top 64%, 565 students, 43% FRL); Herbert Hoover Middle School (math 24% / reading 39%, grade F, #522 of 729 statewide, top 73%, 758 students, 51% FRL); Kenmore West Senior High School (math 74% / reading 57%, grade B, #773 of 1,100 statewide, top 70%, 1,358 students, 51% FRL) — zoned schools average 48% FRL vs 33% district-wide (15 pts higher); higher-poverty schools than district average — tighter screening recommended.
- Market conditions: 122 active listings in the ZIP; 6 comparable units currently listed for rent nearby; rentals at typical pace (median 19d on market — plan ~3-4 weeks tenant-placement turnaround); solid renter incomes; 1,244 units permitted in Erie County in 2024 (563 in 5+ unit buildings).
- This rent runs 33% of the median local income ($84k/yr) — at the standard rent-burdened threshold; future hikes will face affordability resistance.
Forward outlook
- Local home prices are declining (-3.0%/yr); year-one equity from $2k of loan paydown is wiped out by about $7k of value loss. Plan a longer hold.
Negotiation context
- Only 9 days on market — expect competitive offers; lowballing is unlikely to land.
Risks & watch-outs
- Watch-outs: built in 1947 — expect roof / HVAC / electrical / plumbing capex.
Questions for the listing agent
- Built in 1947 — when were the roof, HVAC, electrical panel, plumbing, and water heater last replaced?
- Is there a deadline driving the sale (1031 exchange, divorce, estate, relocation)? That informs how much negotiation room exists.
- What's the average days-on-market for RENTAL listings here right now (not sales)? A rising rental-DOM trend means longer vacancies and softer asking-rent achievability than the comps imply.
- What's the recent tenant-quality profile in this submarket — average credit score on applications, eviction rate, late-payment / NSF rate, and stable-employment percentage? A property-management company in the area should have these aggregated.
- How much new for-sale + rental construction is in the pipeline within 1–3 miles? Heavy new supply typically softens prices + rents 12–24 months out; constrained supply supports both.
Investment metrics
- 1% rule
- 0.93% ✗
- Cap rate
- 6.67%
- Cash-on-cash
- 1.35%
- DSCR
- 1.06
- GRM
- 8.9
CMA / ARV
- ARV (on-the-fly)
- $333,720
- Comps found
- 12
Show comp detail 12 sales within ~0.75 mi
| Address | Dist | Beds/Ba | Sqft | Sold | Price | $/sf | Match |
|---|---|---|---|---|---|---|---|
| 12 Colvinhurst Dr | 0.23mi | 3/1.5 (-1) | 1,538 (-5%) | 3mo | $375,000 | $244 | 71 |
| 211 Liston St | 0.55mi | 4/2.0 | 1,594 (-2%) | 2mo | $350,000 | $220 | 70 |
| 71 Gardenwood Ln | 0.27mi | 3/1.5 (-1) | 1,499 (-8%) | 3mo | $237,750 | $159 | 66 |
| 262 Vicksburg Ave | 0.54mi | 3/1.5 (-1) | 1,600 (-1%) | 1mo | $330,000 | $206 | 65 |
| 311 Zimmerman Blvd | 0.60mi | 3/2.0 (-1) | 1,656 (+2%) | 2mo | $265,000 | $160 | 62 |
| 11 Colvinhurst Dr | 0.24mi | 3/2.0 (-1) | 1,400 (-14%) | 2mo | $333,000 | $238 | 60 |
| 120 Ashford Ave | 0.53mi | 3/1.5 (-1) | 1,480 (-9%) | 1mo | $385,000 | $260 | 53 |
| 86 Highland Pkwy | 0.54mi | 3/1.5 (-1) | 1,428 (-12%) | 1mo | $342,500 | $240 | 48 |
| 142 Cortland Ave | 0.60mi | 3/1.5 (-1) | 1,456 (-10%) | 4mo | $242,500 | $167 | 45 |
| 256 Ashford Ave | 0.75mi | 3/1.5 (-1) | 1,494 (-8%) | 1mo | $290,000 | $194 | 44 |
| 230 Glencove Rd | 0.54mi | 3/1.0 (-1) | 1,400 (-14%) | 4mo | $265,000 | $189 | 40 |
| 207 Zimmerman Blvd | 0.74mi | 3/2.0 (-1) | 1,389 (-14%) | 0mo | $280,000 | $202 | 36 |
Match score weights: distance 35% · size 25% · config 20% · recency 20%. Top-matched comps best support the ARV.
Projected returns pro-forma
-3.0% appreciation · 3.0% rent growth · sell at horizon
- IRR
- -14.1%
- Equity multiple
- 0.49×
- Total profit
- $-35,430
- Equity at exit
- $37,261
- IRR
- -5.3%
- Equity multiple
- 0.65×
- Total profit
- $-24,166
- Equity at exit
- $21,607
Cash invested: $69,972 (down + closing). Projections, not guarantees.
Landlord ↔ Tenant lean methodology
- Overall (STATE)
- 15 Strongly Tenant-Friendly
- State New York
- 15 Strongly Tenant-Friendly · D+10
- County
- — inherits STATE
- City
- — inherits STATE
ZIP-level market 14223
- Active inventory
- 122
- Price-to-rent
- 8.9×
Monthly cashflow live
- Estimated rent
- $2,335 high interval (Pro) →
- Mortgage (P&I)
- −$1,311
- Tax from tax record
- −$351 /mo · $4,216/yr
- Insurance
- −$104
- HOA
- −$0
- Vacancy / Maint / Mgmt
- −$490
- Net cashflow
- $79
Break-even live
Sensitivity live
| Price | -10% $220 | -5% $149 | +0% $79 | +5% $8 | +10% $-63 |
|---|---|---|---|---|---|
| Rent | -10% $-106 | -5% $-14 | +0% $79 | +5% $171 | +10% $263 |
| Rate | -1.0pp $204 | -0.5pp $142 | base $79 | +0.5pp $14 | +1.0pp $-52 |
UW: 25.0% down · 7.5% · 30yr · 1.5% tax · 5.0% vac · 8.0% maint · 8.0% mgmt
Financing live
Cash to close
- Down payment
- $62,475
- Closing costs
- $7,497
- Reserves months
- —
- Total cash needed
- —
Loan-product check · same deal, 3 products live
Conventional
25% down · 7.5% · 30yr
- Down + closing
- —
- Monthly P&I
- —
- Monthly cashflow
- —
- DSCR
- —
- Eligible?
- —
Personal DTI + credit; lowest rate.
DSCR
20% down · 8.5% · 30yr
- Down + closing
- —
- Monthly P&I
- —
- Monthly cashflow
- —
- DSCR
- —
- Eligible?
- —
No personal income docs; deal must DSCR.
Hard money
10% down · 12.0% · 12mo
- Down + closing
- —
- Monthly P&I
- —
- Monthly cashflow
- —
- DSCR
- —
- Eligible?
- —
Short-term bridge; refi at stabilization.
Rent comps 6 comps
| Address | Beds | Baths | Sqft | Rent | $/sqft | DOM | Units | Dist |
|---|---|---|---|---|---|---|---|---|
| 151 Lamson Rd Buffalo, NY | 4.0 | 2.0 | 1382 | $2,350 | $1.70 | 19d | 1 | 0.94mi |
| 954 Brighton Rd Tonawanda, NY | 3.0 | 2.0 | 1560 | $1,700 | $1.09 | 5d | 1 | 1.21mi |
| 148 Colonial Ave Buffalo, NY | 4.0 | 2.0 | 1240 | $2,900 | $2.34 | 25d | 1 | 1.32mi |
| 237 W Girard Blvd Buffalo, NY | 4.0 | 1.5 | 1329 | $4,000 | $3.01 | 25d | 1 | 1.45mi |
| 172 Tremont Ave Kenmore, NY | 3.0 | 1.5 | 1569 | $2,500 | $1.59 | 12d | 1 | 1.48mi |
| 524 University Ave Buffalo, NY | 3.0 | 1.0 | 1840 | $1,600 | $0.87 | 3d | 1 | 1.48mi |
Listing history 7 events
-
2026-06-21statusdays on market $249,900 Pending 9 DOM
-
2026-06-18days on market $249,900 Active 8 DOM
-
2026-06-17days on market $249,900 Active 7 DOM
-
2026-06-16days on market $249,900 Active 6 DOM
-
2026-06-15days on market $249,900 Active 5 DOM
-
2026-06-13remarks 699-char remark
-
2026-06-13$249,900 Active 3 DOM
ⓘ Source: listings_history table (triggers on properties + properties_extension) + one-shot
backfill from property_details.listing_events for pre-trigger history.
Tax reassessment forecast NY · Partial reset (capped growth)
- Current annual tax
- $4,216 · $351/mo
- Projected year-2 tax
- $4,219 · $352/mo
- Expected delta
- +$4/yr ($0/mo · 0.1%)
ⓘ Screening estimate from a state-policy table — verify with the county assessor before closing.
Climate risk First Street
- Flood 1/10 Low FEMA zone X (unshaded) · 0% chance over 30 yrs
- Wildfire 1/10 Low
- Heat 3/10 Moderate 7 d/yr ≥92°F today · 15 d/yr by 30 yrs out
- Wind 1/10 Low
- Air quality 3/10 Moderate 3 unhealthy d/yr today · 4 by 30 yrs out
Nearby sold comps map
Loading sold comps map…
Walkable amenities ~0.75 mi
Loading nearby amenities…
Taxation est. · year 1
- Rental income
- $28,018
- − Mortgage interest
- −$13,998
- − Property taxes
- −$4,216
- − Insurance
- −$1,250
- − Repairs & maintenance
- −$2,241
- − Management
- −$2,241
- − Depreciation
- −$7,270
- Taxable loss
- −$3,198
- Est. tax savings @ 24.0%
- +$768
- After-tax cash flow
- $1,711/yr
For passive investors: Depreciation is non-cash, so a rental often shows a tax loss while cash-flowing — sheltering income. Rental losses are passive: they offset passive income freely, and up to $25,000/yr can offset ordinary (W-2) income if you actively participate and your MAGI is under $100k (phasing out to $0 by $150k); unused losses carry forward. On sale, claimed depreciation is recaptured at up to 25%, and gains may owe capital-gains tax (a 1031 exchange can defer both). Figures are a year-1 estimate at your 24.0% rate — not tax advice; consult a CPA.
Schools (NCES district)
- District
- Kenmore-Tonawanda Union Free School District
- NCES district ID
- 3616230
- Math proficiency
- 44% ▼ -12.00%
- Reading proficiency
- 47% ▼ -1.00%
- Median HH income
- $51,433
- Composite
- 39.18/100
- National rank
- #4024
- State rank
- #453 of 590 in NY
Livability — Tonawanda Town
No livability data for this city. (Only ~50 U.S. cities are tracked.)
Census & demographics
- Census place
- Tonawanda Town, NY
- County
- Erie County · 714,559 people
- City population
- 63,948
- Metro
- Buffalo-Cheektowaga, NY
- Population (ZIP)
- 22,611
- Household income
- $84,161
- Rent vs Own
- Severe rent burden
- 368.0
Population outlook (Erie County) Hauer SSP2
- Today (2025)
- 933,037 people
- By 2030
- 935,181 · +0.2%
- By 2040
- 928,531 · -0.5%
- By 2050
- 905,725 · -2.9%
- By 2075
- 834,037 · -10.6%
- By 2100
- 708,033 · -24.1%
Race, ethnicity, and origin ACS 2023
- Neighborhood character
- Predominantly White (84%)
- Race & ethnicity
- White 84% Asian 5% Two or more races 4% Black 4% Hispanic / Latino 3%
- Common ancestry
- Romanian 12% Slovak 2% Lithuanian 2%
- Foreign-born
- 7% · Canada, Vietnam, India
- Languages at home
- 92% English-only · Other Indo-European 3% French/Haitian/Cajun 1% Arabic 1%
Political lean MEDSL · Erie
- 2024 margin
- Lean D (+9.7) · D 54.8% · R 45.2%
- 2008→2024 swing
- -7.9pp toward R · 2008: 17.5pp · 2024: 9.7pp
- All cycles
- 2024: D+9.7 2020: D+14.7 2016: D+4.8 2012: D+15.6 2008: D+17.5
Not yet ingested
- Civics
- —
Market trends
- HPI YoY
- ▼ -245.18%
- Current HPI
- 320.9379
- Rent YoY
- —
- Metro
- Buffalo-Cheektowaga, NY
- State GDP YoY
- ▲ 2.60%
- F500 in state
- 92
Industry mix (Fortune 500 HQ in NY)
| Industry | F500 HQs | Revenue |
|---|---|---|
| Financial Services | 10 | $950B |
|
||
| Consumer Goods | 9 | $162B |
|
||
| Insurance | 4 | $225B |
|
||
| Telecommunications | 2 | $144B |
|
||
| Pharmaceuticals | 2 | $112B |
|
||
| Media / Entertainment | 2 | $69B |
|
||
Price history
1 event — show timeline
- 2026-06-10 Listed $249,900 WNYREIS
Property tax history
+14.1%/yrLatest (2025): $4,216 · +2.1% YoY. Source: county tax records.
Cash-flow waterfall
monthlySold comps — $/sqft
last 12 mo · ≤1 miLoading sold comps…