5565 Bennetts Pasture Rd · Suffolk, VA
Flood risk 1/10 · Minimal
- FEMA flood zone
- X (unshaded)
- Chance of flooding over 30 yrs
- 0.0%
- Est. flood insurance / yr
- $507 – $1,088
Fire risk 2/10 · Minimal
- Est. fire insurance / yr
- $666 – $1,236
Heat risk 9/10 · Severe
- Hot days now (above 106°F)
- 7 days/yr
- Hot days in 30 yrs
- 16 days/yr
Wind risk 8/10 · Major
- Chance of severe wind over 30 yrs
- 80.0%
Air-quality risk 2/10 · Minimal
- Unhealthy air days now
- 1 days/yr
- Unhealthy air days in 30 yrs
- 1 days/yr
Risk factors via First Street. Map © Google.
Why this score? — see what drove the D+ grade
The composite is a weighted blend of 9 inputs, each scored 0–100. Each bar is that input's sub-score; the figure is the points it added to the 100-point composite (weight × sub-score).
- ARV discount +15.0/15.0
- Cash flow +10.9/30.0
- Rent growth +5.0/5.0
- Schools +4.8/10.0
- Livability +3.9/5.0
- DSCR +3.2/10.0
- 1% rule +2.7/10.0
- Condition / age +2.5/5.0
- Appreciation +0.0/10.0
$409,900
🖨 Deal sheet 📄 Offer letter ✓ Due diligence
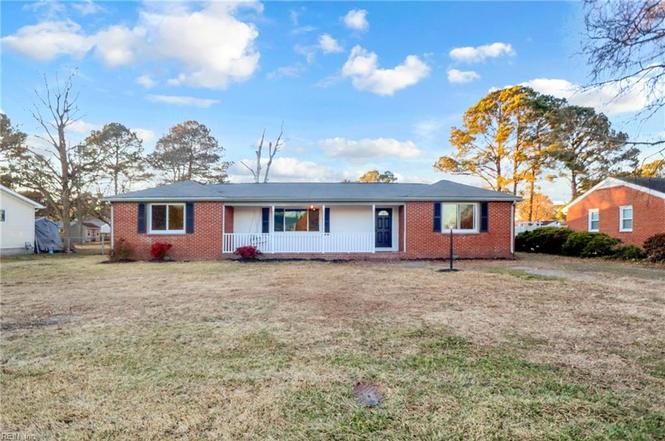
Listing remarks
Did someone say brick house??? Stop here at this completely renovated brick ranch! Premium finishes and exceptional craftsmanship show in every square inch of this property. Immerse yourself in this huge eat-in kitchen and dining room with ample space for entertainment and hosting, and four large bedrooms with new flooring throughout. Don't forget to check out the huge backyard and privacy this home has to offer. Stop here first!
Key facts
- Huge eat-in kitchen
- Huge backyard
- Completely renovated
Tags
Property features AI
Finance
- HOA & community: No HOA fees specified
Exterior
- Parking: Off-street parking for 4 vehicles; Driveway parking
- Utilities: City/County water; City/County sewer; Gas water heater
- Home design: Detached ranch-style home; Single-story; Crawl foundation; Entry level: 1
- Construction: Asphalt shingle roof
- Exterior features: Brick siding; Wood fence
Interior
- Kitchen: Dishwasher; Disposal; Microwave; Electric range; Refrigerator
- Bedrooms: First-floor master bedroom (ensuite)
- Flooring: Laminate
- Bathrooms: 2 full bathrooms
- Heating & cooling: Central air conditioning; Forced hot air heating (natural gas)
- Interior features: Walk-in closet; Laminate flooring
- Laundry & utility: Washer and dryer; Washer and dryer hookups; Utility closet
Neighborhood map
What this means for you Summary
Snapshot
- This is a 4-bed/2.0-bath single-family listed at $410k.
Deal economics
- At list price, monthly cash flow is $-177 ($-2k/yr) — negative.
- To cash-flow at today's rent, offer at most $379k (7.6% below list).
- To meet the 1% rule (rent ≥ 1% of price), the offer needs to be $315k (23.2% below list).
- Recommended offer: $315k (23.2% below list) — sets the bar for 1% rule.
- Cap rate 5.8% vs local median 3.5% in Suffolk — top-decile yield for the area; either an underpriced asset or a hidden risk that comps aren't pricing in. Stress-test before assuming the spread holds.
Location & tenants
- Location reads 77/100 on livability (#88 in VA, #2,896 nationally) — a middle-class / working-renter tenant base. Strengths: housing A+, health & safety A+, employment A-; Watch: crime C-, commute F.
- Suffolk City Public School District (suburban): math 41% / reading 69% proficiency, ranked #72 of 131 in VA (top 55%) — acceptable for families but not a draw, mixed tenant base, ~2y average lease.
- Zoned schools: Florence Bowser Elementary (math 52% / reading 75%, grade B, #460 of 1,108 statewide, top 42%, 831 students, 64% FRL); Nansemond River High (math 44% / reading 87%, grade B, #204 of 319 statewide, top 65%, 1,698 students, 64% FRL) — zoned schools average 64% FRL vs 39% district-wide (25 pts higher); higher-poverty schools than district average — tighter screening recommended.
- Market conditions: Rents rising fast (+10.6%/yr); 507 active listings in the ZIP; 3 comparable units currently listed for rent nearby; rentals leasing fast (median 11d on market — plan ~1-2 weeks tenant-placement turnaround); high-income renter base; 680 units permitted in Suffolk city in 2024 (0 in 5+ unit buildings).
- This rent runs 34% of the median local income ($112k/yr) — at the standard rent-burdened threshold; future hikes will face affordability resistance.
Forward outlook
- Local home prices are declining (-3.0%/yr); year-one equity from $3k of loan paydown is wiped out by about $12k of value loss. Plan a longer hold.
- Suffolk County population projected at +11% by 2050 — modest demand growth; plan on rents tracking national, not racing it.
Negotiation context
- It's been on market 110 days — a 9% lower offer ($373k) is reasonable based on typical stale-listing flexibility.
- 9 sale attempts since 9y ago; this cycle's ask has dropped $40k (9%) from the opening price — seller is motivated, your offer sets the floor, not the list.
- Current owner paid $294k; 39% above their basis — modest negotiation headroom, anchor on the comps not their cost.
Risks & watch-outs
- Watch-outs: built in 1957 — expect roof / HVAC / electrical / plumbing capex.
- Climate carrying-cost: severe wind risk, 80% chance of damaging wind over 30y; extreme-heat days projected 7→16/yr by 2055 (HVAC capex compounding) — expect insurance premiums to compound above CPI over the hold.
Questions for the listing agent
- What do current leases actually rent for vs. the listed asking? Can we see a recent rent roll and the last 12 months of T-12 income?
- It's been on market 110 days. Have you received any prior offers? Is the seller open to a 23% concession, seller financing, or rate buy-down credit?
- Built in 1957 — when were the roof, HVAC, electrical panel, plumbing, and water heater last replaced?
- Why hasn't it sold? Are there any deal-killer items the seller is aware of (foundation, flood, title, zoning, code violations)?
- Is there a deadline driving the sale (1031 exchange, divorce, estate, relocation)? That informs how much negotiation room exists.
- Schools are A-rated — typically a magnet for longer-tenancy family renters. What's the average tenant stay here, and is there a school-zone premium baked into asking?
- The area grade is low — what's the realistic commute time and amenity access for the typical tenant pool here? Any planned neighborhood developments (good or bad) we should know about?
- What's the average days-on-market for RENTAL listings here right now (not sales)? A rising rental-DOM trend means longer vacancies and softer asking-rent achievability than the comps imply.
- What's the recent tenant-quality profile in this submarket — average credit score on applications, eviction rate, late-payment / NSF rate, and stable-employment percentage? A property-management company in the area should have these aggregated.
- How much new for-sale + rental construction is in the pipeline within 1–3 miles? Heavy new supply typically softens prices + rents 12–24 months out; constrained supply supports both.
Investment metrics
- 1% rule
- 0.77% ✗
- Cap rate
- 5.77%
- Cash-on-cash
- -1.85%
- DSCR
- 0.92
- GRM
- 10.8
CMA / ARV
- ARV (on-the-fly)
- $598,288
- Comps found
- 2
Show comp detail 2 sales within ~0.75 mi
| Address | Dist | Beds/Ba | Sqft | Sold | Price | $/sf | Match |
|---|---|---|---|---|---|---|---|
| 5565 Bennetts Pasture Rd | 0.00mi | 4/2.0 | 2,452 (0%) | 1mo | $425,000 | $173 | 99 |
| 2917 Ames Cove Dr | 0.62mi | 4/2.5 | 2,135 (-13%) | 2mo | $520,000 | $244 | 46 |
Match score weights: distance 35% · size 25% · config 20% · recency 20%. Top-matched comps best support the ARV.
Projected returns pro-forma
-3.0% appreciation · 8.0% rent growth · sell at horizon
- IRR
- -14.3%
- Equity multiple
- 0.47×
- Total profit
- $-61,131
- Equity at exit
- $61,117
- IRR
- 0.8%
- Equity multiple
- 1.07×
- Total profit
- $7,753
- Equity at exit
- $35,441
Cash invested: $114,772 (down + closing). Projections, not guarantees.
Landlord ↔ Tenant lean methodology
- Overall (STATE)
- 55 Moderately Landlord-Leaning
- State Virginia
- 55 Moderately Landlord-Leaning · D+2
- County
- — inherits STATE
- City
- — inherits STATE
ZIP-level market 23435
- Rents YoY
- 10.6%
- Active inventory
- 507
- Price-to-rent
- 10.8×
Monthly cashflow live
- Estimated rent
- $3,150 medium interval (Pro) →
- Mortgage (P&I)
- −$2,150
- Tax from tax record
- −$345 /mo · $4,143/yr
- Insurance
- −$171
- HOA
- −$0
- Vacancy / Maint / Mgmt
- −$661
- Net cashflow
- $-177
Break-even live
UW: 25.0% down · 7.5% · 30yr · 1.5% tax · 5.0% vac · 8.0% maint · 8.0% mgmt
Financing live
Cash to close
- Down payment
- $102,475
- Closing costs
- $12,297
- Reserves months
- —
- Total cash needed
- —
Loan-product check · same deal, 3 products live
Conventional
25% down · 7.5% · 30yr
- Down + closing
- —
- Monthly P&I
- —
- Monthly cashflow
- —
- DSCR
- —
- Eligible?
- —
Personal DTI + credit; lowest rate.
DSCR
20% down · 8.5% · 30yr
- Down + closing
- —
- Monthly P&I
- —
- Monthly cashflow
- —
- DSCR
- —
- Eligible?
- —
No personal income docs; deal must DSCR.
Hard money
10% down · 12.0% · 12mo
- Down + closing
- —
- Monthly P&I
- —
- Monthly cashflow
- —
- DSCR
- —
- Eligible?
- —
Short-term bridge; refi at stabilization.
Rent comps 3 comps
| Address | Beds | Baths | Sqft | Rent | $/sqft | DOM | Units | Dist |
|---|---|---|---|---|---|---|---|---|
| 3418 Raintree Cir Suffolk, VA | 4.0 | 3.0 | 2680 | $3,495 | $1.30 | 23d | 1 | 0.96mi |
| 2207 Tuliptree Cir Suffolk, VA | 4.0 | 2.5 | 2313 | $2,900 | $1.25 | 11d | 1 | 1.29mi |
| 1005 Serene Rd #103 Suffolk, VA | 4.0 | 3.5 | 2071 | $2,900 | $1.40 | 4d | 1 | 1.38mi |
Listing history 45 events
-
2026-05-06status Under Contract
-
2026-04-21historical Active Under Contract
-
2026-04-06price $409,900
-
2026-03-02price $424,900
-
2026-02-16price $429,900
-
2026-02-06price $435,000
-
2026-01-16$449,900 Active
-
2022-08-21price $2,300
-
2021-10-20historical
-
2021-10-01status Active
-
2021-09-10historical Active Under Contract
-
2021-09-02price $325,000
-
2021-08-30price $330,000
-
2021-08-23$340,000 Active
-
2020-07-13soldstatus $294,000
-
2020-06-11status Under Contract
-
2020-05-23historical Active Under Contract
-
2020-05-12$294,000 Active
-
2018-11-16soldstatus $229,000
-
2018-08-31status Under Contract
-
2018-07-20price $234,900
-
2018-07-11price $237,500
-
2018-05-12$239,000 Active
-
2018-05-11historical
-
2018-04-12price $240,000
-
2018-03-27price $241,300
-
2018-03-20price $241,400
-
2018-03-02price $241,500
-
2018-02-16price $242,000
-
2018-02-09$243,000 Active
-
2018-02-07historical
-
2017-10-16price $244,000
-
2017-09-07price $245,000
-
2017-08-22status Active
-
2017-08-18historical
-
2017-08-10price $249,000
-
2017-07-28$250,000 Active
-
2017-07-27historical
-
2017-07-06price $249,500
-
2017-05-22price $250,000
-
2017-05-10price $257,000
-
2017-04-24price $259,000
-
2017-04-10price $264,500
-
2017-03-31price $269,500
-
2017-03-30$239,500 Active
ⓘ Source: listings_history table (triggers on properties + properties_extension) + one-shot
backfill from property_details.listing_events for pre-trigger history.
Tax reassessment forecast VA · Resets to sale price
- Current annual tax
- $4,143 · $345/mo
- Projected year-2 tax
- $4,143 · $345/mo
- Expected delta
- $0/yr ($0/mo · 0.0%)
ⓘ Screening estimate from a state-policy table — verify with the county assessor before closing.
Climate risk First Street
- Flood 1/10 Low FEMA zone X (unshaded) · 0% chance over 30 yrs
- Wildfire 2/10 Low
- Heat 9/10 Extreme 7 d/yr ≥106°F today · 16 d/yr by 30 yrs out
- Wind 8/10 Severe 80% chance of damaging wind over 30 yrs
- Air quality 2/10 Low 1 unhealthy d/yr today · 1 by 30 yrs out
Nearby sold comps map
Loading sold comps map…
Walkable amenities ~0.75 mi
Loading nearby amenities…
Taxation est. · year 1
- Rental income
- $37,795
- − Mortgage interest
- −$22,961
- − Property taxes
- −$4,143
- − Insurance
- −$2,050
- − Repairs & maintenance
- −$3,024
- − Management
- −$3,024
- − Depreciation
- −$11,924
- Taxable loss
- −$9,330
- Est. tax savings @ 24.0%
- +$2,239
- After-tax cash flow
- $110/yr
For passive investors: Depreciation is non-cash, so a rental often shows a tax loss while cash-flowing — sheltering income. Rental losses are passive: they offset passive income freely, and up to $25,000/yr can offset ordinary (W-2) income if you actively participate and your MAGI is under $100k (phasing out to $0 by $150k); unused losses carry forward. On sale, claimed depreciation is recaptured at up to 25%, and gains may owe capital-gains tax (a 1031 exchange can defer both). Figures are a year-1 estimate at your 24.0% rate — not tax advice; consult a CPA.
Schools (NCES district)
- District
- Suffolk City Public School District
- NCES district ID
- 5103710
- Math proficiency
- 41% ▼ -43.00%
- Reading proficiency
- 69% ▼ -8.00%
- Median HH income
- $65,573
- Composite
- 48.31/100
- National rank
- #2151
- State rank
- #72 of 131 in VA
Livability — Suffolk
- Score
- 77/100
- State rank
- #88
- US rank
- #2896
Category grades
Schools grade is shown separately in the Schools card above.
Census & demographics
- Census place
- Suffolk, VA
- County
- Suffolk City · 88,108 people
- City population
- 88,108
- Metro
- Virginia Beach-Norfolk-Newport News, VA-NC
- Population (ZIP)
- 33,721
- Household income
- $111,700
- Rent vs Own
- Severe rent burden
- 1074.0
Population outlook (Suffolk County) Hauer SSP2
- Today (2025)
- 95,269 people
- By 2030
- 98,269 · +3.1%
- By 2040
- 103,177 · +8.3%
- By 2050
- 105,777 · +11.0%
- By 2075
- 110,963 · +16.5%
- By 2100
- 103,711 · +8.9%
Race, ethnicity, and origin ACS 2023
- Neighborhood character
- Diverse neighborhood (Simpson 0.64)
- Race & ethnicity
- White 47% Black 36% Two or more races 9% Hispanic / Latino 6% Asian 4%
- Hispanic origin (detail)
- Mexican 2% Puerto Rican 2%
- Common ancestry
- Romanian 2% Italian 2% Slovak 1%
- Foreign-born
- 6% · Canada, Vietnam, China
- Languages at home
- 91% English-only · Spanish 4% Chinese 1% German/W. Germanic 1%
Political lean MEDSL · Suffolk
- 2024 margin
- D (+15.9) · D 57.4% · R 41.5% · Other 1.2%
- 2008→2024 swing
- +2.7pp toward D · 2008: 13.2pp · 2024: 15.9pp
- All cycles
- 2024: D+15.9 2020: D+17.3 2016: D+13.8 2012: D+15.1 2008: D+13.2
Not yet ingested
- Civics
- —
Market trends
- HPI YoY
- ▼ -155.93%
- Current HPI
- 162.3775
- Rent YoY
- ▲ 10.61%
- Metro
- Virginia Beach-Norfolk-Newport News, VA-NC
- State GDP YoY
- ▲ 2.40%
- F500 in state
- 50
Industry mix (Fortune 500 HQ in VA)
| Industry | F500 HQs | Revenue |
|---|---|---|
| Aerospace / Defense | 4 | $236B |
|
||
| Technology / Defense | 3 | $32B |
|
||
| Financial Services | 2 | $176B |
|
||
| Utilities | 2 | $27B |
|
||
| Insurance | 2 | $25B |
|
||
| Technology | 2 | $15B |
|
||
Price history
+71.1% since first listed45 events — show timeline
- 2026-05-06 Pending — REINMLS
- 2026-04-21 Contingent — REINMLS
- 2026-04-06 Price Changed $409,900 REINMLS
- 2026-03-02 Price Changed $424,900 REINMLS
- 2026-02-16 Price Changed $429,900 REINMLS
- 2026-02-06 Price Changed $435,000 REINMLS
- 2026-01-16 Listed $449,900 REINMLS
- 2022-08-21 Price Changed $2,300 RENT.
- 2021-10-20 Listing Removed — REINMLS
- 2021-10-01 Relisted — REINMLS
- 2021-09-10 Contingent — REINMLS
- 2021-09-02 Price Changed $325,000 REINMLS
- 2021-08-30 Price Changed $330,000 REINMLS
- 2021-08-23 Listed $340,000 REINMLS
- 2020-07-13 Sold (Public Records) $294,000 Public Records
- 2020-06-11 Pending — REINMLS
- 2020-05-23 Contingent — REINMLS
- 2020-05-12 Listed $294,000 REINMLS
- 2018-11-16 Sold (Public Records) $229,000 Public Records
- 2018-08-31 Pending — REINMLS
- 2018-07-20 Price Changed $234,900 REINMLS
- 2018-07-11 Price Changed $237,500 REINMLS
- 2018-05-12 Listed $239,000 REINMLS
- 2018-05-11 Listing Removed — REINMLS
- 2018-04-12 Price Changed $240,000 REINMLS
- 2018-03-27 Price Changed $241,300 REINMLS
- 2018-03-20 Price Changed $241,400 REINMLS
- 2018-03-02 Price Changed $241,500 REINMLS
- 2018-02-16 Price Changed $242,000 REINMLS
- 2018-02-09 Listed $243,000 REINMLS
- 2018-02-07 Listing Removed — REINMLS
- 2017-10-16 Price Changed $244,000 REINMLS
- 2017-09-07 Price Changed $245,000 REINMLS
- 2017-08-22 Relisted — REINMLS
- 2017-08-18 Listing Removed — REINMLS
- 2017-08-10 Price Changed $249,000 REINMLS
- 2017-07-28 Listed $250,000 REINMLS
- 2017-07-27 Listing Removed — REINMLS
- 2017-07-06 Price Changed $249,500 REINMLS
- 2017-05-22 Price Changed $250,000 REINMLS
- 2017-05-10 Price Changed $257,000 REINMLS
- 2017-04-24 Price Changed $259,000 REINMLS
- 2017-04-10 Price Changed $264,500 REINMLS
- 2017-03-31 Price Changed $269,500 REINMLS
- 2017-03-30 Listed $239,500 REINMLS
Property tax history
+5.5%/yrLatest (2025): $4,143 · +3.2% YoY. Source: county tax records.
Cash-flow waterfall
monthlySold comps — $/sqft
last 12 mo · ≤1 miLoading sold comps…