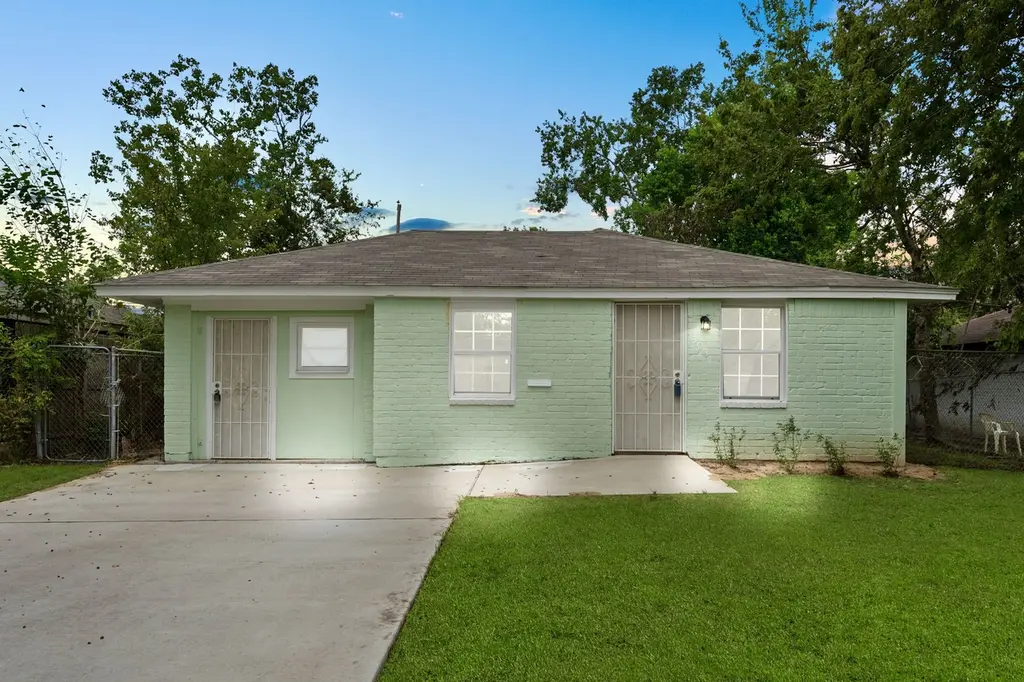
3031 Friar Point Rd · Houston, TX
Flood risk No data
- FEMA flood zone
- —
- Chance of flooding over 30 yrs
- —
- Est. flood insurance / yr
- —
Fire risk No data
- Est. fire insurance / yr
- —
Heat risk No data
- Hot days now (above threshold)
- —
- Hot days in 30 yrs
- —
Wind risk No data
- Chance of severe wind over 30 yrs
- —
Air-quality risk No data
- Unhealthy air days now
- —
- Unhealthy air days in 30 yrs
- —
Risk factors via First Street. Map © Google.
Why this score? — see what drove the C grade
The composite is a weighted blend of 9 inputs, each scored 0–100. Each bar is that input's sub-score; the figure is the points it added to the 100-point composite (weight × sub-score).
- Cash flow +18.1/30.0
- Appreciation +10.0/10.0
- 1% rule +5.7/10.0
- DSCR +5.7/10.0
- ARV discount +5.7/15.0
- Rent growth +3.7/5.0
- Livability +3.7/5.0
- Schools +2.7/10.0
- Condition / age +2.5/5.0
$179,900
🖨 Deal sheet 📄 Offer letter ✓ Due diligence
Listing remarks MLS
Welcome home to 3031 Friar Point Road! This property offers a strong investment opportunity with a steady rental income of $1,550 per month, providing immediate cash flow from day one. The home is well-maintained, minimizing downtime and upfront costs for incoming investors. This gorgeous home features four bedrooms and multiple full bathrooms, providing ample space and modern comfort. The kitchen boasts sleek white cabinets, offering a fresh and contemporary look, while the dining room provides a stylish space for meals. The living room, along with the rest of the house, showcases elegant tile flooring, adding a touch of sophistication and ease of maintenance throughout the entire home. Don't forget to step out back for a view of the backyard. You don't want to miss all this gorgeous home has to offer! Check out the 3D tour and schedule your showing today! Property is currently leased.
Key facts
- 6,050 sq ft lot
- Built 1955
- Listed 124 days
Neighborhood map
What this means for you Summary
Snapshot
- This is a 3-bed/1.0-bath single-family listed at $180k.
Deal economics
- At list price, monthly cash flow is $159 ($2k/yr) — positive.
- The deal already cash-flows at list — no discount required.
- Meets the 1% rule at list price ($2k rent vs $180k).
- Recommended offer: $158k (12.0% below list) — sets the bar for market timing.
- Cap rate 7.4% vs local median 3.2% in Houston — top-decile yield for the area; either an underpriced asset or a hidden risk that comps aren't pricing in. Stress-test before assuming the spread holds.
Location & tenants
- Location reads 74/100 on livability (#184 in TX, #4,771 nationally) — a middle-class / working-renter tenant base. Strengths: amenities A+, cost of living A+, housing A+; Watch: schools D, crime F.
- Houston ISD (urban): math 27% / reading 35% proficiency, ranked #593 of 826 in TX (top 72%) — families likely to look elsewhere, expect single-tenant / working-renter base with shorter leases; 71% free/reduced lunch — lower-income household profile, screen leases tightly.
- Market conditions: Rents rising fast (+4.8%/yr); 312 active listings in the ZIP; 24 comparable units currently listed for rent nearby; rentals at typical pace (median 16d on market — plan ~3-4 weeks tenant-placement turnaround); lower-income renter base — watch delinquency; 29,883 units permitted in Harris County in 2024 (8,621 in 5+ unit buildings).
- At $1,929/mo this rent would consume 62% of the median local household income ($37k/yr) (locally 1446% of renters already pay >50% of income on rent) — very limited rent-growth headroom before tenants either downsize or default.
Forward outlook
- In year one you build about $19k of equity ($1k loan paydown + $18k appreciation (10.0% local appreciation)).
- Harris County population projected at +47% by 2050 — long-run rental-demand tailwind backs the buy-and-hold thesis.
- At projected returns (10.0% appreciation + 4.8% rent growth), your $50k cash investment doubles in ~3 years — after that, you're playing with house money.
- By year 2, paydown + projected appreciation supports a ~$31k cash-out refi (75% LTV) — recoverable capital for the next deal without selling this one.
Negotiation context
- It's been on market 125 days — a 12% lower offer ($158k) is reasonable based on typical stale-listing flexibility.
- 16 sale attempts since 16y ago; this cycle's ask is 11506% above the opening price — seller raised mid-cycle; expect resistance to lowballs.
Risks & watch-outs
- Watch-outs: built in 1955 — expect roof / HVAC / electrical / plumbing capex.
Questions for the listing agent
- It's been on market 125 days. Have you received any prior offers? Is the seller open to a 12% concession, seller financing, or rate buy-down credit?
- Built in 1955 — when were the roof, HVAC, electrical panel, plumbing, and water heater last replaced?
- Why hasn't it sold? Are there any deal-killer items the seller is aware of (foundation, flood, title, zoning, code violations)?
- Is there a deadline driving the sale (1031 exchange, divorce, estate, relocation)? That informs how much negotiation room exists.
- Schools are D-rated, which usually means shorter tenancies and higher turnover. Who's the typical renter profile here, and what's been the actual vacancy rate?
- Crime grade is F in this area — have there been break-ins, vandalism, or insurance claims at this property in the last 3 years? What carrier currently insures it and at what premium?
- What's the average days-on-market for RENTAL listings here right now (not sales)? A rising rental-DOM trend means longer vacancies and softer asking-rent achievability than the comps imply.
- What's the recent tenant-quality profile in this submarket — average credit score on applications, eviction rate, late-payment / NSF rate, and stable-employment percentage? A property-management company in the area should have these aggregated.
- How much new for-sale + rental construction is in the pipeline within 1–3 miles? Heavy new supply typically softens prices + rents 12–24 months out; constrained supply supports both.
Investment metrics
- 1% rule
- 1.07% ✓
- Cap rate
- 7.35%
- Cash-on-cash
- 3.78%
- DSCR
- 1.17
- GRM
- 7.8
CMA / ARV
- ARV (median comp)
- $173,069
- List price
- $179,900
- Delta
- 3.95%
- Verdict
- FAIR
- Comps
- 20 within 1.0 mi
Show comp detail 12 sales within ~0.75 mi
| Address | Dist | Beds/Ba | Sqft | Sold | Price | $/sf | Match |
|---|---|---|---|---|---|---|---|
| 2818 Milton Lodge Ln | 0.57mi | 3/2.5 | 1,384 (+3%) | 2mo | $279,990 | $202 | 61 |
| 2614 Afton Heights Way | 0.60mi | 3/2.5 | 1,384 (+3%) | 1mo | $279,990 | $202 | 61 |
| 10204 Penryn Forest Trl | 0.61mi | 3/2.5 | 1,384 (+3%) | 1mo | $284,990 | $206 | 60 |
| 3018 Elpyco St | 0.30mi | 4/2.0 (+1) | 1,215 (-10%) | 1mo | $187,000 | $154 | 60 |
| 3034 Corksie St | 0.52mi | 3/2.0 | 1,225 (-9%) | 0mo | $219,900 | $180 | 57 |
| 10818 Carlton Dr | 0.69mi | 3/1.0 | 1,246 (-7%) | 2mo | $175,999 | $141 | 54 |
| 11416 Lucky Falls Dr | 0.69mi | 3/2.5 | 1,404 (+4%) | 2mo | $291,388 | $208 | 53 |
| 10322 Penryn Forest Trl | 0.54mi | 3/2.5 | 1,486 (+11%) | 2mo | $304,990 | $205 | 50 |
| 11018 Long Gate | 0.75mi | 3/1.5 | 1,242 (-8%) | 2mo | $130,000 | $105 | 49 |
| 10014 Sierra Dr | 0.64mi | 4/2.0 (+1) | 1,243 (-8%) | 2mo | $185,000 | $149 | 47 |
| 10208 Penryn Forest Trl | 0.60mi | 3/2.5 | 1,486 (+11%) | 2mo | $299,990 | $202 | 47 |
| 10316 Largent Hollow Trl | 0.65mi | 3/2.5 | 1,486 (+11%) | 1mo | $306,990 | $207 | 46 |
Match score weights: distance 35% · size 25% · config 20% · recency 20%. Top-matched comps best support the ARV.
Projected returns pro-forma
10.0% appreciation · 4.77% rent growth · sell at horizon
- IRR
- 27.8%
- Equity multiple
- 3.22×
- Total profit
- $111,690
- Equity at exit
- $162,068
- IRR
- 24.8%
- Equity multiple
- 7.53×
- Total profit
- $328,786
- Equity at exit
- $349,506
Cash invested: $50,372 (down + closing). Projections, not guarantees.
Landlord ↔ Tenant lean methodology
- Overall (STATE)
- 87 Strongly Landlord-Friendly
- State Texas
- 87 Strongly Landlord-Friendly · R+5
- County
- — inherits STATE
- City
- — inherits STATE
ZIP-level market 77051
- Home prices YoY
- 9.7%
- Rents YoY
- 4.8%
- Active inventory
- 312
- Price-to-rent
- 7.8×
Monthly cashflow live
- Estimated rent
- $1,929 high interval (Pro) →
- Mortgage (P&I)
- −$943
- Tax from tax record
- −$347 /mo · $4,162/yr
- Insurance
- −$75
- HOA
- −$0
- Vacancy / Maint / Mgmt
- −$405
- Net cashflow
- $159
Break-even live
UW: 25.0% down · 7.5% · 30yr · 1.5% tax · 5.0% vac · 8.0% maint · 8.0% mgmt
Financing live
Cash to close
- Down payment
- $44,975
- Closing costs
- $5,397
- Reserves months
- —
- Total cash needed
- —
Loan-product check · same deal, 3 products live
Conventional
25% down · 7.5% · 30yr
- Down + closing
- —
- Monthly P&I
- —
- Monthly cashflow
- —
- DSCR
- —
- Eligible?
- —
Personal DTI + credit; lowest rate.
DSCR
20% down · 8.5% · 30yr
- Down + closing
- —
- Monthly P&I
- —
- Monthly cashflow
- —
- DSCR
- —
- Eligible?
- —
No personal income docs; deal must DSCR.
Hard money
10% down · 12.0% · 12mo
- Down + closing
- —
- Monthly P&I
- —
- Monthly cashflow
- —
- DSCR
- —
- Eligible?
- —
Short-term bridge; refi at stabilization.
Rent comps 24 comps
| Address | Beds | Baths | Sqft | Rent | $/sqft | DOM | Units | Dist |
|---|---|---|---|---|---|---|---|---|
| 2937 Amherst Meadow Ln Houston, TX | 3.0 | 2.5 | 1820 | $2,450 | $1.35 | 22d | 1 | 0.29mi |
| 2937 Amherst Meadow Ln Unit NA Houston, TX | 3.0 | 2.5 | 1820 | $2,400 | $1.32 | 5d | 1 | 0.29mi |
| 10510 Cathedral Dr Houston, TX | 3.0 | 1.0 | 887 | $1,300 | $1.47 | 44d | 1 | 0.38mi |
| 10514 Wellesley Terrace Trl Houston, TX | 3.0 | 3.0 | 1843 | $2,300 | $1.25 | 18d | 1 | 0.40mi |
| 10415 Lancaster Ln Houston, TX | 3.0–4.0 | 2.5 | 1937 | $2,525 | $1.30 | 21d | 1 | 0.49mi |
| 9606 Ashville Dr Unit B Houston, TX | 3.0 | 2.0 | 1610 | $1,570 | $0.98 | 44d | 1 | 0.86mi |
| 9610 Buffum St Houston, TX | 3.0 | 3.0 | 1605 | $1,799 | $1.12 | 44d | 1 | 0.89mi |
| 2910 Reed Rd Houston, TX | 1.0–3.0 | 1.0–2.0 | 967 | $1,280 | $1.32 | 2d | 5 | 1.12mi |
| 11819 Leitrim Way Houston, TX | 3.0 | 1.0 | 1476 | $1,150 | $0.78 | 5d | 1 | 1.14mi |
| 11800 City Park Central Ln Unit 11857 Houston, TX | 2.0 | 2.0 | 885 | $1,362 | $1.54 | 44d | 1 | 1.24mi |
| 11800 City Park Central Ln Unit 2174 Houston, TX | 2.0 | 2.0 | 885 | $1,314 | $1.48 | 11d | 1 | 1.24mi |
| 11800 City Park Central Ln Apt 422 Houston, TX | 2.0 | 2.0 | 885 | $1,290 | $1.46 | 8d | 1 | 1.24mi |
| 11800 City Park Central Ln Unit 2162 Houston, TX | 2.0 | 2.0 | 885 | $1,290 | $1.46 | 5d | 1 | 1.24mi |
| 11800 City Park Central Ln Unit 425 Houston, TX | 2.0 | 2.0 | 885 | $1,282 | $1.45 | 3d | 1 | 1.24mi |
| 11806 City Park Central Ln Houston, TX | 2.0 | 2.0 | 1107 | $1,636 | $1.48 | 16d | 1 | 1.24mi |
| 11806 City Park Central Ln Houston, TX | 2.0 | 2.0 | 1107 | $1,636 | $1.48 | 44d | 1 | 1.24mi |
| 11900 Oakmoor Pkwy Houston, TX | 1.0–3.0 | 1.0–2.0 | 892 | $1,469 | $1.65 | 3d | 12 | 1.33mi |
| 2889 Reed Rd Houston, TX | 1.0–2.0 | 1.0–2.0 | 997 | $1,648 | $1.65 | 3d | 2 | 1.36mi |
| 2725 Reed Rd Houston, TX | 1.0–3.0 | 1.0–2.5 | 911 | $975 | $1.07 | 44d | 1 | 1.36mi |
| 3020 Gunnersbury Dr Houston, TX | 4.0 | 2.0 | 1670 | $1,499 | $0.90 | 15d | 1 | 1.37mi |
| 11900 City Park Central Ln Houston, TX | 1.0–2.0 | 1.0–2.0 | 877 | $1,726 | $1.97 | 2d | 23 | 1.39mi |
| 4015 Marchant Rd Houston, TX | 3.0 | 2.0 | 1200 | $1,700 | $1.42 | 44d | 1 | 1.39mi |
| 2920 Stamford Hill Ln Houston, TX | 3.0 | 2.0 | 1690 | $2,200 | $1.30 | 44d | 1 | 1.43mi |
| 11915 Sanspereil Dr Houston, TX | 3.0 | 2.0 | 1308 | $1,695 | $1.30 | 3d | 1 | 1.49mi |
Listing history 50 events
-
2026-06-18days on market $179,900 Active 125 DOM
-
2026-06-17days on market $179,900 Active 124 DOM
-
2026-06-16days on market $179,900 Active 123 DOM
-
2026-06-15days on market $179,900 Active 122 DOM
-
2026-06-13days on market $179,900 Active 120 DOM
-
2026-06-10days on market $179,900 Active 116 DOM
-
2026-06-08days on market $179,900 Active 115 DOM
-
2026-06-07days on market $179,900 Active 114 DOM
-
2026-06-04days on market $179,900 Active 111 DOM
-
2026-06-01days on market $179,900 Active 108 DOM
-
2026-05-31days on market $179,900 Active 107 DOM
-
2026-03-30status Active 900-char remark
Show marketing remark (900 chars)
Welcome home to 3031 Friar Point Road! This property offers a strong investment opportunity with a steady rental income of $1,550 per month, providing immediate cash flow from day one. The home is well-maintained, minimizing downtime and upfront costs for incoming investors. This gorgeous home features four bedrooms and multiple full bathrooms, providing ample space and modern comfort. The kitchen boasts sleek white cabinets, offering a fresh and contemporary look, while the dining room provides a stylish space for meals. The living room, along with the rest of the house, showcases elegant tile flooring, adding a touch of sophistication and ease of maintenance throughout the entire home. Don't forget to step out back for a view of the backyard. You don't want to miss all this gorgeous home has to offer! Check out the 3D tour and schedule your showing today! Property is currently leased.
-
2026-03-27historical $1,550
Show marketing remark (900 chars)
Welcome home to 3031 Friar Point Road! This property offers a strong investment opportunity with a steady rental income of $1,550 per month, providing immediate cash flow from day one. The home is well-maintained, minimizing downtime and upfront costs for incoming investors. This gorgeous home features four bedrooms and multiple full bathrooms, providing ample space and modern comfort. The kitchen boasts sleek white cabinets, offering a fresh and contemporary look, while the dining room provides a stylish space for meals. The living room, along with the rest of the house, showcases elegant tile flooring, adding a touch of sophistication and ease of maintenance throughout the entire home. Don't forget to step out back for a view of the backyard. You don't want to miss all this gorgeous home has to offer! Check out the 3D tour and schedule your showing today! Property is currently leased.
-
2026-03-27historical 900-char remark
Show marketing remark (900 chars)
Welcome home to 3031 Friar Point Road! This property offers a strong investment opportunity with a steady rental income of $1,550 per month, providing immediate cash flow from day one. The home is well-maintained, minimizing downtime and upfront costs for incoming investors. This gorgeous home features four bedrooms and multiple full bathrooms, providing ample space and modern comfort. The kitchen boasts sleek white cabinets, offering a fresh and contemporary look, while the dining room provides a stylish space for meals. The living room, along with the rest of the house, showcases elegant tile flooring, adding a touch of sophistication and ease of maintenance throughout the entire home. Don't forget to step out back for a view of the backyard. You don't want to miss all this gorgeous home has to offer! Check out the 3D tour and schedule your showing today! Property is currently leased.
-
2026-02-26$1,550
-
2026-02-10$179,900 Active 900-char remark
Show marketing remark (900 chars)
Welcome home to 3031 Friar Point Road! This property offers a strong investment opportunity with a steady rental income of $1,550 per month, providing immediate cash flow from day one. The home is well-maintained, minimizing downtime and upfront costs for incoming investors. This gorgeous home features four bedrooms and multiple full bathrooms, providing ample space and modern comfort. The kitchen boasts sleek white cabinets, offering a fresh and contemporary look, while the dining room provides a stylish space for meals. The living room, along with the rest of the house, showcases elegant tile flooring, adding a touch of sophistication and ease of maintenance throughout the entire home. Don't forget to step out back for a view of the backyard. You don't want to miss all this gorgeous home has to offer! Check out the 3D tour and schedule your showing today! Property is currently leased.
-
2026-02-10historical
Show marketing remark (900 chars)
Welcome home to 3031 Friar Point Road! This property offers a strong investment opportunity with a steady rental income of $1,550 per month, providing immediate cash flow from day one. The home is well-maintained, minimizing downtime and upfront costs for incoming investors. This gorgeous home features four bedrooms and multiple full bathrooms, providing ample space and modern comfort. The kitchen boasts sleek white cabinets, offering a fresh and contemporary look, while the dining room provides a stylish space for meals. The living room, along with the rest of the house, showcases elegant tile flooring, adding a touch of sophistication and ease of maintenance throughout the entire home. Don't forget to step out back for a view of the backyard. You don't want to miss all this gorgeous home has to offer! Check out the 3D tour and schedule your showing today! Property is currently leased.
-
2025-12-13$179,900 Active
-
2025-03-09historical $1,550
-
2025-02-28historical
-
2025-02-20$1,550
-
2025-02-20historical $1,650
-
2025-02-19$200,000 Active
-
2025-02-19historical
-
2024-10-31$1,650
-
2024-10-17price $200,000
-
2024-09-10$210,000 Active
-
2023-01-26historical
-
2022-10-07$230,000 Active
-
2022-03-04soldstatus
-
2022-03-02soldstatus Sold
-
2022-02-10status Pending
-
2022-02-08$100,000 Active
-
2015-09-08soldstatus
-
2015-09-05status Pending
-
2015-09-04soldstatus Sold
-
2015-08-25status Option Pending
-
2015-08-13$50,000 Active
-
2015-05-07historical
-
2015-04-18$57,000 Active
-
2015-04-10historical
-
2015-03-06price $64,500
-
2014-12-20$68,500 Active
-
2013-09-28status Option Pending
-
2013-09-03soldstatus
-
2013-08-28soldstatus Sold
-
2013-07-19$38,000 Active
-
2011-10-03historical
-
2011-07-16$37,000
-
2010-07-20soldstatus
ⓘ Source: listings_history table (triggers on properties + properties_extension) + one-shot
backfill from property_details.listing_events for pre-trigger history.
Tax reassessment forecast TX · Resets to sale price
- Current annual tax
- $4,162 · $347/mo
- Projected year-2 tax
- $4,162 · $347/mo
- Expected delta
- $0/yr ($0/mo · 0.0%)
ⓘ Screening estimate from a state-policy table — verify with the county assessor before closing.
Nearby sold comps map
Loading sold comps map…
Walkable amenities ~0.75 mi
Loading nearby amenities…
Taxation est. · year 1
- Rental income
- $23,149
- − Mortgage interest
- −$10,077
- − Property taxes
- −$4,162
- − Insurance
- −$900
- − Repairs & maintenance
- −$1,852
- − Management
- −$1,852
- − Depreciation
- −$5,233
- Taxable loss
- −$927
- Est. tax savings @ 24.0%
- +$223
- After-tax cash flow
- $2,128/yr
For passive investors: Depreciation is non-cash, so a rental often shows a tax loss while cash-flowing — sheltering income. Rental losses are passive: they offset passive income freely, and up to $25,000/yr can offset ordinary (W-2) income if you actively participate and your MAGI is under $100k (phasing out to $0 by $150k); unused losses carry forward. On sale, claimed depreciation is recaptured at up to 25%, and gains may owe capital-gains tax (a 1031 exchange can defer both). Figures are a year-1 estimate at your 24.0% rate — not tax advice; consult a CPA.
Schools (NCES district)
- District
- Houston ISD
- NCES district ID
- 4823640
- Math proficiency
- 27% ▼ -18.00%
- Reading proficiency
- 35% ▼ -6.00%
- Median HH income
- $46,054
- Composite
- 26.63/100
- National rank
- #7173
- State rank
- #593 of 826 in TX
Livability — Houston
- Score
- 74/100
- State rank
- #184
- US rank
- #4771
Category grades
Schools grade is shown separately in the Schools card above.
Census & demographics
- Census place
- Houston, TX
- County
- Harris County · 4,702,590 people
- City population
- 3,226,434
- Metro
- Houston-The Woodlands-Sugar Land, TX
- Population (ZIP)
- 19,795
- Household income
- $37,415
- Rent vs Own
- Severe rent burden
- 1446.0
Population outlook (Harris County) Hauer SSP2
- Today (2025)
- 5,571,493 people
- By 2030
- 6,089,821 · +9.3%
- By 2040
- 7,142,806 · +28.2%
- By 2050
- 8,185,864 · +46.9%
- By 2075
- 10,574,329 · +89.8%
- By 2100
- 12,109,958 · +117.4%
Race, ethnicity, and origin ACS 2023
- Neighborhood character
- Predominantly Black (77%)
- Race & ethnicity
- Black 77% Hispanic / Latino 16% Two or more races 11% White 3%
- Hispanic origin (detail)
- Mexican 6% Puerto Rican 1%
- Foreign-born
- 8% · Canada, China
- Languages at home
- 88% English-only · Spanish 10%
Political lean MEDSL · Harris
- 2024 margin
- Lean D (+5.5) · D 52.0% · R 46.4% · Other 1.6%
- 2008→2024 swing
- +3.9pp toward D · 2008: 1.6pp · 2024: 5.5pp
- All cycles
- 2024: D+5.5 2020: D+13.3 2016: D+12.4 2012: D+0.1 2008: D+1.6
Not yet ingested
- Civics
- —
Market trends
- HPI YoY
- ▲ 16.02%
- Current HPI
- 180.4283
- Rent YoY
- ▲ 4.77%
- Metro
- Houston-The Woodlands-Sugar Land, TX
- State GDP YoY
- ▲ 3.95%
- F500 in state
- 110
Industry mix (Fortune 500 HQ in TX)
| Industry | F500 HQs | Revenue |
|---|---|---|
| Energy | 16 | $1,198B |
|
||
| Technology | 5 | $198B |
|
||
| Engineering / Construction | 4 | $72B |
|
||
| Energy Services | 3 | $60B |
|
||
| Utilities | 3 | $41B |
|
||
| Healthcare | 2 | $330B |
|
||
Price history
-94.5% since first listed44 events — show timeline
- 2026-03-30 Relisted — HARMLS
- 2026-03-27 Rental Removed $1,550 HARMLS
- 2026-03-27 Listing Removed — HARMLS
- 2026-02-26 Listed for Rent $1,550 HARMLS
- 2026-02-10 Listing Removed — HARMLS
- 2026-02-10 Listed $179,900 HARMLS
- 2025-12-13 Listed $179,900 HARMLS
- 2025-03-09 Rental Removed $1,550 HARMLS
- 2025-02-28 Listing Removed — HARMLS
- 2025-02-20 Listed for Rent $1,550 HARMLS
- 2025-02-20 Rental Removed $1,650 HARMLS
- 2025-02-19 Listing Removed — HARMLS
- 2025-02-19 Listed $200,000 HARMLS
- 2024-10-31 Listed for Rent $1,650 HARMLS
- 2024-10-17 Price Changed $200,000 HARMLS
- 2024-09-10 Listed $210,000 HARMLS
- 2023-01-26 Listing Removed — HARMLS
- 2022-10-07 Listed $230,000 HARMLS
- 2022-03-04 Sold (Public Records) — Public Records
- 2022-03-02 Sold (MLS) — HARMLS
- 2022-02-10 Pending — HARMLS
- 2022-02-08 Listed $100,000 HARMLS
- 2015-09-08 Sold (Public Records) — Public Records
- 2015-09-05 Pending — HARMLS
- 2015-09-04 Sold (MLS) — HARMLS
- 2015-08-25 Pending — HARMLS
- 2015-08-13 Listed $50,000 HARMLS
- 2015-05-07 Listing Removed — HARMLS
- 2015-04-18 Listed $57,000 HARMLS
- 2015-04-10 Listing Removed — HARMLS
- 2015-03-06 Price Changed $64,500 HARMLS
- 2014-12-20 Listed $68,500 HARMLS
- 2013-09-28 Pending — HARMLS
- 2013-09-03 Sold (Public Records) — Public Records
- 2013-08-28 Sold (MLS) — HARMLS
- 2013-07-19 Listed $38,000 HARMLS
- 2011-10-03 Listing Removed — HARMLS
- 2011-07-16 Listed $37,000 HARMLS
- 2010-07-20 Sold (MLS) — HARMLS
- 2010-06-21 Listing Removed — HARMLS
- 2010-05-24 Listed $28,000 HARMLS
- 2005-01-18 Sold (Public Records) — Public Records
- 2004-07-14 Sold (Public Records) — Public Records
- 2004-06-02 Sold (Public Records) — Public Records
Property tax history
+5.4%/yrLatest (2025): $4,162 · +18.4% YoY. Source: county tax records.
Cash-flow waterfall
monthlySold comps — $/sqft
last 12 mo · ≤1 miLoading sold comps…