529 SW Alfalfa Ave #1 · Lake City, FL
Flood risk 1/10 · Minimal
- FEMA flood zone
- X (unshaded)
- Chance of flooding over 30 yrs
- 0.0%
- Est. flood insurance / yr
- $507 – $1,088
Fire risk 9/10 · Severe
- Est. fire insurance / yr
- $947 – $1,759
Heat risk 8/10 · Major
- Hot days now (above 108°F)
- 7 days/yr
- Hot days in 30 yrs
- 18 days/yr
Wind risk 9/10 · Severe
- Chance of severe wind over 30 yrs
- 99.0%
Air-quality risk 4/10 · Minor
- Unhealthy air days now
- 4 days/yr
- Unhealthy air days in 30 yrs
- 6 days/yr
Risk factors via First Street. Map © Google.
Why this score? — see what drove the A- grade
The composite is a weighted blend of 9 inputs, each scored 0–100. Each bar is that input's sub-score; the figure is the points it added to the 100-point composite (weight × sub-score).
- Cash flow +27.9/30.0
- ARV discount +15.0/15.0
- Appreciation +10.0/10.0
- DSCR +9.9/10.0
- 1% rule +7.7/10.0
- Schools +4.5/10.0
- Livability +3.7/5.0
- Rent growth +2.5/5.0
- Condition / age +2.5/5.0
$145,000
🖨 Deal sheet 📄 Offer letter ✓ Due diligence
Listing remarks
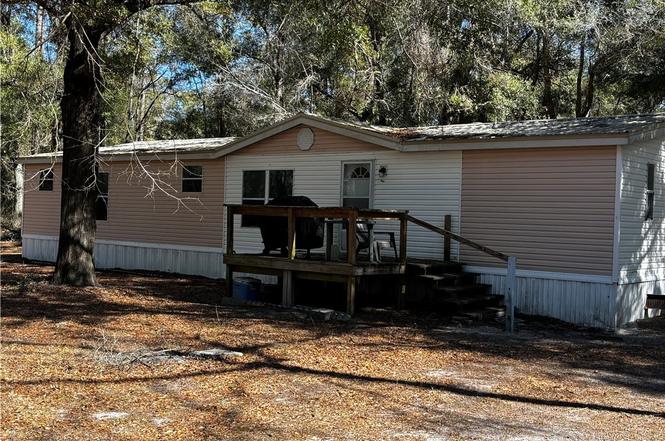
3-bedroom, 2-bath manufactured home located on 4.02 acres of gently rolling land in a quiet rural setting. The property offers open, usable acreage with mature trees and wide open space, providing privacy and room for a variety of uses. The home features approximately 1,620 square feet of living space with a functional layout, central air conditioning, and a metal roof. The split-bedroom floor plan offers separation between the primary suite and secondary bedrooms. The kitchen and living areas provide comfortable space for daily living. The home needs some repairs and updating but offers excellent potential for buyers looking to add their own personal touches. The acreage allows room for ga
Key facts
- Metal roof
- Gently rolling land
- Wide open space
Tags
Property features AI
Finance
- Other: Zoning: A1; Lot size: 4.02 acres
Exterior
- Parking: Paved driveway; Unpaved parking
- Utilities: Private well water; Septic tank
- Home design: Manufactured home (double wide); Single-story
- Construction: Asphalt shingle roof
- Exterior features: Wooded lot; Shed(s)
Interior
- Kitchen: Electric oven; Electric range; Range hood; Refrigerator
- Flooring: Carpet; Linoleum
- Bathrooms: 2 full bathrooms
- Heating & cooling: Central air conditioning (electric)
- Interior features: Breakfast bar; Eat-in kitchen; Laminate countertops; Open floor plan; Walk-in closet(s); Blinds and window treatments
Neighborhood map
What this means for you Summary
Snapshot
- This is a 3-bed/2.0-bath manufactured listed at $145k.
Deal economics
- At list price, monthly cash flow is $447 ($5k/yr) — positive.
- The deal already cash-flows at list — no discount required.
- Meets the 1% rule at list price ($2k rent vs $145k).
- Recommended offer: $128k (12.0% below list) — sets the bar for market timing.
- Cap rate 10.0% vs local median 3.7% in Lake City — top-decile yield for the area; either an underpriced asset or a hidden risk that comps aren't pricing in. Stress-test before assuming the spread holds.
Location & tenants
- Location reads 73/100 on livability (#304 in FL) — a middle-class / working-renter tenant base. Strengths: cost of living A+, housing A+, health & safety A+; Watch: amenities C-, commute F, employment F.
- Columbia (town): math 53% / reading 54% proficiency, ranked #25 of 73 in FL (top 34%) — acceptable for families but not a draw, mixed tenant base, ~2y average lease.
- Market conditions: 206 active listings in the ZIP; 178 units permitted in Columbia County in 2024 (0 in 5+ unit buildings).
Forward outlook
- In year one you build about $16k of equity ($1k loan paydown + $14k appreciation (10.0% local appreciation)).
- Columbia County population projected to shrink 7% by 2050 — rents likely to lag national; underwrite the cash flow, not the appreciation.
- At projected returns (10.0% appreciation + 3.0% rent growth), your $41k cash investment doubles in ~2 years — after that, you're playing with house money.
- By year 3, paydown + projected appreciation supports a ~$39k cash-out refi (75% LTV) — recoverable capital for the next deal without selling this one.
Negotiation context
- It's been on market 132 days — a 12% lower offer ($128k) is reasonable based on typical stale-listing flexibility.
Risks & watch-outs
- Climate carrying-cost: severe wind risk, 99% chance of damaging wind over 30y; severe wildfire risk; extreme-heat days projected 7→18/yr by 2055 (HVAC capex compounding) — expect insurance premiums to compound above CPI over the hold.
Questions for the listing agent
- It's been on market 132 days. Have you received any prior offers? Is the seller open to a 12% concession, seller financing, or rate buy-down credit?
- Why hasn't it sold? Are there any deal-killer items the seller is aware of (foundation, flood, title, zoning, code violations)?
- Is there a deadline driving the sale (1031 exchange, divorce, estate, relocation)? That informs how much negotiation room exists.
- Schools are B-rated — typically a magnet for longer-tenancy family renters. What's the average tenant stay here, and is there a school-zone premium baked into asking?
- What's the average days-on-market for RENTAL listings here right now (not sales)? A rising rental-DOM trend means longer vacancies and softer asking-rent achievability than the comps imply.
- What's the recent tenant-quality profile in this submarket — average credit score on applications, eviction rate, late-payment / NSF rate, and stable-employment percentage? A property-management company in the area should have these aggregated.
- How much new for-sale + rental construction is in the pipeline within 1–3 miles? Heavy new supply typically softens prices + rents 12–24 months out; constrained supply supports both.
Investment metrics
- 1% rule
- 1.27% ✓
- Cap rate
- 10.00%
- Cash-on-cash
- 13.22%
- DSCR
- 1.59
- GRM
- 6.6
CMA / ARV
- ARV (on-the-fly)
- $202,500
- Comps found
- 1
Show comp detail 1 sale within ~0.75 mi
| Address | Dist | Beds/Ba | Sqft | Sold | Price | $/sf | Match |
|---|---|---|---|---|---|---|---|
| 549 SW Quail Ridge Ct | 0.33mi | 3/2.0 | 1,512 (-7%) | 1mo | $189,000 | $125 | 72 |
Match score weights: distance 35% · size 25% · config 20% · recency 20%. Top-matched comps best support the ARV.
Projected returns pro-forma
10.0% appreciation · 3.0% rent growth · sell at horizon
- IRR
- 34.0%
- Equity multiple
- 3.65×
- Total profit
- $107,491
- Equity at exit
- $130,627
- IRR
- 29.3%
- Equity multiple
- 8.25×
- Total profit
- $294,192
- Equity at exit
- $281,703
Cash invested: $40,600 (down + closing). Projections, not guarantees.
Landlord ↔ Tenant lean methodology
- Overall (STATE)
- 87 Strongly Landlord-Friendly
- State Florida
- 87 Strongly Landlord-Friendly · R+3
- County
- — inherits STATE
- City
- — inherits STATE
ZIP-level market 32024
- Home prices YoY
- 7.6%
- Active inventory
- 206
- Price-to-rent
- 6.6×
Monthly cashflow live
- Estimated rent
- $1,835 medium interval (Pro) →
- Mortgage (P&I)
- −$760
- Tax est. 1.5%
- −$181 /mo · $2,175/yr
- Insurance
- −$60
- HOA
- −$0
- Vacancy / Maint / Mgmt
- −$385
- Net cashflow
- $447
Break-even live
UW: 25.0% down · 7.5% · 30yr · 1.5% tax · 5.0% vac · 8.0% maint · 8.0% mgmt
Financing live
Cash to close
- Down payment
- $36,250
- Closing costs
- $4,350
- Reserves months
- —
- Total cash needed
- —
Loan-product check · same deal, 3 products live
Conventional
25% down · 7.5% · 30yr
- Down + closing
- —
- Monthly P&I
- —
- Monthly cashflow
- —
- DSCR
- —
- Eligible?
- —
Personal DTI + credit; lowest rate.
DSCR
20% down · 8.5% · 30yr
- Down + closing
- —
- Monthly P&I
- —
- Monthly cashflow
- —
- DSCR
- —
- Eligible?
- —
No personal income docs; deal must DSCR.
Hard money
10% down · 12.0% · 12mo
- Down + closing
- —
- Monthly P&I
- —
- Monthly cashflow
- —
- DSCR
- —
- Eligible?
- —
Short-term bridge; refi at stabilization.
Listing history 19 events
-
2026-06-19days on market $145,000 Active 132 DOM
-
2026-06-18days on market $145,000 Active 131 DOM
-
2026-06-17price $145,000 Active 130 DOM
-
2026-06-17days on market $160,000 Active 130 DOM
-
2026-06-16days on market $160,000 Active 129 DOM
-
2026-06-15days on market $160,000 Active 128 DOM
-
2026-06-14days on market $160,000 Active 126 DOM
-
2026-06-12days on market $160,000 Active 125 DOM
-
2026-06-09days on market $160,000 Active 122 DOM
-
2026-06-08days on market $160,000 Active 121 DOM
-
2026-06-07days on market $160,000 Active 120 DOM
-
2026-06-05days on market $160,000 Active 117 DOM
-
2026-06-03days on market $160,000 Active 116 DOM
-
2026-06-02days on market $160,000 Active 115 DOM
-
2026-06-01days on market $160,000 Active 114 DOM
-
2026-05-31days on market $160,000 Active 113 DOM
-
2026-05-30days on market $160,000 Active 112 DOM
-
2026-05-06price $160,000
-
2026-02-03$170,000 Active
ⓘ Source: listings_history table (triggers on properties + properties_extension) + one-shot
backfill from property_details.listing_events for pre-trigger history.
Climate risk First Street
- Flood 1/10 Low FEMA zone X (unshaded) · 0% chance over 30 yrs
- Wildfire 9/10 Extreme
- Heat 8/10 Severe 7 d/yr ≥108°F today · 18 d/yr by 30 yrs out
- Wind 9/10 Extreme 99% chance of damaging wind over 30 yrs
- Air quality 4/10 Moderate 4 unhealthy d/yr today · 6 by 30 yrs out
Nearby sold comps map
Loading sold comps map…
Walkable amenities ~0.75 mi
Loading nearby amenities…
Taxation est. · year 1
- Rental income
- $22,017
- − Mortgage interest
- −$8,122
- − Property taxes
- −$2,175
- − Insurance
- −$725
- − Repairs & maintenance
- −$1,761
- − Management
- −$1,761
- − Depreciation
- −$4,218
- Taxable income
- $3,253
- Est. tax owed @ 24.0%
- −$781
- After-tax cash flow
- $4,587/yr
For passive investors: Depreciation is non-cash, so a rental often shows a tax loss while cash-flowing — sheltering income. Rental losses are passive: they offset passive income freely, and up to $25,000/yr can offset ordinary (W-2) income if you actively participate and your MAGI is under $100k (phasing out to $0 by $150k); unused losses carry forward. On sale, claimed depreciation is recaptured at up to 25%, and gains may owe capital-gains tax (a 1031 exchange can defer both). Figures are a year-1 estimate at your 24.0% rate — not tax advice; consult a CPA.
Schools (NCES district)
- District
- Columbia
- NCES district ID
- 1200360
- Math proficiency
- 53% ▼ -10.00%
- Reading proficiency
- 54% ▼ -3.00%
- Median HH income
- $40,053
- Composite
- 44.74/100
- National rank
- #2750
- State rank
- #25 of 73 in FL
Livability — Lake City
- Score
- 73/100
- State rank
- #304
- US rank
- #5154
Category grades
Schools grade is shown separately in the Schools card above.
Census & demographics
- City population
- 40,507
- Population (ZIP)
- 20,644
Population outlook (Columbia County) Hauer SSP2
- Today (2025)
- 68,129 people
- By 2030
- 67,501 · -0.9%
- By 2040
- 65,465 · -3.9%
- By 2050
- 63,058 · -7.4%
- By 2075
- 56,291 · -17.4%
- By 2100
- 45,243 · -33.6%
Race, ethnicity, and origin ACS 2023
- Neighborhood character
- Predominantly White (78%)
- Race & ethnicity
- White 78% Hispanic / Latino 10% Two or more races 7% Black 6% Asian 2%
- Hispanic origin (detail)
- Mexican 2% Puerto Rican 3%
- Common ancestry
- Italian 2% Portuguese 1% Lithuanian 1%
- Foreign-born
- 5% · Canada, Jamaica
- Languages at home
- 91% English-only · Spanish 8% Vietnamese 1%
Political lean MEDSL · Columbia
- 2024 margin
- Solid R (+50.2) · D 24.6% · R 74.7%
- 2008→2024 swing
- -16.4pp toward R · 2008: -33.8pp · 2024: -50.2pp
- All cycles
- 2024: R+50.2 2020: R+45.2 2016: R+44.5 2012: R+36.7 2008: R+33.8
Not yet ingested
- Civics
- —
Market trends
- HPI YoY
- ▲ 19.05%
- Current HPI
- 269.4659
- Rent YoY
- —
- Metro
- —
- State GDP YoY
- ▲ 3.28%
- F500 in state
- 36
Industry mix (Fortune 500 HQ in FL)
| Industry | F500 HQs | Revenue |
|---|---|---|
| Industrial Technology | 2 | $29B |
|
||
| Insurance | 2 | $17B |
|
||
| Retail | 1 | $60B |
|
||
| Technology Distribution | 1 | $58B |
|
||
| Homebuilding | 1 | $35B |
|
||
| Technology Manufacturing | 1 | $35B |
|
||
Price history
-5.9% since first listed2 events — show timeline
- 2026-05-06 Price Changed $160,000 RACC
- 2026-02-03 Listed $170,000 RACC
Cash-flow waterfall
monthlySold comps — $/sqft
last 12 mo · ≤1 miLoading sold comps…