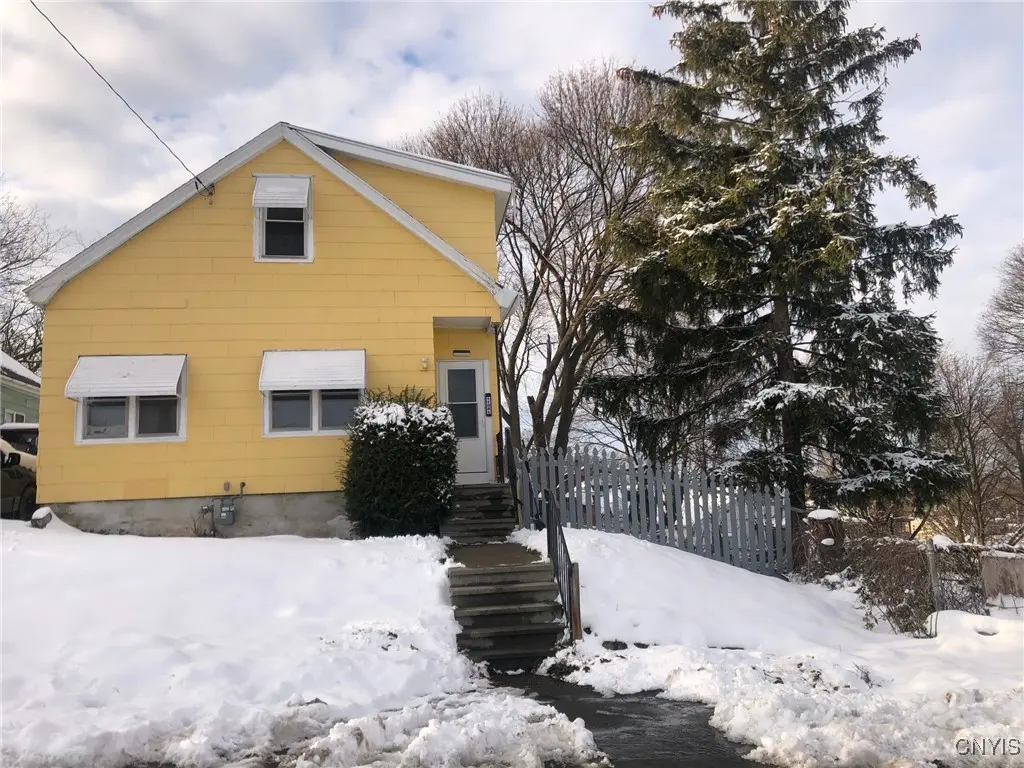
110 Spring Ln · Syracuse, NY
Flood risk 1/10 · Minimal
- FEMA flood zone
- X (unshaded)
- Chance of flooding over 30 yrs
- 0.0%
- Est. flood insurance / yr
- $473 – $860
Fire risk 1/10 · Minimal
- Est. fire insurance / yr
- $691 – $1,283
Heat risk 3/10 · Minor
- Hot days now (above 95°F)
- 7 days/yr
- Hot days in 30 yrs
- 15 days/yr
Wind risk 1/10 · Minimal
- Chance of severe wind over 30 yrs
- —
Air-quality risk 2/10 · Minimal
- Unhealthy air days now
- 0 days/yr
- Unhealthy air days in 30 yrs
- 1 days/yr
Risk factors via First Street. Map © Google.
Why this score? — see what drove the A- grade
The composite is a weighted blend of 9 inputs, each scored 0–100. Each bar is that input's sub-score; the figure is the points it added to the 100-point composite (weight × sub-score).
- Cash flow +30.0/30.0
- ARV discount +15.0/15.0
- DSCR +10.0/10.0
- Appreciation +10.0/10.0
- 1% rule +8.9/10.0
- Livability +3.9/5.0
- Rent growth +2.5/5.0
- Condition / age +2.5/5.0
- Schools +1.8/10.0
$138,500
🖨 Deal sheet 📄 Offer letter ✓ Due diligence
Listing remarks
This Move-In Ready 1830 Square Foot Home with 4 bedrooms and one full & half bathrooms. Located on a quiet dead end street with a view of the northern part of the City. All walls are freshly painted, with some hardwoods, cleaned Carpets, and some new vinyl flooring. There is Pleasant enclosed entrance Hallway to welcome you into the Living Areas. Plenty of windows in the Front Living and Dining Rooms make this home inviting even on cloudy days. A First floor Bedroom is off the Dining Room and close to the Remolded Bath Room. The Country Size Eat-in Kitchen is loaded with plenty of cabinets and includes a Stove and Refrigerator. The second floor offers three bedrooms: one master and t
Key facts
- Plenty of windows
- Move in ready
- Remodeled bath room
Tags
Neighborhood map
What this means for you Summary
Snapshot
- This is a 3-bed/1.5-bath single-family listed at $138k.
Deal economics
- At list price, monthly cash flow is $647 ($8k/yr) — positive.
- The deal already cash-flows at list — no discount required.
- Meets the 1% rule at list price ($2k rent vs $138k).
- Recommended offer: $130k (6.0% below list) — sets the bar for market timing.
- Cap rate 11.9% vs local median 8.2% in Syracuse — top-decile yield for the area; either an underpriced asset or a hidden risk that comps aren't pricing in. Stress-test before assuming the spread holds.
Location & tenants
- Location reads 77/100 on livability (#187 in NY, #2,869 nationally) — a middle-class / working-renter tenant base. Strengths: amenities A+, commute A+, cost of living A+; Watch: schools D+, crime F, employment D-.
- Syracuse City School District (urban): math 18% / reading 26% proficiency, ranked #590 of 590 in NY (top 100%) — low school quality limits family demand, transient renter base, plan for 1-2y turnover; 74% free/reduced lunch — lower-income household profile, screen leases tightly.
- Market conditions: 99 active listings in the ZIP; 14 comparable units currently listed for rent nearby; rentals lingering (median 44d on market — plan ~5-8 weeks vacancy on turnover, expect pricing pressure); 50% of comp listings sitting > 30 days — soft ceiling on asking rent; lower-income renter base — watch delinquency; 616 units permitted in Onondaga County in 2024 (256 in 5+ unit buildings).
- At $1,922/mo this rent would consume 52% of the median local household income ($45k/yr) (locally 1437% of renters already pay >50% of income on rent) — very limited rent-growth headroom before tenants either downsize or default.
Forward outlook
- In year one you build about $15k of equity ($958 loan paydown + $14k appreciation (10.0% local appreciation)).
- Onondaga County population projected to shrink 9% by 2050 — rents likely to lag national; underwrite the cash flow, not the appreciation.
- At projected returns (10.0% appreciation + 3.0% rent growth), your $39k cash investment doubles in ~2 years — after that, you're playing with house money.
- By year 3, paydown + projected appreciation supports a ~$37k cash-out refi (75% LTV) — recoverable capital for the next deal without selling this one.
Negotiation context
- It's been on market 81 days — a 6% lower offer ($130k) is reasonable based on typical stale-listing flexibility.
- Current owner paid $25k; list at $138k implies a 454% gain — meaningful room to come down on a strong offer.
Risks & watch-outs
- Watch-outs: built in 1900 — expect roof / HVAC / electrical / plumbing capex.
Questions for the listing agent
- It's been on market 81 days. Have you received any prior offers? Is the seller open to a 6% concession, seller financing, or rate buy-down credit?
- Built in 1900 — when were the roof, HVAC, electrical panel, plumbing, and water heater last replaced?
- Why hasn't it sold? Are there any deal-killer items the seller is aware of (foundation, flood, title, zoning, code violations)?
- Is there a deadline driving the sale (1031 exchange, divorce, estate, relocation)? That informs how much negotiation room exists.
- Schools are D-rated, which usually means shorter tenancies and higher turnover. Who's the typical renter profile here, and what's been the actual vacancy rate?
- Crime grade is F in this area — have there been break-ins, vandalism, or insurance claims at this property in the last 3 years? What carrier currently insures it and at what premium?
- What's the average days-on-market for RENTAL listings here right now (not sales)? A rising rental-DOM trend means longer vacancies and softer asking-rent achievability than the comps imply.
- What's the recent tenant-quality profile in this submarket — average credit score on applications, eviction rate, late-payment / NSF rate, and stable-employment percentage? A property-management company in the area should have these aggregated.
- How much new for-sale + rental construction is in the pipeline within 1–3 miles? Heavy new supply typically softens prices + rents 12–24 months out; constrained supply supports both.
Investment metrics
- 1% rule
- 1.39% ✓
- Cap rate
- 11.90%
- Cash-on-cash
- 20.02%
- DSCR
- 1.89
- GRM
- 6.0
CMA / ARV
- ARV (on-the-fly)
- $170,190
- Comps found
- 12
Show comp detail 12 sales within ~0.75 mi
| Address | Dist | Beds/Ba | Sqft | Sold | Price | $/sf | Match |
|---|---|---|---|---|---|---|---|
| 110 Spring Ln | 0.00mi | 4/1.5 (+1) | 1,830 (0%) | 3mo | $140,000 | $77 | 93 |
| 809 E Division St | 0.29mi | 3/3.0 | 1,884 (+3%) | 4mo | $160,000 | $85 | 73 |
| 1019 Highland St | 0.51mi | 3/1.0 | 1,830 (0%) | 8mo | $122,000 | $67 | 68 |
| 810 Turtle St | 0.46mi | 3/2.0 | 1,968 (+8%) | 3mo | $207,500 | $105 | 61 |
| 2331 Grant Blvd | 0.42mi | 3/1.5 | 1,697 (-7%) | 9mo | $195,900 | $115 | 61 |
| 117 Arnts Pl | 0.61mi | 4/1.5 (+1) | 1,872 (+2%) | 10mo | $250,000 | $134 | 55 |
| 2723 Grant Blvd | 0.45mi | 4/3.0 (+1) | 1,680 (-8%) | 2mo | $310,000 | $185 | 52 |
| 110 Lacy Pl | 0.50mi | 3/1.0 | 1,608 (-12%) | 3mo | $138,500 | $86 | 52 |
| 805 E E Division St St | 0.29mi | 4/1.0 (+1) | 1,608 (-12%) | 11mo | $90,000 | $56 | 50 |
| 155 7th North St | 0.66mi | 2/1.0 (-1) | 1,734 (-5%) | 11mo | $180,000 | $104 | 44 |
| 1625 Butternut St | 0.62mi | 4/2.0 (+1) | 1,623 (-11%) | 8mo | $151,000 | $93 | 39 |
| 707 Wolf St | 0.70mi | 4/1.0 (+1) | 1,562 (-15%) | 7mo | $55,000 | $35 | 30 |
Match score weights: distance 35% · size 25% · config 20% · recency 20%. Top-matched comps best support the ARV.
Projected returns pro-forma
10.0% appreciation · 3.0% rent growth · sell at horizon
- IRR
- 39.2%
- Equity multiple
- 4.01×
- Total profit
- $116,619
- Equity at exit
- $124,772
- IRR
- 33.8%
- Equity multiple
- 9.02×
- Total profit
- $310,966
- Equity at exit
- $269,075
Cash invested: $38,780 (down + closing). Projections, not guarantees.
Landlord ↔ Tenant lean methodology
- Overall (STATE)
- 15 Strongly Tenant-Friendly
- State New York
- 15 Strongly Tenant-Friendly · D+10
- County
- — inherits STATE
- City
- — inherits STATE
ZIP-level market 13208
- Home prices YoY
- 8.4%
- Active inventory
- 99
- Price-to-rent
- 6.0×
Monthly cashflow live
- Estimated rent
- $1,922 high interval (Pro) →
- Mortgage (P&I)
- −$726
- Tax from tax record
- −$87 /mo · $1,045/yr
- Insurance
- −$58
- HOA
- −$0
- Vacancy / Maint / Mgmt
- −$404
- Net cashflow
- $647
Break-even live
UW: 25.0% down · 7.5% · 30yr · 1.5% tax · 5.0% vac · 8.0% maint · 8.0% mgmt
Financing live
Cash to close
- Down payment
- $34,625
- Closing costs
- $4,155
- Reserves months
- —
- Total cash needed
- —
Loan-product check · same deal, 3 products live
Conventional
25% down · 7.5% · 30yr
- Down + closing
- —
- Monthly P&I
- —
- Monthly cashflow
- —
- DSCR
- —
- Eligible?
- —
Personal DTI + credit; lowest rate.
DSCR
20% down · 8.5% · 30yr
- Down + closing
- —
- Monthly P&I
- —
- Monthly cashflow
- —
- DSCR
- —
- Eligible?
- —
No personal income docs; deal must DSCR.
Hard money
10% down · 12.0% · 12mo
- Down + closing
- —
- Monthly P&I
- —
- Monthly cashflow
- —
- DSCR
- —
- Eligible?
- —
Short-term bridge; refi at stabilization.
Rent comps 14 comps
| Address | Beds | Baths | Sqft | Rent | $/sqft | DOM | Units | Dist |
|---|---|---|---|---|---|---|---|---|
| 746 E Laurel St Unit 1 Syracuse, NY | 4.0 | 2.0 | 1400 | $1,500 | $1.07 | 43d | 1 | 0.64mi |
| 712 Oak St Syracuse, NY | 3.0 | 1.0 | 2461 | $1,700 | $0.69 | 20d | 1 | 0.89mi |
| 244 Harding St #46 Syracuse, NY | 2.0 | 1.0 | 2200 | $1,395 | $0.63 | 43d | 1 | 1.01mi |
| 205A Hawley Ave Unit 211C Syracuse, NY | 3.0 | 2.5 | 1350 | $1,675 | $1.24 | 43d | 1 | 1.10mi |
| 205A Hawley Ave Unit 213C Syracuse, NY | 3.0 | 2.5 | 1350 | $1,650 | $1.22 | 43d | 1 | 1.10mi |
| 423 Wendell Ter Syracuse, NY | 4.0 | 1.0 | 1312 | $2,500 | $1.91 | 13d | 1 | 1.12mi |
| 324 W Water St Unit 106 Syracuse, NY | 2.0 | 1.0 | 1436 | $2,095 | $1.46 | 20d | 1 | 1.23mi |
| 447 E Washington St Syracuse, NY | 3.0 | 1.5 | 2095 | $2,100 | $1.00 | 13d | 1 | 1.31mi |
| 2340 Court St Syracuse, NY | 2.0 | 1.5 | 1965 | $2,200 | $1.12 | 13d | 1 | 1.33mi |
| 317 S Clinton St Unit 4A Syracuse, NY | 2.0 | 1.5 | 1500 | $2,100 | $1.40 | 13d | 1 | 1.37mi |
| 317 S Clinton St Unit 3A Syracuse, NY | 2.0 | 2.0 | 1500 | $2,100 | $1.40 | 43d | 1 | 1.37mi |
| 319 S Salina St Syracuse, NY | 2.0 | 2.0 | 1860 | $2,000 | $1.08 | 20d | 1 | 1.37mi |
| 321 S Salina St Unit 201 Syracuse, NY | 2.0 | 1.0 | 1446 | $2,450 | $1.69 | 43d | 1 | 1.38mi |
| 321 S Salina St Unit 501 Syracuse, NY | 2.0 | 1.0 | 1446 | $3,000 | $2.07 | 43d | 1 | 1.38mi |
Listing history 4 events
-
2026-02-25status Pending
-
2025-12-17historical Active Under Contract
-
2025-12-05$138,500 Active
-
2016-07-12soldstatus $25,000
ⓘ Source: listings_history table (triggers on properties + properties_extension) + one-shot
backfill from property_details.listing_events for pre-trigger history.
Tax reassessment forecast NY · Partial reset (capped growth)
- Current annual tax
- $1,045 · $87/mo
- Projected year-2 tax
- $1,693 · $141/mo
- Expected delta
- +$648/yr (+$54/mo · 62.0%)
ⓘ Screening estimate from a state-policy table — verify with the county assessor before closing.
Climate risk First Street
- Flood 1/10 Low FEMA zone X (unshaded) · 0% chance over 30 yrs
- Wildfire 1/10 Low
- Heat 3/10 Moderate 7 d/yr ≥95°F today · 15 d/yr by 30 yrs out
- Wind 1/10 Low
- Air quality 2/10 Low 0 unhealthy d/yr today · 1 by 30 yrs out
Nearby sold comps map
Loading sold comps map…
Walkable amenities ~0.75 mi
Loading nearby amenities…
Taxation est. · year 1
- Rental income
- $23,060
- − Mortgage interest
- −$7,758
- − Property taxes
- −$1,045
- − Insurance
- −$692
- − Repairs & maintenance
- −$1,845
- − Management
- −$1,845
- − Depreciation
- −$4,029
- Taxable income
- $5,846
- Est. tax owed @ 24.0%
- −$1,403
- After-tax cash flow
- $6,362/yr
For passive investors: Depreciation is non-cash, so a rental often shows a tax loss while cash-flowing — sheltering income. Rental losses are passive: they offset passive income freely, and up to $25,000/yr can offset ordinary (W-2) income if you actively participate and your MAGI is under $100k (phasing out to $0 by $150k); unused losses carry forward. On sale, claimed depreciation is recaptured at up to 25%, and gains may owe capital-gains tax (a 1031 exchange can defer both). Figures are a year-1 estimate at your 24.0% rate — not tax advice; consult a CPA.
Schools (NCES district)
- District
- Syracuse City School District
- NCES district ID
- 3628590
- Math proficiency
- 18% ▼ -5.00%
- Reading proficiency
- 26% ▬ 0.00%
- Median HH income
- $32,097
- Composite
- 17.83/100
- National rank
- #9007
- State rank
- #590 of 590 in NY
Livability — Syracuse
- Score
- 77/100
- State rank
- #187
- US rank
- #2869
Category grades
Schools grade is shown separately in the Schools card above.
Census & demographics
- Census place
- Syracuse, NY
- County
- Onondaga County · 247,257 people
- City population
- 152,627
- Metro
- Syracuse, NY
- Population (ZIP)
- 22,993
- Household income
- $44,712
- Rent vs Own
- Severe rent burden
- 1437.0
Population outlook (Onondaga County) Hauer SSP2
- Today (2025)
- 467,894 people
- By 2030
- 463,381 · -1.0%
- By 2040
- 447,697 · -4.3%
- By 2050
- 426,399 · -8.9%
- By 2075
- 373,661 · -20.1%
- By 2100
- 307,967 · -34.2%
Race, ethnicity, and origin ACS 2023
- Neighborhood character
- Highly diverse neighborhood (Simpson 0.70)
- Race & ethnicity
- White 46% Black 24% Asian 14% Two or more races 10% Hispanic / Latino 6%
- Hispanic origin (detail)
- Puerto Rican 4% Dominican 1%
- Common ancestry
- Romanian 3% Swedish 3% Italian 1%
- Foreign-born
- 22% · Vietnam, Philippines, Canada
- Languages at home
- 70% English-only · Spanish 6% Other Asian/Pacific 5% Vietnamese 4%
Political lean MEDSL · Onondaga
- 2024 margin
- D (+17.3) · D 58.6% · R 41.4%
- 2008→2024 swing
- -3.0pp toward R · 2008: 20.3pp · 2024: 17.3pp
- All cycles
- 2024: D+17.3 2020: D+20.6 2016: D+12.8 2012: D+21.1 2008: D+20.3
Not yet ingested
- Civics
- —
Market trends
- HPI YoY
- ▲ 30.91%
- Current HPI
- 399.3284
- Rent YoY
- —
- Metro
- Syracuse, NY
- State GDP YoY
- ▲ 2.60%
- F500 in state
- 92
Industry mix (Fortune 500 HQ in NY)
| Industry | F500 HQs | Revenue |
|---|---|---|
| Financial Services | 10 | $950B |
|
||
| Consumer Goods | 9 | $162B |
|
||
| Insurance | 4 | $225B |
|
||
| Telecommunications | 2 | $144B |
|
||
| Pharmaceuticals | 2 | $112B |
|
||
| Media / Entertainment | 2 | $69B |
|
||
Price history
+454.0% since first listed4 events — show timeline
- 2026-02-25 Pending — CNYIS
- 2025-12-17 Contingent — CNYIS
- 2025-12-05 Listed $138,500 CNYIS
- 2016-07-12 Sold (Public Records) $25,000 Public Records
Property tax history
-0.4%/yrLatest (2025): $1,045 · +0.0% YoY. Source: county tax records.
Cash-flow waterfall
monthlySold comps — $/sqft
last 12 mo · ≤1 miLoading sold comps…