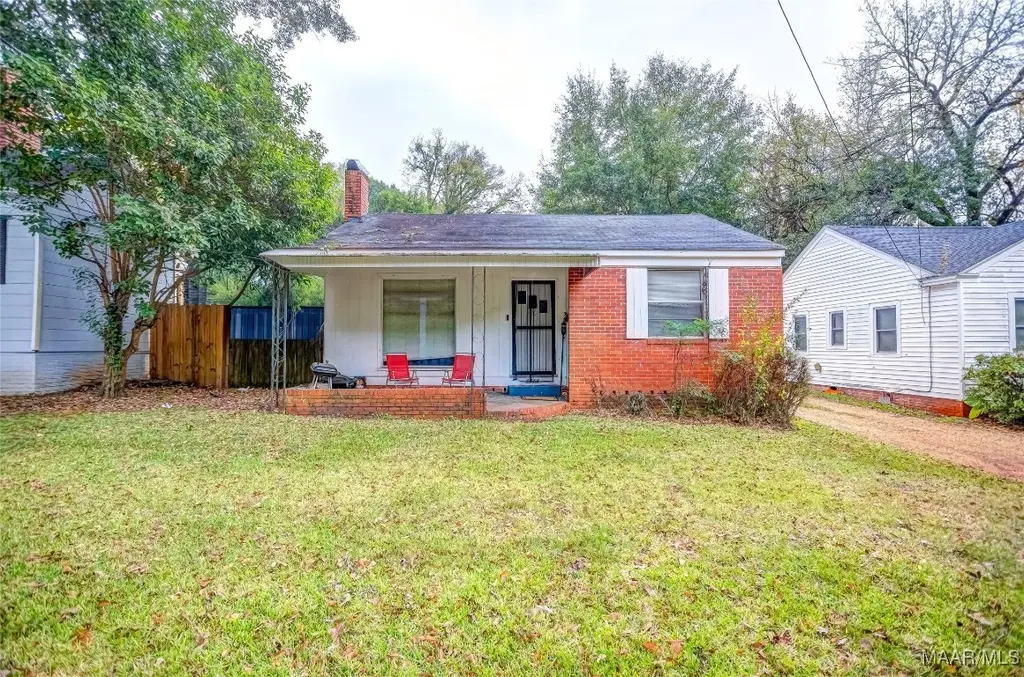
1514 Yancey Ave · Montgomery, AL
Flood risk 1/10 · Minimal
- FEMA flood zone
- X (unshaded)
- Chance of flooding over 30 yrs
- 0.0%
- Est. flood insurance / yr
- $507 – $1,088
Fire risk 3/10 · Minor
- Est. fire insurance / yr
- $916 – $1,700
Heat risk 7/10 · Major
- Hot days now (above 107°F)
- 6 days/yr
- Hot days in 30 yrs
- 18 days/yr
Wind risk 8/10 · Major
- Chance of severe wind over 30 yrs
- 80.0%
Air-quality risk 3/10 · Minor
- Unhealthy air days now
- 4 days/yr
- Unhealthy air days in 30 yrs
- 4 days/yr
Risk factors via First Street. Map © Google.
Why this score? — see what drove the C+ grade
The composite is a weighted blend of 9 inputs, each scored 0–100. Each bar is that input's sub-score; the figure is the points it added to the 100-point composite (weight × sub-score).
- Cash flow +30.0/30.0
- DSCR +10.0/10.0
- 1% rule +9.8/10.0
- Rent growth +3.8/5.0
- Livability +3.2/5.0
- ARV discount +2.6/15.0
- Condition / age +2.5/5.0
- Schools +1.7/10.0
- Appreciation +0.0/10.0
$61,900
🖨 Deal sheet (PDF) 📄 Offer letter ✓ Due diligence
Listing remarks MLS
Two bedroom, one bathroom charming Capitol Heights home located extremely convenient to downtown. This is a great investment opportunity with long term tenants in place and current on the rent. The home has been very well maintained and is under professional property management. Current monthly rent is $585.00. The owner wants to sell this property and the 1510 Yancey next door as a package deal but will consider selling them separately. Call me or your preferred realtor today with any questions or to schedule a tour.
Key facts
- 7,405 sq ft lot
- Parking
- Built 1945
Neighborhood map
What this means for you Summary
Snapshot
- This is a 2-bed/1.0-bath single-family listed at $62k.
Deal economics
- At list price, monthly cash flow is $328 ($4k/yr) — positive.
- The deal already cash-flows at list — no discount required.
- Meets the 1% rule at list price ($918 rent vs $62k).
- Recommended offer: $54k (12.0% below list) — sets the bar for market timing.
- Cap rate 12.7% vs local median 6.0% in Montgomery — top-decile yield for the area; either an underpriced asset or a hidden risk that comps aren't pricing in. Stress-test before assuming the spread holds.
Location & tenants
- Location reads 65/100 on livability (#138 in AL) — a middle-class / working-renter tenant base. Strengths: cost of living A+, housing A+; Watch: schools C-, employment D, crime F.
- Montgomery County (urban): math 9% / reading 31% proficiency, ranked #106 of 129 in AL (top 82%) — low school quality limits family demand, transient renter base, plan for 1-2y turnover; 70% free/reduced lunch — lower-income household profile, screen leases tightly.
- Market conditions: Rents rising fast (+5.0%/yr); 67 active listings in the ZIP; 37 comparable units currently listed for rent nearby; rentals lingering (median 44d on market — plan ~5-8 weeks vacancy on turnover, expect pricing pressure); 65% of comp listings sitting > 30 days — soft ceiling on asking rent; lower-income renter base — watch delinquency; 460 units permitted in Montgomery County in 2024 (37 in 5+ unit buildings).
- This rent runs 34% of the median local income ($32k/yr) — at the standard rent-burdened threshold; future hikes will face affordability resistance.
Forward outlook
- Local home prices are declining (-3.0%/yr); year-one equity from $428 of loan paydown is wiped out by about $2k of value loss. Plan a longer hold.
- Montgomery County population projected to shrink 8% by 2050 — rents likely to lag national; underwrite the cash flow, not the appreciation.
- At projected returns (-3.0% appreciation + 5.0% rent growth), your $17k cash investment doubles in ~5 years — after that, you're playing with house money.
Negotiation context
- It's been on market 210 days — a 12% lower offer ($54k) is reasonable based on typical stale-listing flexibility.
- 3 sale attempts since 28y ago; this cycle's ask has dropped $6k (9%) from the opening price — seller is motivated, your offer sets the floor, not the list.
- Current owner paid $46k; 35% above their basis — modest negotiation headroom, anchor on the comps not their cost.
Risks & watch-outs
- Watch-outs: built in 1945 — expect roof / HVAC / electrical / plumbing capex.
- Climate carrying-cost: severe wind risk, 80% chance of damaging wind over 30y; extreme-heat days projected 6→18/yr by 2055 (HVAC capex compounding) — expect insurance premiums to compound above CPI over the hold.
Questions for the listing agent
- It's been on market 210 days. Have you received any prior offers? Is the seller open to a 12% concession, seller financing, or rate buy-down credit?
- Built in 1945 — when were the roof, HVAC, electrical panel, plumbing, and water heater last replaced?
- Why hasn't it sold? Are there any deal-killer items the seller is aware of (foundation, flood, title, zoning, code violations)?
- Is there a deadline driving the sale (1031 exchange, divorce, estate, relocation)? That informs how much negotiation room exists.
- Crime grade is F in this area — have there been break-ins, vandalism, or insurance claims at this property in the last 3 years? What carrier currently insures it and at what premium?
- What's the average days-on-market for RENTAL listings here right now (not sales)? A rising rental-DOM trend means longer vacancies and softer asking-rent achievability than the comps imply.
- What's the recent tenant-quality profile in this submarket — average credit score on applications, eviction rate, late-payment / NSF rate, and stable-employment percentage? A property-management company in the area should have these aggregated.
- How much new for-sale + rental construction is in the pipeline within 1–3 miles? Heavy new supply typically softens prices + rents 12–24 months out; constrained supply supports both.
Investment metrics
- 1% rule
- 1.48% ✓
- Cap rate
- 12.65%
- Cash-on-cash
- 22.72%
- DSCR
- 2.01
- GRM
- 5.6
CMA / ARV
- ARV (median comp)
- $55,860
- List price
- $61,900
- Delta
- 10.81%
- Verdict
- OVERPRICED
- Comps
- 20 within 1.0 mi
Show comp detail 2 sales within ~0.75 mi
| Address | Dist | Beds/Ba | Sqft | Sold | Price | $/sf | Match |
|---|---|---|---|---|---|---|---|
| 1921 Marie James Ct | 0.58mi | 1/1.0 (-1) | 720 (-14%) | 7mo | $4,500 | $6 | 38 |
| 344 Arthur St | 0.68mi | 3/1.0 (+1) | 933 (+11%) | 22mo | $50,000 | $54 | 27 |
Match score weights: distance 35% · size 25% · config 20% · recency 20%. Top-matched comps best support the ARV.
Projected returns pro-forma
-3.0% appreciation · 5.05% rent growth · sell at horizon
- IRR
- 17.8%
- Equity multiple
- 1.74×
- Total profit
- $12,793
- Equity at exit
- $9,229
- IRR
- 27.6%
- Equity multiple
- 3.67×
- Total profit
- $46,299
- Equity at exit
- $5,352
Cash invested: $17,332 (down + closing). Projections, not guarantees.
Landlord ↔ Tenant lean methodology
- Overall (STATE)
- 90 Strongly Landlord-Friendly
- State Alabama
- 90 Strongly Landlord-Friendly · R+15
- County
- — inherits STATE
- City
- — inherits STATE
ZIP-level market 36107
- Home prices YoY
- -10.9%
- Rents YoY
- 5.0%
- Active inventory
- 67
- Price-to-rent
- 5.6×
Monthly cashflow live
- Estimated rent
- $918 high interval (Pro) →
- Mortgage (P&I)
- −$325
- Tax from tax record
- −$47 /mo · $565/yr
- Insurance
- −$26
- HOA
- −$0
- Vacancy / Maint / Mgmt
- −$193
- Net cashflow
- $328
Break-even live
Sensitivity live
| Price | -10% $363 | -5% $346 | +0% $328 | +5% $311 | +10% $293 |
|---|---|---|---|---|---|
| Rent | -10% $256 | -5% $292 | +0% $328 | +5% $364 | +10% $401 |
| Rate | -1.0pp $359 | -0.5pp $344 | base $328 | +0.5pp $312 | +1.0pp $296 |
UW: 25.0% down · 7.5% · 30yr · 1.5% tax · 5.0% vac · 8.0% maint · 8.0% mgmt
Financing live
Cash to close
- Down payment
- $15,475
- Closing costs
- $1,857
- Reserves months
- —
- Total cash needed
- —
Loan-product check · same deal, 3 products live
Conventional
25% down · 7.5% · 30yr
- Down + closing
- —
- Monthly P&I
- —
- Monthly cashflow
- —
- DSCR
- —
- Eligible?
- —
Personal DTI + credit; lowest rate.
DSCR
20% down · 8.5% · 30yr
- Down + closing
- —
- Monthly P&I
- —
- Monthly cashflow
- —
- DSCR
- —
- Eligible?
- —
No personal income docs; deal must DSCR.
Hard money
10% down · 12.0% · 12mo
- Down + closing
- —
- Monthly P&I
- —
- Monthly cashflow
- —
- DSCR
- —
- Eligible?
- —
Short-term bridge; refi at stabilization.
Rent comps 37 comps
| Address | Beds | Baths | Sqft | Rent | $/sqft | DOM | Units | Dist |
|---|---|---|---|---|---|---|---|---|
| 1510 Yancey Ave Unit B Montgomery, AL | 1.0 | 1.0 | 650 | $725 | $1.12 | 44d | 1 | 0.04mi |
| 116 N Lewis St Montgomery, AL | 1.0 | 1.0 | 690 | $875 | $1.27 | 44d | 1 | 0.15mi |
| 1530 Saint Charles Ave Unit B Montgomery, AL | 1.0 | 1.0 | 725 | $775 | $1.07 | 44d | 1 | 0.17mi |
| 1517 Madison Ave Montgomery, AL | 1.0 | 1.0 | 1044 | $650 | $0.62 | 44d | 1 | 0.23mi |
| 1517 Madison Ave Montgomery, AL | 1.0 | 1.0 | 1044 | $650 | $0.62 | 21d | 1 | 0.23mi |
| 1415 Madison Ave Apt E Montgomery, AL | 2.0 | 1.0 | 825 | $1,095 | $1.33 | 14d | 1 | 0.24mi |
| 424 N California St Apt D Montgomery, AL | 2.0 | 1.0 | 850 | $778 | $0.92 | 21d | 1 | 0.40mi |
| 1827 Capitol Ave Montgomery, AL | 2.0 | 1.0 | 1068 | $1,600 | $1.50 | 44d | 1 | 0.47mi |
| 1827 Capitol Ave Montgomery, AL | 2.0 | 1.0 | 1068 | $1,600 | $1.50 | 14d | 1 | 0.47mi |
| 517 N Florida St Unit B Montgomery, AL | 2.0 | 1.0 | 900 | $750 | $0.83 | 44d | 1 | 0.49mi |
| 2023 Windsor Ave Montgomery, AL | 2.0 | 1.0 | 889 | $895 | $1.01 | 44d | 1 | 0.55mi |
| 329 S Capitol Pkwy Apt A Montgomery, AL | 1.0 | 1.0 | 800 | $645 | $0.81 | 44d | 1 | 0.60mi |
| 2121 Winona Ave Unit 2123 Montgomery, AL | 1.0 | 1.5 | 828 | $995 | $1.20 | 14d | 1 | 0.64mi |
| 2122 Windsor Ave Montgomery, AL | 2.0 | 1.0 | 1052 | $725 | $0.69 | 44d | 1 | 0.65mi |
| 2229 Madison Ave Montgomery, AL | 2.0 | 1.0 | 1100 | $625 | $0.57 | 44d | 1 | 0.79mi |
| 2241 Saint Charles Ave Unit 2247 Montgomery, AL | 1.0 | 1.0 | 915 | $1,475 | $1.61 | 44d | 1 | 0.79mi |
| 1834 Highland Ave Unit A Montgomery, AL | 1.0 | 1.0 | 980 | $1,250 | $1.28 | 44d | 1 | 0.88mi |
| 2503 Skyline Ave Montgomery, AL | 3.0 | 1.0 | 1015 | $1,150 | $1.13 | 44d | 1 | 0.90mi |
| 2006 Harmon St Unit 3 Montgomery, AL | 3.0 | 1.0 | 800 | $500 | $0.62 | 44d | 1 | 0.94mi |
| 2405 Palmetto St Unit B Montgomery, AL | 1.0 | 1.0 | 550 | $750 | $1.36 | 14d | 1 | 0.97mi |
| 2000 Cherry St Montgomery, AL | 2.0 | 1.0 | 1106 | $950 | $0.86 | 44d | 1 | 1.05mi |
| 2302 Plum St Montgomery, AL | 1.0 | 1.0 | 656 | $700 | $1.07 | 14d | 1 | 1.06mi |
| 2300 Plum St Unit 2302 Montgomery, AL | 1.0 | 1.0 | 656 | $700 | $1.07 | 14d | 1 | 1.07mi |
| 7 Calhoun Rd Unit B Montgomery, AL | 2.0 | 1.0 | 961 | $850 | $0.88 | 44d | 1 | 1.22mi |
| 319 Olivia Ct Montgomery, AL | 2.0 | 1.0 | 850 | $700 | $0.82 | 21d | 1 | 1.24mi |
| 215 N Court St Unit 06 Montgomery, AL | 1.0 | 1.0 | 695 | $1,315 | $1.89 | 44d | 1 | 1.26mi |
| 215 N Court St Unit 04 Montgomery, AL | 1.0 | 1.0 | 927 | $1,570 | $1.69 | 44d | 1 | 1.26mi |
| 1324 Federal Dr Montgomery, AL | 2.0 | 1.0 | 1000 | $1,100 | $1.10 | 44d | 1 | 1.28mi |
| 122 Oak Forest Dr Montgomery, AL | 3.0 | 1.0 | 1092 | $975 | $0.89 | 21d | 1 | 1.30mi |
| 301 Bradley Dr Montgomery, AL | 2.0 | 1.0 | 841 | $935 | $1.11 | 14d | 1 | 1.33mi |
| 80 Turner Pl Unit 14 Montgomery, AL | 2.0 | 1.0 | 620 | $750 | $1.21 | 44d | 1 | 1.35mi |
| 311 Bradley Dr Montgomery, AL | 3.0 | 1.0 | 1104 | $825 | $0.75 | 44d | 1 | 1.35mi |
| 207 Montgomery St Montgomery, AL | 1.0–2.0 | 1.0–2.0 | 890 | $1,785 | $2.01 | 14d | 4 | 1.42mi |
| 1817 Texas Ct Montgomery, AL | 3.0 | 1.0 | 925 | $1,050 | $1.14 | 21d | 1 | 1.43mi |
| 3042 George B Edmondson Dr Montgomery, AL | 3.0 | 1.0 | 900 | $860 | $0.96 | 44d | 1 | 1.44mi |
| 2056 Midway St Montgomery, AL | 3.0 | 1.0 | 1110 | $985 | $0.89 | 44d | 1 | 1.47mi |
| 2076 Midway St Montgomery, AL | 3.0 | 1.0 | 1068 | $1,000 | $0.94 | 44d | 1 | 1.49mi |
Listing history 23 events
-
2026-06-18days on market $61,900 Active 210 DOM
-
2026-06-17days on market $61,900 Active 209 DOM
-
2026-06-16days on market $61,900 Active 208 DOM
-
2026-06-15days on market $61,900 Active 207 DOM
-
2026-06-14days on market $61,900 Active 205 DOM
-
2026-06-13days on market $61,900 Active 204 DOM
-
2026-06-10days on market $61,900 Active 202 DOM
-
2026-06-09days on market $61,900 Active 201 DOM
-
2026-06-08days on market $61,900 Active 200 DOM
-
2026-06-07days on market $61,900 Active 199 DOM
-
2026-06-03days on market $61,900 Active 195 DOM
-
2026-06-02days on market $61,900 Active 194 DOM
-
2026-06-01days on market $61,900 Active 193 DOM
-
2026-05-31days on market $61,900 Active 192 DOM
-
2026-05-30days on market $61,900 Active 191 DOM
-
2026-03-05price $61,900 523-char remark
Show marketing remark (523 chars)
Two bedroom, one bathroom charming Capitol Heights home located extremely convenient to downtown. This is a great investment opportunity with long term tenants in place and current on the rent. The home has been very well maintained and is under professional property management. Current monthly rent is $585.00. The owner wants to sell this property and the 1510 Yancey next door as a package deal but will consider selling them separately. Call me or your preferred realtor today with any questions or to schedule a tour.
-
2026-02-10price $63,900 523-char remark
Show marketing remark (523 chars)
Two bedroom, one bathroom charming Capitol Heights home located extremely convenient to downtown. This is a great investment opportunity with long term tenants in place and current on the rent. The home has been very well maintained and is under professional property management. Current monthly rent is $585.00. The owner wants to sell this property and the 1510 Yancey next door as a package deal but will consider selling them separately. Call me or your preferred realtor today with any questions or to schedule a tour.
-
2025-12-16price $65,900 523-char remark
Show marketing remark (523 chars)
Two bedroom, one bathroom charming Capitol Heights home located extremely convenient to downtown. This is a great investment opportunity with long term tenants in place and current on the rent. The home has been very well maintained and is under professional property management. Current monthly rent is $585.00. The owner wants to sell this property and the 1510 Yancey next door as a package deal but will consider selling them separately. Call me or your preferred realtor today with any questions or to schedule a tour.
-
2025-11-20$68,000 Active 523-char remark
Show marketing remark (523 chars)
Two bedroom, one bathroom charming Capitol Heights home located extremely convenient to downtown. This is a great investment opportunity with long term tenants in place and current on the rent. The home has been very well maintained and is under professional property management. Current monthly rent is $585.00. The owner wants to sell this property and the 1510 Yancey next door as a package deal but will consider selling them separately. Call me or your preferred realtor today with any questions or to schedule a tour.
-
2018-09-19soldstatus $46,000
-
2002-04-30soldstatus $18,000 102-char remark
Show marketing remark (102 chars)
SHOW THIS CUTE HOUSE. HAS A SCREEN PORCH. REFRG. AND STOVE REMAIN. GREAT FOR FIRST TIMER OR INVESTOR!
-
2001-09-26$25,700 102-char remark
Show marketing remark (102 chars)
SHOW THIS CUTE HOUSE. HAS A SCREEN PORCH. REFRG. AND STOVE REMAIN. GREAT FOR FIRST TIMER OR INVESTOR!
-
1998-07-15$41,900
ⓘ Source: listings_history table (triggers on properties + properties_extension) + one-shot
backfill from property_details.listing_events for pre-trigger history.
Tax reassessment forecast AL · Resets to sale price
- Current annual tax
- $565 · $47/mo
- Projected year-2 tax
- $565 · $47/mo
- Expected delta
- $0/yr ($0/mo · 0.0%)
ⓘ Screening estimate from a state-policy table — verify with the county assessor before closing.
Climate risk First Street
- Flood 1/10 Low FEMA zone X (unshaded) · 0% chance over 30 yrs
- Wildfire 3/10 Moderate
- Heat 7/10 Severe 6 d/yr ≥107°F today · 18 d/yr by 30 yrs out
- Wind 8/10 Severe 80% chance of damaging wind over 30 yrs
- Air quality 3/10 Moderate 4 unhealthy d/yr today · 4 by 30 yrs out
Nearby sold comps map
Loading sold comps map…
Walkable amenities ~0.75 mi
Loading nearby amenities…
Taxation est. · year 1
- Rental income
- $11,021
- − Mortgage interest
- −$3,467
- − Property taxes
- −$565
- − Insurance
- −$310
- − Repairs & maintenance
- −$882
- − Management
- −$882
- − Depreciation
- −$1,801
- Taxable income
- $3,115
- Est. tax owed @ 24.0%
- −$748
- After-tax cash flow
- $3,189/yr
For passive investors: Depreciation is non-cash, so a rental often shows a tax loss while cash-flowing — sheltering income. Rental losses are passive: they offset passive income freely, and up to $25,000/yr can offset ordinary (W-2) income if you actively participate and your MAGI is under $100k (phasing out to $0 by $150k); unused losses carry forward. On sale, claimed depreciation is recaptured at up to 25%, and gains may owe capital-gains tax (a 1031 exchange can defer both). Figures are a year-1 estimate at your 24.0% rate — not tax advice; consult a CPA.
Schools (NCES district)
- District
- Montgomery County
- NCES district ID
- 0102430
- Math proficiency
- 9% ▼ -21.00%
- Reading proficiency
- 31% ▼ -1.00%
- Median HH income
- $43,902
- Composite
- 17.24/100
- National rank
- #9093
- State rank
- #106 of 129 in AL
Livability — Montgomery
- Score
- 65/100
- State rank
- #138
- US rank
- #13416
Category grades
Schools grade is shown separately in the Schools card above.
Census & demographics
- Census place
- Montgomery, AL
- County
- Montgomery County · 190,016 people
- City population
- 175,913
- Metro
- Montgomery, AL
- Population (ZIP)
- 8,001
- Household income
- $32,492
- Rent vs Own
- Severe rent burden
- 642.0
Population outlook (Montgomery County) Hauer SSP2
- Today (2025)
- 224,008 people
- By 2030
- 221,460 · -1.1%
- By 2040
- 214,179 · -4.4%
- By 2050
- 204,912 · -8.5%
- By 2075
- 177,821 · -20.6%
- By 2100
- 145,134 · -35.2%
Race, ethnicity, and origin ACS 2023
- Neighborhood character
- Diverse neighborhood (Simpson 0.69)
- Race & ethnicity
- Black 43% White 27% Hispanic / Latino 23% Two or more races 20%
- Hispanic origin (detail)
- Mexican 8% Cuban 3%
- Common ancestry
- Slovak 1% Iranian 1% Serbian 1%
- Foreign-born
- 11% · Canada
- Languages at home
- 83% English-only · Spanish 13%
Political lean MEDSL · Montgomery
- 2024 margin
- Solid D (+30.7) · D 64.8% · R 34.1% · Other 1.1%
- 2008→2024 swing
- +11.5pp toward D · 2008: 19.2pp · 2024: 30.7pp
- All cycles
- 2024: D+30.7 2020: D+31.5 2016: D+26.2 2012: D+24.3 2008: D+19.2
Not yet ingested
- Civics
- —
Market trends
- HPI YoY
- ▼ -18.16%
- Current HPI
- 147.8065
- Rent YoY
- ▲ 5.05%
- Metro
- Montgomery, AL
- State GDP YoY
- ▲ 2.94%
- F500 in state
- 4
Industry mix (Fortune 500 HQ in AL)
| Industry | F500 HQs | Revenue |
|---|---|---|
| Financial Services | 1 | $8B |
|
||
| Healthcare | 1 | $5B |
|
||
Price history
+47.7% since first listed8 events — show timeline
- 2026-03-05 Price Changed $61,900 MAAR
- 2026-02-10 Price Changed $63,900 MAAR
- 2025-12-16 Price Changed $65,900 MAAR
- 2025-11-20 Listed $68,000 MAAR
- 2018-09-19 Sold (Public Records) $46,000 Public Records
- 2002-04-30 Sold (MLS) $18,000 MAAR
- 2001-09-26 Listed $25,700 MAAR
- 1998-07-15 Listed $41,900 MAAR
Property tax history
+5.4%/yrLatest (2025): $565 · -9.2% YoY. Source: county tax records.
Cash-flow waterfall
monthlySold comps — $/sqft
last 12 mo · ≤1 miLoading sold comps…