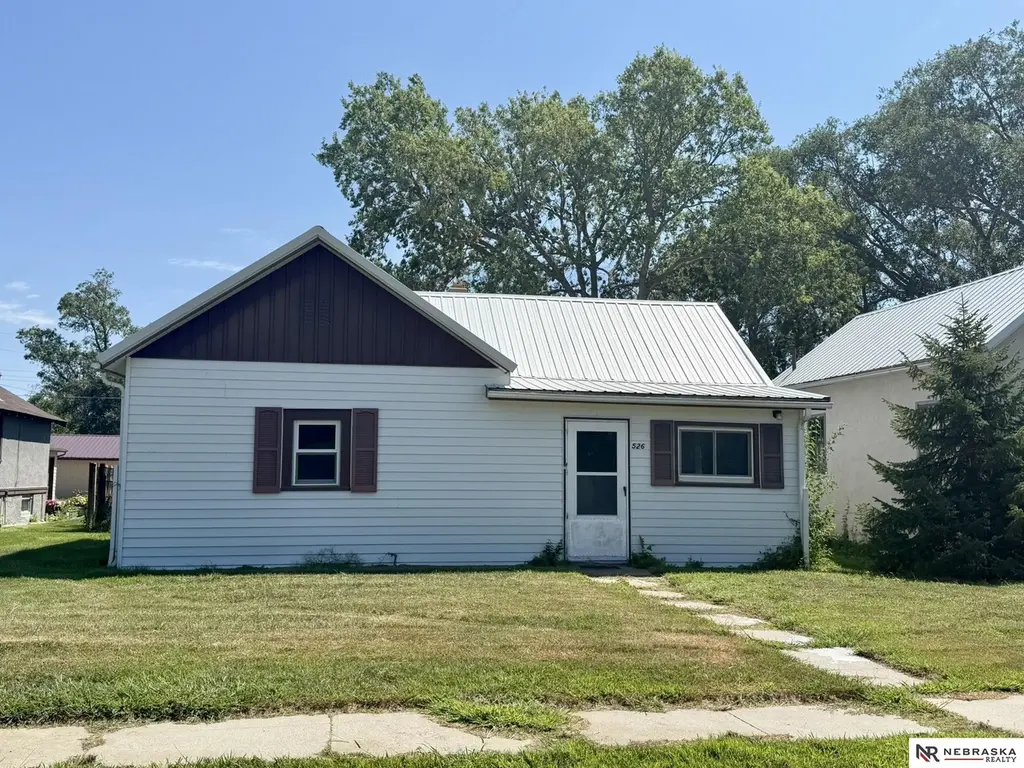
526 N Hall St · Valentine, NE
Flood risk 1/10 · Minimal
- FEMA flood zone
- —
- Chance of flooding over 30 yrs
- 0.0%
- Est. flood insurance / yr
- —
Fire risk 6/10 · Moderate
- Est. fire insurance / yr
- $1,161 – $2,155
Heat risk 3/10 · Minor
- Hot days now (above 99°F)
- 7 days/yr
- Hot days in 30 yrs
- 16 days/yr
Wind risk 2/10 · Minimal
- Chance of severe wind over 30 yrs
- —
Air-quality risk 2/10 · Minimal
- Unhealthy air days now
- 1 days/yr
- Unhealthy air days in 30 yrs
- 1 days/yr
Risk factors via First Street. Map © Google.
Why this score? — see what drove the B- grade
The composite is a weighted blend of 9 inputs, each scored 0–100. Each bar is that input's sub-score; the figure is the points it added to the 100-point composite (weight × sub-score).
- Cash flow +23.9/30.0
- ARV discount +15.0/15.0
- DSCR +7.7/10.0
- 1% rule +5.5/10.0
- Schools +4.6/10.0
- Livability +4.0/5.0
- Rent growth +2.5/5.0
- Condition / age +2.5/5.0
- Appreciation +0.0/10.0
$99,000
🖨 Deal sheet (PDF) 📄 Offer letter ✓ Due diligence
Listing remarks MLS
Charming home in a prime location! Featuring a maintenance-free exterior, detached 3-car garage, underground sprinklers, newer windows and efficient geothermal heating and cooling. Comfort and convenience all in one!
Key facts
- Newer windows
- Detached garage
- 7,500 sq ft lot
Tags
Neighborhood map
What this means for you Summary
Snapshot
- This is a 2-bed/1.0-bath single-family listed at $99k.
Deal economics
- At list price, monthly cash flow is $192 ($2k/yr) — positive.
- The deal already cash-flows at list — no discount required.
- Meets the 1% rule at list price ($1k rent vs $99k).
- Recommended offer: $87k (12.0% below list) — sets the bar for market timing.
Location & tenants
- Location reads 79/100 on livability (#40 in NE, #2,179 nationally) — a middle-class / working-renter tenant base. Strengths: cost of living A+, housing A+, health & safety A+; Watch: employment C-, amenities F, commute F.
- Valentine Community Schools (town): math 55% / reading 54% proficiency, ranked #47 of 111 in NE (top 42%) — acceptable for families but not a draw, mixed tenant base, ~2y average lease.
- Market conditions: 16 active listings in the ZIP; 15 units permitted in Cherry County in 2024 (0 in 5+ unit buildings).
Forward outlook
- Local home prices are declining (-3.0%/yr); year-one equity from $684 of loan paydown is wiped out by about $3k of value loss. Plan a longer hold.
- Cherry County population projected at +11% by 2050 — modest demand growth; plan on rents tracking national, not racing it.
Negotiation context
- It's been on market 284 days — a 12% lower offer ($87k) is reasonable based on typical stale-listing flexibility.
Risks & watch-outs
- Watch-outs: built in 1920 — expect roof / HVAC / electrical / plumbing capex.
- Climate carrying-cost: major wildfire risk — expect insurance premiums to compound above CPI over the hold.
Questions for the listing agent
- It's been on market 284 days. Have you received any prior offers? Is the seller open to a 12% concession, seller financing, or rate buy-down credit?
- Built in 1920 — when were the roof, HVAC, electrical panel, plumbing, and water heater last replaced?
- Why hasn't it sold? Are there any deal-killer items the seller is aware of (foundation, flood, title, zoning, code violations)?
- Is there a deadline driving the sale (1031 exchange, divorce, estate, relocation)? That informs how much negotiation room exists.
- Schools are B-rated — typically a magnet for longer-tenancy family renters. What's the average tenant stay here, and is there a school-zone premium baked into asking?
- What's the average days-on-market for RENTAL listings here right now (not sales)? A rising rental-DOM trend means longer vacancies and softer asking-rent achievability than the comps imply.
- What's the recent tenant-quality profile in this submarket — average credit score on applications, eviction rate, late-payment / NSF rate, and stable-employment percentage? A property-management company in the area should have these aggregated.
- How much new for-sale + rental construction is in the pipeline within 1–3 miles? Heavy new supply typically softens prices + rents 12–24 months out; constrained supply supports both.
Investment metrics
- 1% rule
- 1.05% ✓
- Cap rate
- 8.63%
- Cash-on-cash
- 8.33%
- DSCR
- 1.37
- GRM
- 7.9
CMA / ARV
- ARV (median comp)
- $169,790
- List price
- $99,000
- Delta
- -41.69%
- Verdict
- UNDERPRICED
- Comps
- 3 within 1.0 mi
Show comp detail 4 sales within ~0.75 mi
| Address | Dist | Beds/Ba | Sqft | Sold | Price | $/sf | Match |
|---|---|---|---|---|---|---|---|
| 538 N Main St | 0.08mi | 3/2.0 (+1) | 2,184 (+11%) | 2mo | $179,900 | $82 | 67 |
| 512 Sandoz St | 0.44mi | 3/2.0 (+1) | 1,965 (+0%) | 5mo | $215,000 | $109 | 66 |
| 606 N Cherry St | 0.17mi | 3/3.0 (+1) | 1,871 (-5%) | 9mo | $238,000 | $127 | 64 |
| 240 W 3rd St | 0.36mi | 3/2.0 (+1) | 1,872 (-4%) | 6mo | $310,000 | $166 | 62 |
Match score weights: distance 35% · size 25% · config 20% · recency 20%. Top-matched comps best support the ARV.
Projected returns pro-forma
-3.0% appreciation · 3.0% rent growth · sell at horizon
- IRR
- -3.7%
- Equity multiple
- 0.86×
- Total profit
- $-3,801
- Equity at exit
- $14,761
- IRR
- 6.0%
- Equity multiple
- 1.45×
- Total profit
- $12,408
- Equity at exit
- $8,560
Cash invested: $27,720 (down + closing). Projections, not guarantees.
Landlord ↔ Tenant lean methodology
- Overall (STATE)
- 83 Strongly Landlord-Friendly
- State Nebraska
- 83 Strongly Landlord-Friendly · R+13
- County
- — inherits STATE
- City
- — inherits STATE
ZIP-level market 69201
- Home prices YoY
- -27.5%
- Active inventory
- 16
- Price-to-rent
- 7.9×
Monthly cashflow live
- Estimated rent
- $1,044 medium interval (Pro) →
- Mortgage (P&I)
- −$519
- Tax from tax record
- −$72 /mo · $861/yr
- Insurance
- −$41
- HOA
- −$0
- Vacancy / Maint / Mgmt
- −$219
- Net cashflow
- $192
Break-even live
Sensitivity live
| Price | -10% $248 | -5% $220 | +0% $192 | +5% $164 | +10% $136 |
|---|---|---|---|---|---|
| Rent | -10% $110 | -5% $151 | +0% $192 | +5% $234 | +10% $275 |
| Rate | -1.0pp $242 | -0.5pp $218 | base $192 | +0.5pp $167 | +1.0pp $141 |
UW: 25.0% down · 7.5% · 30yr · 1.5% tax · 5.0% vac · 8.0% maint · 8.0% mgmt
Financing live
Cash to close
- Down payment
- $24,750
- Closing costs
- $2,970
- Reserves months
- —
- Total cash needed
- —
Loan-product check · same deal, 3 products live
Conventional
25% down · 7.5% · 30yr
- Down + closing
- —
- Monthly P&I
- —
- Monthly cashflow
- —
- DSCR
- —
- Eligible?
- —
Personal DTI + credit; lowest rate.
DSCR
20% down · 8.5% · 30yr
- Down + closing
- —
- Monthly P&I
- —
- Monthly cashflow
- —
- DSCR
- —
- Eligible?
- —
No personal income docs; deal must DSCR.
Hard money
10% down · 12.0% · 12mo
- Down + closing
- —
- Monthly P&I
- —
- Monthly cashflow
- —
- DSCR
- —
- Eligible?
- —
Short-term bridge; refi at stabilization.
Listing history 2 events
-
2026-03-24price $99,000 216-char remark
Show marketing remark (216 chars)
Charming home in a prime location! Featuring a maintenance-free exterior, detached 3-car garage, underground sprinklers, newer windows and efficient geothermal heating and cooling. Comfort and convenience all in one!
-
2025-08-13$135,000 New 216-char remark
Show marketing remark (216 chars)
Charming home in a prime location! Featuring a maintenance-free exterior, detached 3-car garage, underground sprinklers, newer windows and efficient geothermal heating and cooling. Comfort and convenience all in one!
ⓘ Source: listings_history table (triggers on properties + properties_extension) + one-shot
backfill from property_details.listing_events for pre-trigger history.
Tax reassessment forecast NE · Resets to sale price
- Current annual tax
- $861 · $72/mo
- Projected year-2 tax
- $1,713 · $143/mo
- Expected delta
- +$852/yr (+$71/mo · 98.9%)
ⓘ Screening estimate from a state-policy table — verify with the county assessor before closing.
Climate risk First Street
- Flood 1/10 Low 0% chance over 30 yrs
- Wildfire 6/10 Major
- Heat 3/10 Moderate 7 d/yr ≥99°F today · 16 d/yr by 30 yrs out
- Wind 2/10 Low
- Air quality 2/10 Low 1 unhealthy d/yr today · 1 by 30 yrs out
Nearby sold comps map
Loading sold comps map…
Walkable amenities ~0.75 mi
Loading nearby amenities…
Taxation est. · year 1
- Rental income
- $12,526
- − Mortgage interest
- −$5,546
- − Property taxes
- −$861
- − Insurance
- −$495
- − Repairs & maintenance
- −$1,002
- − Management
- −$1,002
- − Depreciation
- −$2,880
- Taxable income
- $740
- Est. tax owed @ 24.0%
- −$178
- After-tax cash flow
- $2,132/yr
For passive investors: Depreciation is non-cash, so a rental often shows a tax loss while cash-flowing — sheltering income. Rental losses are passive: they offset passive income freely, and up to $25,000/yr can offset ordinary (W-2) income if you actively participate and your MAGI is under $100k (phasing out to $0 by $150k); unused losses carry forward. On sale, claimed depreciation is recaptured at up to 25%, and gains may owe capital-gains tax (a 1031 exchange can defer both). Figures are a year-1 estimate at your 24.0% rate — not tax advice; consult a CPA.
Schools (NCES district)
- District
- Valentine Community Schools
- NCES district ID
- 3178020
- Math proficiency
- 55% ▼ -8.00%
- Reading proficiency
- 54% ▼ -13.00%
- Median HH income
- $47,004
- Composite
- 46.24/100
- National rank
- #2487
- State rank
- #47 of 111 in NE
Livability — Valentine
- Score
- 79/100
- State rank
- #40
- US rank
- #2179
Category grades
Schools grade is shown separately in the Schools card above.
Census & demographics
- Census place
- Valentine, NE
- Population (ZIP)
- 4,034
Population outlook (Cherry County) Hauer SSP2
- Today (2025)
- 6,012 people
- By 2030
- 6,111 · +1.6%
- By 2040
- 6,359 · +5.8%
- By 2050
- 6,690 · +11.3%
- By 2075
- 7,974 · +32.6%
- By 2100
- 8,850 · +47.2%
Race, ethnicity, and origin ACS 2023
- Neighborhood character
- Predominantly White (73%)
- Race & ethnicity
- White 73% Native American 12% Two or more races 9% Hispanic / Latino 4% Asian 2% Black 1%
- Common ancestry
- Romanian 3% Lithuanian 2% Iranian 1%
- Foreign-born
- 3% · Canada, Jamaica
- Languages at home
- 90% English-only · Spanish 2% Vietnamese 2%
Political lean MEDSL · Cherry
- 2024 margin
- Solid R (+76.2) · D 11.4% · R 87.5% · Other 1.1%
- 2008→2024 swing
- -18.6pp toward R · 2008: -57.6pp · 2024: -76.2pp
- All cycles
- 2024: R+76.2 2020: R+75.6 2016: R+74.8 2012: R+69.5 2008: R+57.6
Not yet ingested
- Civics
- —
Market trends
- HPI YoY
- ▼ -63.49%
- Current HPI
- 167.7596
- Rent YoY
- —
- Metro
- —
- State GDP YoY
- ▲ 0.68%
- F500 in state
- 2
Industry mix (Fortune 500 HQ in NE)
| Industry | F500 HQs | Revenue |
|---|---|---|
| Conglomerate | 1 | $371B |
|
||
Price history
-26.7% since first listed2 events — show timeline
- 2026-03-24 Price Changed $99,000 GPRMLS
- 2025-08-13 Listed $135,000 GPRMLS
Property tax history
+0.7%/yrLatest (2025): $861 · -3.4% YoY. Source: county tax records.
Cash-flow waterfall
monthlySold comps — $/sqft
last 12 mo · ≤1 miLoading sold comps…