 Multi-family
418 Cinnabar Ave · Mountain City, NV
Flood risk 1/10 · Minimal
- FEMA flood zone
- X (unshaded)
- Chance of flooding over 30 yrs
- 0.0%
- Est. flood insurance / yr
- $507 – $1,088
Fire risk 7/10 · Major
- Est. fire insurance / yr
- $490 – $910
Heat risk 2/10 · Minimal
- Hot days now (above 86°F)
- 8 days/yr
- Hot days in 30 yrs
- 22 days/yr
Wind risk 1/10 · Minimal
- Chance of severe wind over 30 yrs
- —
Air-quality risk 7/10 · Major
- Unhealthy air days now
- 13 days/yr
- Unhealthy air days in 30 yrs
- 15 days/yr
Risk factors via First Street. Map © Google.
Why this score? — see what drove the C+ grade
The composite is a weighted blend of 9 inputs, each scored 0–100. Each bar is that input's sub-score; the figure is the points it added to the 100-point composite (weight × sub-score).
- Cash flow +26.8/30.0
- DSCR +9.2/10.0
- ARV discount +7.5/15.0
- 1% rule +7.2/10.0
- Schools +2.8/10.0
- Rent growth +2.5/5.0
- Livability +2.5/5.0
- Condition / age +2.5/5.0
- Appreciation +0.0/10.0
$250,000
🖨 Deal sheet 📄 Offer letter ✓ Due diligence
Multi-family units
County records classify this as Multi-Family (2-4 Unit). Listing-text estimate: 1 unit. estimate disagrees with records
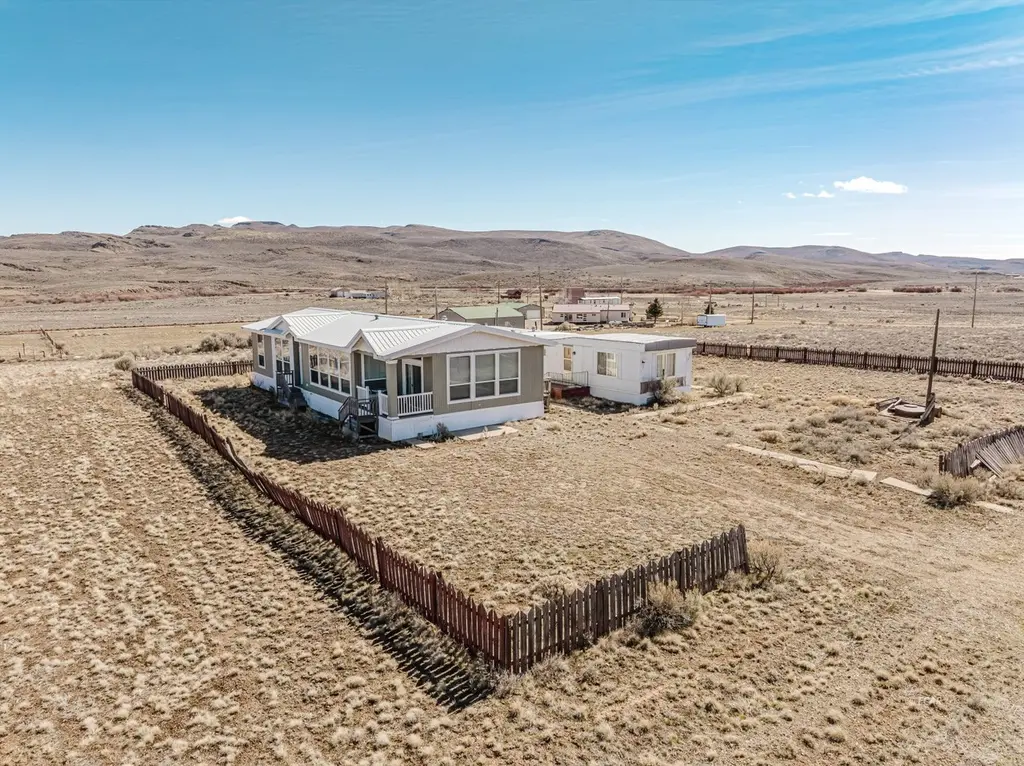
Listing remarks MLS
Don't miss out on this spacious 3 bedroom 2 bathroom home situated on 1 acre in the Wildhorse area near the lake. This property offers plenty of space with peaceful surroundings and easy access to outdoor recreation. Enjoy country living with room to spread out while still being close to Wildhorse Reservoir for fishing, boating, and relaxing in nature. There is also a single wide mobile home on the property, offering extra sleeping arrangements for overnight guests.
Key facts
- Outdoor recreation
- Country living
- Wildhorse area
Tags
Neighborhood map
What this means for you Summary
Snapshot
- This is a 3-bed/2.0-bath multifamily listed at $250k.
Deal economics
- At list price, monthly cash flow is $686 ($8k/yr) — positive.
- The deal already cash-flows at list — no discount required.
- Meets the 1% rule at list price ($3k rent vs $250k).
- Recommended offer: $228k (9.0% below list) — sets the bar for market timing.
Location & tenants
- Location reads: area grade C — affects rentability + tenant quality, not the cash-flow math above.
- Elko County School District (town): math 22% / reading 38% proficiency, ranked #9 of 17 in NV (top 53%) — families likely to look elsewhere, expect single-tenant / working-renter base with shorter leases.
- Market conditions: 280 active listings in the ZIP; 120 units permitted in Elko County in 2024 (0 in 5+ unit buildings).
Forward outlook
- Local home prices are declining (-3.0%/yr); year-one equity from $2k of loan paydown is wiped out by about $8k of value loss. Plan a longer hold.
- Elko County population projected at +18% by 2050 — long-run rental-demand tailwind backs the buy-and-hold thesis.
- At projected returns (-3.0% appreciation + 3.0% rent growth), your $70k cash investment doubles in ~10 years — after that, you're playing with house money.
Negotiation context
- It's been on market 95 days — a 9% lower offer ($228k) is reasonable based on typical stale-listing flexibility.
Risks & watch-outs
- Climate carrying-cost: major wildfire risk — expect insurance premiums to compound above CPI over the hold.
Questions for the listing agent
- It's been on market 95 days. Have you received any prior offers? Is the seller open to a 9% concession, seller financing, or rate buy-down credit?
- Why hasn't it sold? Are there any deal-killer items the seller is aware of (foundation, flood, title, zoning, code violations)?
- Is there a deadline driving the sale (1031 exchange, divorce, estate, relocation)? That informs how much negotiation room exists.
- What's the average days-on-market for RENTAL listings here right now (not sales)? A rising rental-DOM trend means longer vacancies and softer asking-rent achievability than the comps imply.
- What's the recent tenant-quality profile in this submarket — average credit score on applications, eviction rate, late-payment / NSF rate, and stable-employment percentage? A property-management company in the area should have these aggregated.
- How much new apartment / multifamily construction is in the pipeline within 1–3 miles? Heavy new supply (>2% of stock underway) typically softens rents 12–24 months out; light construction supports rent growth.
Investment metrics
- 1% rule
- 1.22% ✓
- Cap rate
- 9.58%
- Cash-on-cash
- 11.76%
- DSCR
- 1.52
- GRM
- 6.8
CMA / ARV
No comps found within radius.
Projected returns pro-forma
-3.0% appreciation · 3.0% rent growth · sell at horizon
- IRR
- 1.2%
- Equity multiple
- 1.05×
- Total profit
- $3,212
- Equity at exit
- $37,276
- IRR
- 10.8%
- Equity multiple
- 1.85×
- Total profit
- $59,224
- Equity at exit
- $21,615
Cash invested: $70,000 (down + closing). Projections, not guarantees.
Landlord ↔ Tenant lean methodology
- Overall (STATE)
- 71 Landlord-Friendly
- State Nevada
- 71 Landlord-Friendly · R+1
- County
- — inherits STATE
- City
- — inherits STATE
ZIP-level market 89801
- Active inventory
- 280
- Price-to-rent
- 13.6×
Monthly cashflow live
- Estimated rent
- $3,055 medium interval (Pro) →
- Mortgage (P&I)
- −$1,311
- Tax est. 1.5%
- −$312 /mo · $3,750/yr
- Insurance
- −$104
- HOA
- −$0
- Vacancy / Maint / Mgmt
- −$642
- Net cashflow
- $686
Break-even live
2-unit breakdown (identical units grouped — click to expand)
| Units | Beds | Baths | Est. rent |
|---|---|---|---|
| 2× units | 3 | 2 | $3,056 |
| #1 | 3 | 2 | $1,528 |
| #2 | 3 | 2 | $1,528 |
| Total (2 units) | $3,055 | ||
UW: 25.0% down · 7.5% · 30yr · 1.5% tax · 5.0% vac · 8.0% maint · 8.0% mgmt
Financing live
Cash to close
- Down payment
- $62,500
- Closing costs
- $7,500
- Reserves months
- —
- Total cash needed
- —
Loan-product check · same deal, 3 products live
Conventional
25% down · 7.5% · 30yr
- Down + closing
- —
- Monthly P&I
- —
- Monthly cashflow
- —
- DSCR
- —
- Eligible?
- —
Personal DTI + credit; lowest rate.
DSCR
20% down · 8.5% · 30yr
- Down + closing
- —
- Monthly P&I
- —
- Monthly cashflow
- —
- DSCR
- —
- Eligible?
- —
No personal income docs; deal must DSCR.
Hard money
10% down · 12.0% · 12mo
- Down + closing
- —
- Monthly P&I
- —
- Monthly cashflow
- —
- DSCR
- —
- Eligible?
- —
Short-term bridge; refi at stabilization.
Listing history 17 events
-
2026-06-19days on market $250,000 Active 95 DOM
-
2026-06-18days on market $250,000 Active 94 DOM
-
2026-06-17days on market $250,000 Active 93 DOM
-
2026-06-16days on market $250,000 Active 92 DOM
-
2026-06-15days on market $250,000 Active 91 DOM
-
2026-06-14days on market $250,000 Active 89 DOM
-
2026-06-12days on market $250,000 Active 88 DOM
-
2026-06-09days on market $250,000 Active 85 DOM
-
2026-06-08days on market $250,000 Active 84 DOM
-
2026-06-07days on market $250,000 Active 83 DOM
-
2026-06-07days on market $250,000 Active 82 DOM
-
2026-06-04days on market $250,000 Active 79 DOM
-
2026-06-02days on market $250,000 Active 78 DOM
-
2026-06-01days on market $250,000 Active 77 DOM
-
2026-05-31days on market $250,000 Active 76 DOM
-
2026-05-31days on market $250,000 Active 75 DOM
-
2026-03-16$250,000 Active 470-char remark
Show marketing remark (470 chars)
Don't miss out on this spacious 3 bedroom 2 bathroom home situated on 1 acre in the Wildhorse area near the lake. This property offers plenty of space with peaceful surroundings and easy access to outdoor recreation. Enjoy country living with room to spread out while still being close to Wildhorse Reservoir for fishing, boating, and relaxing in nature. There is also a single wide mobile home on the property, offering extra sleeping arrangements for overnight guests.
ⓘ Source: listings_history table (triggers on properties + properties_extension) + one-shot
backfill from property_details.listing_events for pre-trigger history.
Climate risk First Street
- Flood 1/10 Low FEMA zone X (unshaded) · 0% chance over 30 yrs
- Wildfire 7/10 Severe
- Heat 2/10 Low 8 d/yr ≥86°F today · 22 d/yr by 30 yrs out
- Wind 1/10 Low
- Air quality 7/10 Severe 13 unhealthy d/yr today · 15 by 30 yrs out
Nearby sold comps map
Loading sold comps map…
Walkable amenities ~0.75 mi
Loading nearby amenities…
Taxation est. · year 1
- Rental income
- $36,660
- − Mortgage interest
- −$14,004
- − Property taxes
- −$3,750
- − Insurance
- −$1,250
- − Repairs & maintenance
- −$2,933
- − Management
- −$2,933
- − Depreciation
- −$7,273
- Taxable income
- $4,518
- Est. tax owed @ 24.0%
- −$1,084
- After-tax cash flow
- $7,145/yr
For passive investors: Depreciation is non-cash, so a rental often shows a tax loss while cash-flowing — sheltering income. Rental losses are passive: they offset passive income freely, and up to $25,000/yr can offset ordinary (W-2) income if you actively participate and your MAGI is under $100k (phasing out to $0 by $150k); unused losses carry forward. On sale, claimed depreciation is recaptured at up to 25%, and gains may owe capital-gains tax (a 1031 exchange can defer both). Figures are a year-1 estimate at your 24.0% rate — not tax advice; consult a CPA.
Schools (NCES district)
- District
- Elko County School District
- NCES district ID
- 3200120
- Math proficiency
- 22% ▼ -10.00%
- Reading proficiency
- 38% ▼ -6.00%
- Median HH income
- $70,371
- Composite
- 28.09/100
- National rank
- #6831
- State rank
- #9 of 17 in NV
Livability — Mountain City
No livability data for this city. (Only ~50 U.S. cities are tracked.)
Census & demographics
- Population (ZIP)
- 26,070
Population outlook (Elko County) Hauer SSP2
- Today (2025)
- 56,797 people
- By 2030
- 59,107 · +4.1%
- By 2040
- 63,513 · +11.8%
- By 2050
- 66,996 · +18.0%
- By 2075
- 73,785 · +29.9%
- By 2100
- 72,352 · +27.4%
Race, ethnicity, and origin ACS 2023
- Neighborhood character
- Diverse neighborhood (Simpson 0.56)
- Race & ethnicity
- White 61% Hispanic / Latino 27% Two or more races 15% Native American 5% Asian 2% Black 1%
- Hispanic origin (detail)
- Mexican 25%
- Common ancestry
- Dutch 2% Italian 2% Portuguese 2%
- Foreign-born
- 8% · Canada, China
- Languages at home
- 82% English-only · Spanish 15% Chinese 1%
Political lean MEDSL · Elko
- 2024 margin
- Solid R (+56.6) · D 20.6% · R 77.2% · Other 2.1%
- 2008→2024 swing
- -16.2pp toward R · 2008: -40.5pp · 2024: -56.6pp
- All cycles
- 2024: R+56.6 2020: R+55.5 2016: R+54.7 2012: R+53.2 2008: R+40.5
Not yet ingested
- Civics
- —
Market trends
- HPI YoY
- ▼ -122.07%
- Current HPI
- 146.8186
- Rent YoY
- —
- Metro
- —
- State GDP YoY
- ▲ 3.08%
- F500 in state
- 6
Industry mix (Fortune 500 HQ in NV)
| Industry | F500 HQs | Revenue |
|---|---|---|
| Hotels / Casinos | 3 | $36B |
|
||
Price history
1 event — show timeline
- 2026-03-16 Listed $250,000 ECRMLS
Property tax history
+2.0%/yrLatest (2025): $207 · -2.2% YoY. Source: county tax records.
Cash-flow waterfall
monthlySold comps — $/sqft
last 12 mo · ≤1 miLoading sold comps…