 Duplex
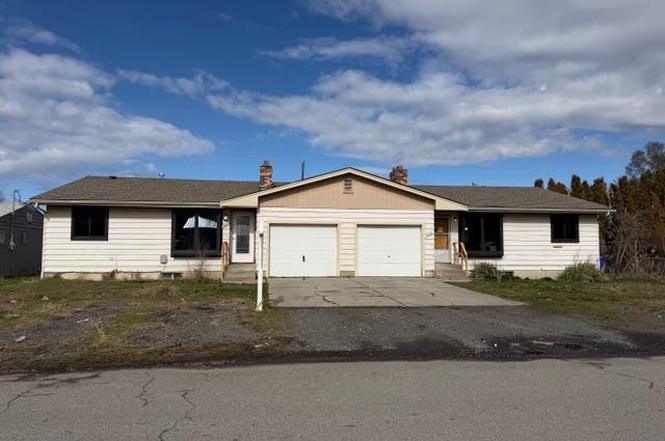
4609 E 2nd Ave #4611 · Spokane Valley, WA
Flood risk 1/10 · Minimal
- FEMA flood zone
- X (unshaded)
- Chance of flooding over 30 yrs
- 0.0%
- Est. flood insurance / yr
- $473 – $860
Fire risk 3/10 · Minor
- Est. fire insurance / yr
- $604 – $1,122
Heat risk 3/10 · Minor
- Hot days now (above 93°F)
- 7 days/yr
- Hot days in 30 yrs
- 15 days/yr
Wind risk 1/10 · Minimal
- Chance of severe wind over 30 yrs
- —
Air-quality risk 9/10 · Severe
- Unhealthy air days now
- 17 days/yr
- Unhealthy air days in 30 yrs
- 17 days/yr
Risk factors via First Street. Map © Google.
Why this score? — see what drove the B grade
The composite is a weighted blend of 9 inputs, each scored 0–100. Each bar is that input's sub-score; the figure is the points it added to the 100-point composite (weight × sub-score).
- Cash flow +30.0/30.0
- 1% rule +10.0/10.0
- DSCR +10.0/10.0
- ARV discount +7.5/15.0
- Schools +4.6/10.0
- Livability +4.2/5.0
- Rent growth +3.4/5.0
- Condition / age +2.5/5.0
- Appreciation +0.0/10.0
$315,000
🖨 Deal sheet 📄 Offer letter ✓ Due diligence
Multi-family units
County records classify this as Multi-Family (2-4 Unit). Listing-text estimate: 2 units. confirmed
Listing remarks
Duplex located in between Spokane and Spokane Valley, updated windows, each unit has its own meter panel and gas furnace/ hot water heaters. Each Unit features 4 beds 1 bath with basement bedrooms egressed, wood fireplaces large backyard and attached 1 car garage.
Key facts
- Gas furnace
- Hot water heaters
- Wood fireplaces
Tags
Property features AI
Finance
- Other: Total living area reported as 3,318 (public records); Lot approximately 0.29 acres (about 135' x 94')
- Financial info: Lender-owned
- HOA & community: No community amenities
Exterior
- Parking: Attached garage; Off-site parking available; 2 garage spaces
- Utilities: Xfinity internet
- Home design: Residential income property; One-story structure
- Construction: Masonite siding; Composition roof
- Exterior features: Level lot; City street and paved road frontage
Interior
- Bedrooms: Two separate 4-bedroom units (each unit has 4 bedrooms)
- Bathrooms: Two separate 1-bath units (each unit has 1 bathroom)
- Heating & cooling: Natural gas heating; Forced air; Hot water
- Interior features: Hot water heating; Smart thermostat
- Laundry & utility: Basement laundry area
Neighborhood map
What this means for you Summary
Snapshot
- This is a 2 × 4-bed/1.0-bath units multifamily listed at $315k.
Deal economics
- At list price, monthly cash flow is $2k ($22k/yr) — positive. Per door: $933/mo.
- The deal already cash-flows at list — no discount required.
- Meets the 1% rule at list price ($5k rent vs $315k).
- Recommended offer: $287k (9.0% below list) — sets the bar for market timing.
- Cap rate 13.4% vs local median 3.0% in Spokane Valley — top-decile yield for the area; either an underpriced asset or a hidden risk that comps aren't pricing in. Stress-test before assuming the spread holds.
Location & tenants
- Location reads 85/100 on livability (#31 in WA, #512 nationally) — a professional / high-income tenant draw. Strengths: amenities A+, commute A+, housing A+; Watch: crime D+.
- Spokane School District (urban): math 47% / reading 58% proficiency, ranked #136 of 291 in WA (top 47%) — acceptable for families but not a draw, mixed tenant base, ~2y average lease.
- Zoned schools: Ferris High School (1,631 students, 48% FRL) — zoned schools at 48% FRL track the district average.
- Market conditions: Rents rising (+3.5%/yr); 187 active listings in the ZIP; 3,608 units permitted in Spokane County in 2024 (1,792 in 5+ unit buildings).
- At $5,117/mo this rent would consume 92% of the median local household income ($67k/yr) (locally 842% of renters already pay >50% of income on rent) — very limited rent-growth headroom before tenants either downsize or default.
Forward outlook
- Local home prices are declining (-3.0%/yr); year-one equity from $2k of loan paydown is wiped out by about $9k of value loss. Plan a longer hold.
- Spokane County population projected at +13% by 2050 — modest demand growth; plan on rents tracking national, not racing it.
- At projected returns (-3.0% appreciation + 3.5% rent growth), your $88k cash investment doubles in ~5 years — after that, you're playing with house money.
Negotiation context
- It's been on market 97 days — a 9% lower offer ($287k) is reasonable based on typical stale-listing flexibility.
- 2 sale attempts; this cycle's ask has dropped $70k (18%) from the opening price — seller is motivated, your offer sets the floor, not the list.
Questions for the listing agent
- It's been on market 97 days. Have you received any prior offers? Is the seller open to a 9% concession, seller financing, or rate buy-down credit?
- Can we see the unit-by-unit rent roll, current vacancy, and any below-market leases? What's the average tenancy length?
- What capital expenditures (roof, boiler, parking lot, exteriors) have been made in the last 5 years, and what's planned in the next 2?
- Built in 1973 — when were the roof, HVAC, electrical panel, plumbing, and water heater last replaced?
- Why hasn't it sold? Are there any deal-killer items the seller is aware of (foundation, flood, title, zoning, code violations)?
- Is there a deadline driving the sale (1031 exchange, divorce, estate, relocation)? That informs how much negotiation room exists.
- Schools are B-rated — typically a magnet for longer-tenancy family renters. What's the average tenant stay here, and is there a school-zone premium baked into asking?
- Crime grade is D in this area — have there been break-ins, vandalism, or insurance claims at this property in the last 3 years? What carrier currently insures it and at what premium?
- What's the average days-on-market for RENTAL listings here right now (not sales)? A rising rental-DOM trend means longer vacancies and softer asking-rent achievability than the comps imply.
- What's the recent tenant-quality profile in this submarket — average credit score on applications, eviction rate, late-payment / NSF rate, and stable-employment percentage? A property-management company in the area should have these aggregated.
- How much new apartment / multifamily construction is in the pipeline within 1–3 miles? Heavy new supply (>2% of stock underway) typically softens rents 12–24 months out; light construction supports rent growth.
Investment metrics
- 1% rule
- 1.62% ✓
- Cap rate
- 13.40%
- Cash-on-cash
- 25.38%
- DSCR
- 2.13
- GRM
- 5.1
CMA / ARV
No comps found within radius.
Projected returns pro-forma
-3.0% appreciation · 3.49% rent growth · sell at horizon
- IRR
- 19.5%
- Equity multiple
- 1.80×
- Total profit
- $70,386
- Equity at exit
- $46,968
- IRR
- 28.1%
- Equity multiple
- 3.55×
- Total profit
- $225,107
- Equity at exit
- $27,235
Cash invested: $88,200 (down + closing). Projections, not guarantees.
Landlord ↔ Tenant lean methodology
- Overall (STATE)
- 28 Tenant-Leaning
- State Washington
- 28 Tenant-Leaning · D+8
- County
- — inherits STATE
- City
- — inherits STATE
ZIP-level market 99212
- Rents YoY
- 3.5%
- Active inventory
- 187
- Price-to-rent
- 10.3×
Monthly cashflow live
- Estimated rent
- $5,117 medium interval (Pro) →
- Mortgage (P&I)
- −$1,652
- Tax est. 1.5%
- −$394 /mo · $4,725/yr
- Insurance
- −$131
- HOA
- −$0
- Vacancy / Maint / Mgmt
- −$1,075
- Net cashflow
- $1,866
Break-even live
2-unit breakdown (identical units grouped — click to expand)
| Units | Beds | Baths | Est. rent |
|---|---|---|---|
| 2× units | 4 | 1 | $5,116 |
| #1 | 4 | 1 | $2,558 |
| #2 | 4 | 1 | $2,558 |
| Total (2 units) | $5,117 | ||
UW: 25.0% down · 7.5% · 30yr · 1.5% tax · 5.0% vac · 8.0% maint · 8.0% mgmt
Financing live
Cash to close
- Down payment
- $78,750
- Closing costs
- $9,450
- Reserves months
- —
- Total cash needed
- —
Loan-product check · same deal, 3 products live
Conventional
25% down · 7.5% · 30yr
- Down + closing
- —
- Monthly P&I
- —
- Monthly cashflow
- —
- DSCR
- —
- Eligible?
- —
Personal DTI + credit; lowest rate.
DSCR
20% down · 8.5% · 30yr
- Down + closing
- —
- Monthly P&I
- —
- Monthly cashflow
- —
- DSCR
- —
- Eligible?
- —
No personal income docs; deal must DSCR.
Hard money
10% down · 12.0% · 12mo
- Down + closing
- —
- Monthly P&I
- —
- Monthly cashflow
- —
- DSCR
- —
- Eligible?
- —
Short-term bridge; refi at stabilization.
Listing history 19 events
-
2026-06-18days on market $315,000 Active 97 DOM
-
2026-06-17days on market $315,000 Active 96 DOM
-
2026-06-16pricedays on market $315,000 Active 95 DOM
-
2026-06-15days on market $329,900 Active 94 DOM
-
2026-06-14days on market $329,900 Active 92 DOM
-
2026-06-10days on market $329,900 Active 89 DOM
-
2026-06-09days on market $329,900 Active 88 DOM
-
2026-06-08days on market $329,900 Active 87 DOM
-
2026-06-07days on market $329,900 Active 86 DOM
-
2026-06-03days on market $329,900 Active 82 DOM
-
2026-06-02days on market $329,900 Active 81 DOM
-
2026-06-01days on market $329,900 Active 80 DOM
-
2026-05-31days on market $329,900 Active 79 DOM
-
2026-05-31pricedays on market $329,900 Active 78 DOM
-
2026-04-27price $349,900
-
2026-04-03price $367,000
-
2026-03-26status Active
-
2026-02-24status Pending
-
2026-02-12$385,500 Active
ⓘ Source: listings_history table (triggers on properties + properties_extension) + one-shot
backfill from property_details.listing_events for pre-trigger history.
Climate risk First Street
- Flood 1/10 Low FEMA zone X (unshaded) · 0% chance over 30 yrs
- Wildfire 3/10 Moderate
- Heat 3/10 Moderate 7 d/yr ≥93°F today · 15 d/yr by 30 yrs out
- Wind 1/10 Low
- Air quality 9/10 Extreme 17 unhealthy d/yr today · 17 by 30 yrs out
Nearby sold comps map
Loading sold comps map…
Walkable amenities ~0.75 mi
Loading nearby amenities…
Taxation est. · year 1
- Rental income
- $61,404
- − Mortgage interest
- −$17,645
- − Property taxes
- −$4,725
- − Insurance
- −$1,575
- − Repairs & maintenance
- −$4,912
- − Management
- −$4,912
- − Depreciation
- −$9,164
- Taxable income
- $18,471
- Est. tax owed @ 24.0%
- −$4,433
- After-tax cash flow
- $17,953/yr
For passive investors: Depreciation is non-cash, so a rental often shows a tax loss while cash-flowing — sheltering income. Rental losses are passive: they offset passive income freely, and up to $25,000/yr can offset ordinary (W-2) income if you actively participate and your MAGI is under $100k (phasing out to $0 by $150k); unused losses carry forward. On sale, claimed depreciation is recaptured at up to 25%, and gains may owe capital-gains tax (a 1031 exchange can defer both). Figures are a year-1 estimate at your 24.0% rate — not tax advice; consult a CPA.
Schools (NCES district)
- District
- Spokane School District
- NCES district ID
- 5308250
- Math proficiency
- 47% ▲ 1.00%
- Reading proficiency
- 58% ▲ 1.00%
- Median HH income
- $43,187
- Composite
- 46.1/100
- National rank
- #5477
- State rank
- #136 of 291 in WA
Livability — Spokane Valley
- Score
- 85/100
- State rank
- #31
- US rank
- #512
Category grades
Schools grade is shown separately in the Schools card above.
Census & demographics
- Census place
- Spokane Valley, WA
- County
- Spokane County · 496,401 people
- City population
- 129,511
- Metro
- Spokane-Spokane Valley, WA
- Population (ZIP)
- 21,707
- Household income
- $67,049
- Rent vs Own
- Severe rent burden
- 842.0
Population outlook (Spokane County) Hauer SSP2
- Today (2025)
- 531,314 people
- By 2030
- 549,278 · +3.4%
- By 2040
- 577,822 · +8.8%
- By 2050
- 598,188 · +12.6%
- By 2075
- 630,744 · +18.7%
- By 2100
- 622,360 · +17.1%
Race, ethnicity, and origin ACS 2023
- Neighborhood character
- Predominantly White (86%)
- Race & ethnicity
- White 86% Two or more races 8% Hispanic / Latino 6%
- Hispanic origin (detail)
- Mexican 4%
- Common ancestry
- Portuguese 4% Slovak 3% Lithuanian 3%
- Foreign-born
- 4% · Canada
- Languages at home
- 95% English-only · Russian/Polish/Slavic 3% Spanish 2%
Political lean MEDSL · Spokane
- 2024 margin
- Toss-up / Even · D 46.0% · R 51.0% · Other 3.0%
- 2008→2024 swing
- -3.8pp toward R · 2008: -1.1pp · 2024: -5.0pp
- All cycles
- 2024: R+5.0 2020: R+4.3 2016: R+8.3 2012: R+6.3 2008: R+1.1
Not yet ingested
- Civics
- —
Market trends
- HPI YoY
- ▼ -316.37%
- Current HPI
- 361.41
- Rent YoY
- ▲ 3.49%
- Metro
- Spokane-Spokane Valley, WA
- State GDP YoY
- ▲ 4.65%
- F500 in state
- 22
Industry mix (Fortune 500 HQ in WA)
| Industry | F500 HQs | Revenue |
|---|---|---|
| Retail | 2 | $269B |
|
||
| Technology / Retail | 1 | $638B |
|
||
| Technology | 1 | $245B |
|
||
| Telecommunications | 1 | $38B |
|
||
| Food / Beverage | 1 | $36B |
|
||
| Automotive / Trucks | 1 | $34B |
|
||
Price history
-9.2% since first listed5 events — show timeline
- 2026-04-27 Price Changed $349,900 SPOKANEMLS as Distributed by MLS Grid
- 2026-04-03 Price Changed $367,000 SPOKANEMLS as Distributed by MLS Grid
- 2026-03-26 Relisted — SPOKANEMLS as Distributed by MLS Grid
- 2026-02-24 Pending — SPOKANEMLS as Distributed by MLS Grid
- 2026-02-12 Listed $385,500 SPOKANEMLS as Distributed by MLS Grid
Cash-flow waterfall
monthlySold comps — $/sqft
last 12 mo · ≤1 miLoading sold comps…