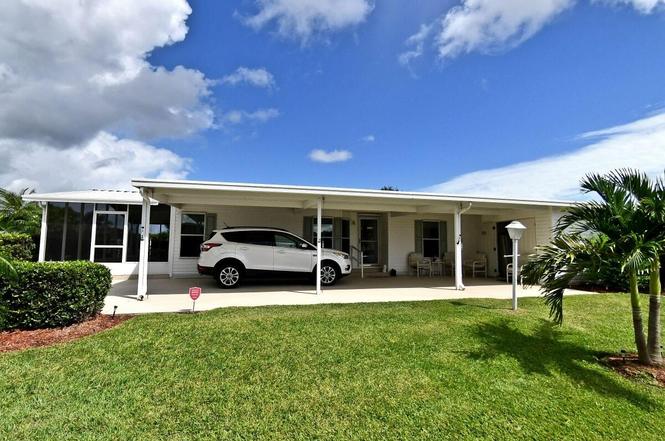
2959 Eagles Nest Way · Port St. Lucie, FL
Flood risk 1/10 · Minimal
- FEMA flood zone
- X (unshaded)
- Chance of flooding over 30 yrs
- 0.0%
- Est. flood insurance / yr
- $507 – $1,088
Fire risk 5/10 · Moderate
- Est. fire insurance / yr
- $947 – $1,759
Heat risk 10/10 · Severe
- Hot days now (above 106°F)
- 7 days/yr
- Hot days in 30 yrs
- 25 days/yr
Wind risk 10/10 · Severe
- Chance of severe wind over 30 yrs
- 99.0%
Air-quality risk 2/10 · Minimal
- Unhealthy air days now
- 1 days/yr
- Unhealthy air days in 30 yrs
- 1 days/yr
Risk factors via First Street. Map © Google.
Why this score? — see what drove the D grade
The composite is a weighted blend of 9 inputs, each scored 0–100. Each bar is that input's sub-score; the figure is the points it added to the 100-point composite (weight × sub-score).
- Cash flow +19.7/30.0
- DSCR +6.2/10.0
- 1% rule +5.9/10.0
- Schools +3.7/10.0
- Rent growth +3.0/5.0
- Livability +2.5/5.0
- Condition / age +2.5/5.0
- ARV discount +0.0/15.0
- Appreciation +0.0/10.0
$199,900
🖨 Deal sheet 📄 Offer letter ✓ Due diligence
Listing remarks
Beautiful corner . .. nicely landscaped. lovely 3/2/1 carport, big 30 x 12 screened porch, shed 15 x 10 with electric. Huge kitchen, granite counter tops WITH BREAKFAST BAR AND stainless appliances. Laundry rm with washer & dryer. luxury vinyl floors, carpet in bedrooms. Sprinkler system. Home well maintained. NOTE: Land Leased property
Key facts
- Landscaped
- Shed with electric
- Stainless appliances
Tags
Property features AI
Finance
- Other: Senior community
- Financial info: Pets allowed with restrictions and limits
- HOA & community: Community association with multiple amenities including clubhouse, fitness center, pool, tennis and pickleball courts, golf, bocce, billiard room, business center, cafe/restaurant, library, sauna, putting green, shuffleboard, street lights, manager on site; Internet included; Monthly association fee
Exterior
- Parking: Attached carport (covered, 1 space)
- Security: Smoke detector(s)
- Utilities: Public water; Public sewer; Three-phase electric; Cable available
- Home design: Manufactured home; Single-story; Faces southwest; Resale condition; Located east of US-1
- Construction: Modular construction; Manufactured roof
- Exterior features: Screened porch and additional porch; Shed(s); Corner lot; Not waterfront
Interior
- Kitchen: Dishwasher; Electric range; Microwave; Refrigerator; Garbage disposal; Electric water heater
- Bedrooms: One bedroom on the main level
- Flooring: Carpet; Ceramic tile; Laminate
- Bathrooms: Two full bathrooms (one on the main level)
- Heating & cooling: Central electric heating; Central air conditioning; Electric cooling with paddle fans
- Interior features: Cathedral and vaulted ceilings; Entrance foyer; Walk-in closet(s); Roman tub; Skylight(s); Blinds and sliding window features
- Laundry & utility: Indoor laundry
Neighborhood map
What this means for you Summary
Snapshot
- This is a 3-bed/2.0-bath manufactured listed at $200k.
Deal economics
- At list price, monthly cash flow is $233 ($3k/yr) — positive.
- The deal already cash-flows at list — no discount required.
- Meets the 1% rule at list price ($2k rent vs $200k).
- Recommended offer: $176k (12.0% below list) — sets the bar for market timing.
- Cap rate 7.7% vs local median 3.9% in Port St. Lucie — top-decile yield for the area; either an underpriced asset or a hidden risk that comps aren't pricing in. Stress-test before assuming the spread holds.
Location & tenants
- Location reads: area grade D — affects rentability + tenant quality, not the cash-flow math above.
- St. Lucie (urban): math 40% / reading 48% proficiency, ranked #51 of 73 in FL (top 70%) — families likely to look elsewhere, expect single-tenant / working-renter base with shorter leases.
- Market conditions: Rents rising (+1.9%/yr); 639 active listings in the ZIP; 4 comparable units currently listed for rent nearby; rentals at typical pace (median 23d on market — plan ~3-4 weeks tenant-placement turnaround); 4,868 units permitted in St. Lucie County in 2024 (268 in 5+ unit buildings).
- This rent runs 42% of the median local income ($62k/yr) — at the standard rent-burdened threshold; future hikes will face affordability resistance.
Forward outlook
- Local home prices are declining (-3.0%/yr); year-one equity from $1k of loan paydown is wiped out by about $6k of value loss. Plan a longer hold.
- St. Lucie County population projected at +20% by 2050 — long-run rental-demand tailwind backs the buy-and-hold thesis.
Negotiation context
- It's been on market 265 days — a 12% lower offer ($176k) is reasonable based on typical stale-listing flexibility.
- 3 sale attempts since 20y ago; this cycle's ask has dropped $50k (20%) from the opening price — seller is motivated, your offer sets the floor, not the list.
Risks & watch-outs
- Climate carrying-cost: severe wind risk, 99% chance of damaging wind over 30y; moderate wildfire risk; extreme-heat days projected 7→25/yr by 2055 (HVAC capex compounding) — expect insurance premiums to compound above CPI over the hold.
Questions for the listing agent
- It's been on market 265 days. Have you received any prior offers? Is the seller open to a 12% concession, seller financing, or rate buy-down credit?
- What does the HOA fee cover, when was the last increase, and are there any pending special assessments or reserve-fund shortfalls?
- Why hasn't it sold? Are there any deal-killer items the seller is aware of (foundation, flood, title, zoning, code violations)?
- Is there a deadline driving the sale (1031 exchange, divorce, estate, relocation)? That informs how much negotiation room exists.
- The area grade is low — what's the realistic commute time and amenity access for the typical tenant pool here? Any planned neighborhood developments (good or bad) we should know about?
- What's the average days-on-market for RENTAL listings here right now (not sales)? A rising rental-DOM trend means longer vacancies and softer asking-rent achievability than the comps imply.
- What's the recent tenant-quality profile in this submarket — average credit score on applications, eviction rate, late-payment / NSF rate, and stable-employment percentage? A property-management company in the area should have these aggregated.
- How much new for-sale + rental construction is in the pipeline within 1–3 miles? Heavy new supply typically softens prices + rents 12–24 months out; constrained supply supports both.
Investment metrics
- 1% rule
- 1.09% ✓
- Cap rate
- 7.69%
- Cash-on-cash
- 5.00%
- DSCR
- 1.22
- GRM
- 7.7
CMA / ARV
- ARV (on-the-fly)
- $161,964
- Comps found
- 12
Show comp detail 12 sales within ~0.75 mi
| Address | Dist | Beds/Ba | Sqft | Sold | Price | $/sf | Match |
|---|---|---|---|---|---|---|---|
| 7822 White Ibis Ln | 0.20mi | 3/2.0 | 1,612 (-2%) | 2mo | $115,000 | $71 | 87 |
| 2968 Eagles Nest Way | 0.02mi | 3/2.0 | 1,786 (+9%) | 8mo | $199,999 | $112 | 77 |
| 2948 Eagles Nest Way | 0.03mi | 3/2.0 | 1,786 (+9%) | 15mo | $125,000 | $70 | 71 |
| 2852 Eagles Nest Way | 0.15mi | 2/2.0 (-1) | 1,724 (+5%) | 22mo | $165,000 | $96 | 61 |
| 7728 Mcclintock Ct | 0.44mi | 2/2.0 (-1) | 1,692 (+3%) | 11mo | $185,000 | $109 | 60 |
| 2847 Eagles Nest Way | 0.10mi | 3/2.0 | 1,808 (+10%) | 24mo | $279,000 | $154 | 58 |
| 3815 Sandlace Ct | 0.61mi | 3/2.0 | 1,641 (+0%) | 16mo | $190,000 | $116 | 58 |
| 3115 Palm Warbler Ct | 0.23mi | 2/2.0 (-1) | 1,429 (-13%) | 9mo | $140,000 | $98 | 56 |
| 7707 Mcclintock Way | 0.44mi | 2/2.0 (-1) | 1,609 (-2%) | 19mo | $160,000 | $99 | 56 |
| 8112 Long Dr | 0.41mi | 3/2.0 | 1,786 (+9%) | 18mo | $122,000 | $68 | 50 |
| 7928 Meadowlark Ln | 0.57mi | 2/3.0 (-1) | 1,475 (-10%) | 1mo | $65,000 | $44 | 47 |
| 3425 Crabapple Dr | 0.57mi | 2/2.0 (-1) | 1,395 (-15%) | 18mo | $205,000 | $147 | 29 |
Match score weights: distance 35% · size 25% · config 20% · recency 20%. Top-matched comps best support the ARV.
Projected returns pro-forma
-3.0% appreciation · 1.92% rent growth · sell at horizon
- IRR
- -9.8%
- Equity multiple
- 0.65×
- Total profit
- $-19,766
- Equity at exit
- $29,806
- IRR
- -2.0%
- Equity multiple
- 0.87×
- Total profit
- $-7,056
- Equity at exit
- $17,284
Cash invested: $55,972 (down + closing). Projections, not guarantees.
Landlord ↔ Tenant lean methodology
- Overall (STATE)
- 87 Strongly Landlord-Friendly
- State Florida
- 87 Strongly Landlord-Friendly · R+3
- County
- — inherits STATE
- City
- — inherits STATE
ZIP-level market 34952
- Home prices YoY
- -29.6%
- Rents YoY
- 1.9%
- Active inventory
- 639
- Price-to-rent
- 7.7×
Monthly cashflow live
- Estimated rent
- $2,170 medium interval (Pro) →
- Mortgage (P&I)
- −$1,048
- Tax from tax record
- −$63 /mo · $759/yr
- Insurance
- −$83
- HOA
- −$286
- Vacancy / Maint / Mgmt
- −$456
- Net cashflow
- $233
Break-even live
UW: 25.0% down · 7.5% · 30yr · 1.5% tax · 5.0% vac · 8.0% maint · 8.0% mgmt
Financing live
Cash to close
- Down payment
- $49,975
- Closing costs
- $5,997
- Reserves months
- —
- Total cash needed
- —
Loan-product check · same deal, 3 products live
Conventional
25% down · 7.5% · 30yr
- Down + closing
- —
- Monthly P&I
- —
- Monthly cashflow
- —
- DSCR
- —
- Eligible?
- —
Personal DTI + credit; lowest rate.
DSCR
20% down · 8.5% · 30yr
- Down + closing
- —
- Monthly P&I
- —
- Monthly cashflow
- —
- DSCR
- —
- Eligible?
- —
No personal income docs; deal must DSCR.
Hard money
10% down · 12.0% · 12mo
- Down + closing
- —
- Monthly P&I
- —
- Monthly cashflow
- —
- DSCR
- —
- Eligible?
- —
Short-term bridge; refi at stabilization.
Rent comps 4 comps
| Address | Beds | Baths | Sqft | Rent | $/sqft | DOM | Units | Dist |
|---|---|---|---|---|---|---|---|---|
| 1900 Bella Vista Way Port Saint Lucie, FL | 1.0–2.0 | 1.0–2.0 | 995 | $1,764 | $1.77 | 13d | 15 | 1.01mi |
| 3784 Sapodilla Ct Port Saint Lucie, FL | 2.0 | 2.0 | 1121 | $2,300 | $2.05 | 23d | 1 | 1.10mi |
| 71 W Caribbean Port St. Lucie, FL | 2.0 | 2.0 | 1417 | $1,700 | $1.20 | 23d | 1 | 1.41mi |
| 7700 Pine Lakes Blvd Port Saint Lucie, FL | 1.0–3.0 | 1.0–2.0 | 1022 | $2,212 | $2.16 | 13d | 16 | 1.45mi |
HOA detail
- Monthly dues
- $286 · $3,432/yr
- Likely covers
- electric
Listing history 25 events
-
2026-06-19price $199,900 Active 265 DOM
-
2026-06-18days on market $205,000 Active 265 DOM
-
2026-06-17days on market $205,000 Active 264 DOM
-
2026-06-16days on market $205,000 Active 263 DOM
-
2026-06-15days on market $205,000 Active 262 DOM
-
2026-06-14days on market $205,000 Active 260 DOM
-
2026-06-13days on market $205,000 Active 259 DOM
-
2026-06-10days on market $205,000 Active 257 DOM
-
2026-06-09days on market $205,000 Active 256 DOM
-
2026-06-08days on market $205,000 Active 255 DOM
-
2026-06-07days on market $205,000 Active 254 DOM
-
2026-06-05days on market $205,000 Active 251 DOM
-
2026-06-03days on market $205,000 Active 250 DOM
-
2026-06-02days on market $205,000 Active 249 DOM
-
2026-06-01days on market $205,000 Active 248 DOM
-
2026-05-31days on market $205,000 Active 247 DOM
-
2026-05-30days on market $205,000 Active 246 DOM
-
2026-05-24price $205,000
-
2026-01-25price $210,000
-
2025-11-07price $225,000
-
2025-09-24$249,900 Active
-
2015-02-05historical
-
2007-09-17historical
-
2007-06-04$114,900
-
2006-11-21$139,000
ⓘ Source: listings_history table (triggers on properties + properties_extension) + one-shot
backfill from property_details.listing_events for pre-trigger history.
Tax reassessment forecast FL · Resets to sale price
- Current annual tax
- $759 · $63/mo
- Projected year-2 tax
- $1,659 · $138/mo
- Expected delta
- +$900/yr (+$75/mo · 118.6%)
ⓘ Screening estimate from a state-policy table — verify with the county assessor before closing.
Climate risk First Street
- Flood 1/10 Low FEMA zone X (unshaded) · 0% chance over 30 yrs
- Wildfire 5/10 Major
- Heat 10/10 Extreme 7 d/yr ≥106°F today · 25 d/yr by 30 yrs out
- Wind 10/10 Extreme 99% chance of damaging wind over 30 yrs
- Air quality 2/10 Low 1 unhealthy d/yr today · 1 by 30 yrs out
Nearby sold comps map
Loading sold comps map…
Walkable amenities ~0.75 mi
Loading nearby amenities…
Taxation est. · year 1
- Rental income
- $26,039
- − Mortgage interest
- −$11,198
- − Property taxes
- −$759
- − Insurance
- −$1,000
- − Repairs & maintenance
- −$2,083
- − Management
- −$2,083
- − HOA
- −$3,432
- − Depreciation
- −$5,815
- Taxable loss
- −$330
- Est. tax savings @ 24.0%
- +$79
- After-tax cash flow
- $2,880/yr
For passive investors: Depreciation is non-cash, so a rental often shows a tax loss while cash-flowing — sheltering income. Rental losses are passive: they offset passive income freely, and up to $25,000/yr can offset ordinary (W-2) income if you actively participate and your MAGI is under $100k (phasing out to $0 by $150k); unused losses carry forward. On sale, claimed depreciation is recaptured at up to 25%, and gains may owe capital-gains tax (a 1031 exchange can defer both). Figures are a year-1 estimate at your 24.0% rate — not tax advice; consult a CPA.
Schools (NCES district)
- District
- St. Lucie
- NCES district ID
- 1201770
- Math proficiency
- 40% ▼ -11.00%
- Reading proficiency
- 48% ▼ -4.00%
- Median HH income
- $44,737
- Composite
- 37.28/100
- National rank
- #4449
- State rank
- #51 of 73 in FL
Livability — Port St. Lucie
No livability data for this city. (Only ~50 U.S. cities are tracked.)
Census & demographics
- County
- Saint Lucie County · 337,150 people
- City population
- 221,051
- Metro
- Port St. Lucie, FL
- Population (ZIP)
- 42,655
- Household income
- $61,628
- Rent vs Own
- Severe rent burden
- 1759.0
Population outlook (St. Lucie County) Hauer SSP2
- Today (2025)
- 338,016 people
- By 2030
- 355,687 · +5.2%
- By 2040
- 385,521 · +14.1%
- By 2050
- 406,106 · +20.1%
- By 2075
- 441,054 · +30.5%
- By 2100
- 436,885 · +29.2%
Race, ethnicity, and origin ACS 2023
- Neighborhood character
- Diverse neighborhood (Simpson 0.57)
- Race & ethnicity
- White 62% Hispanic / Latino 19% Two or more races 14% Black 10% Asian 3%
- Hispanic origin (detail)
- Mexican 4% Puerto Rican 4% Cuban 2% Dominican 2%
- Common ancestry
- Romanian 3% Lithuanian 2% Hispanic 1%
- Foreign-born
- 18% · Canada, Jamaica, China
- Languages at home
- 76% English-only · Spanish 16% French/Haitian/Cajun 3% Tagalog/Filipino 2%
Political lean MEDSL · St. Lucie
- 2024 margin
- Lean R (+9.1) · D 45.1% · R 54.2%
- 2008→2024 swing
- -21.2pp toward R · 2008: 12.1pp · 2024: -9.1pp
- All cycles
- 2024: R+9.1 2020: R+1.6 2016: R+2.5 2012: D+7.9 2008: D+12.1
Not yet ingested
- Civics
- —
Market trends
- HPI YoY
- ▼ -155.80%
- Current HPI
- 371.0573
- Rent YoY
- ▲ 1.92%
- Metro
- Port St. Lucie, FL
- State GDP YoY
- ▲ 3.28%
- F500 in state
- 36
Industry mix (Fortune 500 HQ in FL)
| Industry | F500 HQs | Revenue |
|---|---|---|
| Industrial Technology | 2 | $29B |
|
||
| Insurance | 2 | $17B |
|
||
| Retail | 1 | $60B |
|
||
| Technology Distribution | 1 | $58B |
|
||
| Homebuilding | 1 | $35B |
|
||
| Technology Manufacturing | 1 | $35B |
|
||
Price history
+47.5% since first listed8 events — show timeline
- 2026-05-24 Price Changed $205,000 Beaches MLS
- 2026-01-25 Price Changed $210,000 Beaches MLS
- 2025-11-07 Price Changed $225,000 Beaches MLS
- 2025-09-24 Listed $249,900 Beaches MLS
- 2015-02-05 Listing Removed — Beaches MLS
- 2007-09-17 Listing Removed — Beaches MLS
- 2007-06-04 Listed $114,900 Beaches MLS
- 2006-11-21 Listed $139,000 Beaches MLS
Property tax history
+1.7%/yrLatest (2025): $759 · +5.5% YoY. Source: county tax records.
Cash-flow waterfall
monthlySold comps — $/sqft
last 12 mo · ≤1 miLoading sold comps…