281 E Wilson Dr · Yates, MI
Flood risk 1/10 · Minimal
- FEMA flood zone
- —
- Chance of flooding over 30 yrs
- 0.0%
- Est. flood insurance / yr
- —
Fire risk 2/10 · Minimal
- Est. fire insurance / yr
- $784 – $1,456
Heat risk 1/10 · Minimal
- Hot days now (above 96°F)
- 7 days/yr
- Hot days in 30 yrs
- 14 days/yr
Wind risk 1/10 · Minimal
- Chance of severe wind over 30 yrs
- —
Air-quality risk 2/10 · Minimal
- Unhealthy air days now
- 1 days/yr
- Unhealthy air days in 30 yrs
- 3 days/yr
Risk factors via First Street. Map © Google.
Why this score? — see what drove the B+ grade
The composite is a weighted blend of 9 inputs, each scored 0–100. Each bar is that input's sub-score; the figure is the points it added to the 100-point composite (weight × sub-score).
- Cash flow +29.2/30.0
- ARV discount +15.0/15.0
- DSCR +10.0/10.0
- 1% rule +7.6/10.0
- Appreciation +5.0/10.0
- Rent growth +2.5/5.0
- Livability +2.5/5.0
- Condition / age +2.5/5.0
- Schools +2.3/10.0
$79,095
🖨 Deal sheet 📄 Offer letter ✓ Due diligence
Listing remarks MLS
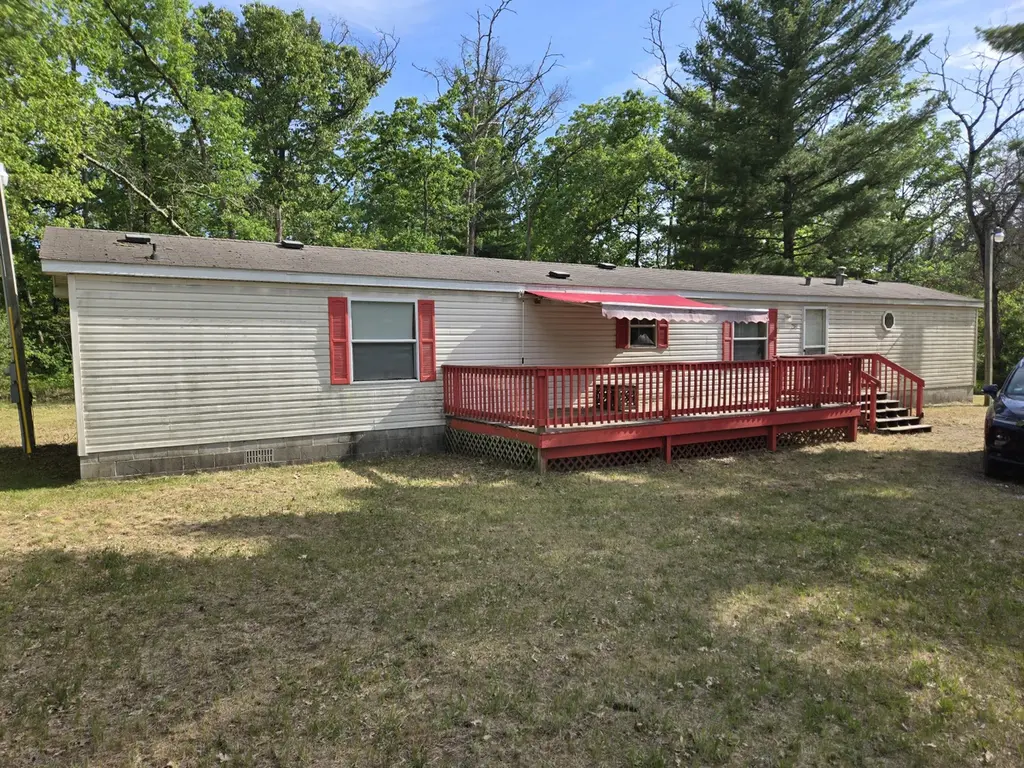
Discover your piece of history at 281 E. Wilson Dr, Idlewild, MI! Nestled in the heart of the historic and culturally significant community of Idlewild, this charming 3-bedroom, 2-bathroom ranch-style home offers a unique opportunity to own a piece of a legendary American landscape. A special place: the ''Black Eden, '' legacy Idlewild is not just a location; it is a profound piece of history. Don't miss your chance to be a part of this enduring story. Whether you are looking for a peaceful retreat or a home with deep cultural roots, this property provides the perfect backdrop. Schedule your showing today to experience the magic of Idlewild for yourself.
Key facts
- 6,375 sq ft lot
- Built 2001
Property features AI
Exterior
- Utilities: Well water; Natural gas available and connected; Electricity available; Natural gas water heater
- Home design: Ranch-style residence; Single-story
- Construction: Built in 2001; Block and vinyl siding construction; Shingle roof; Crawl space basement
- Exterior features: Corner lot; Paved road access
Interior
- Kitchen: Range; Microwave
- Bedrooms: Primary bedroom (approx. 14 x 14); Bedroom 2 (approx. 11.12 x 8); Bedroom 3 (approx. 14 x 8.5)
- Bathrooms: 2 full bathrooms; Primary bathroom (approx. 8 x 14); Bathroom 2 (approx. 7.71 x 4.46)
- Heating & cooling: Forced air heating; Wall air conditioning units
- Interior features: Eat-in kitchen; Screens, insulated windows, and window treatments; 7 total rooms
- Laundry & utility: Washer; Dryer
Neighborhood map
What this means for you Summary
Snapshot
- This is a 3-bed/2.0-bath single-family listed at $79k.
Deal economics
- At list price, monthly cash flow is $276 ($3k/yr) — positive.
- The deal already cash-flows at list — no discount required.
- Meets the 1% rule at list price ($997 rent vs $79k).
Location & tenants
- Location reads: area grade B — affects rentability + tenant quality, not the cash-flow math above.
- Baldwin Community Schools (rural): math 21% / reading 28% proficiency, ranked #618 of 760 in MI (top 81%) — low school quality limits family demand, transient renter base, plan for 1-2y turnover; 85% free/reduced lunch — lower-income household profile, screen leases tightly.
- Market conditions: 45 active listings in the ZIP; 30 units permitted in Lake County in 2024 (0 in 5+ unit buildings).
Forward outlook
- In year one you build about $3k of equity ($547 loan paydown + $2k appreciation (3.0% local appreciation)).
- Lake County population projected at -22% by 2050 — secular population decline; favor cash flow + early exit over multi-decade hold.
- At projected returns (3.0% appreciation + 3.0% rent growth), your $22k cash investment doubles in ~4 years — after that, you're playing with house money.
Negotiation context
- Only 2 days on market — expect competitive offers; lowballing is unlikely to land.
- 3 sale attempts with the ask held roughly flat each time — persistent listings suggest the price (not the market) is what's stuck; bring a comps-based counter.
Questions for the listing agent
- Is there a deadline driving the sale (1031 exchange, divorce, estate, relocation)? That informs how much negotiation room exists.
- What's the average days-on-market for RENTAL listings here right now (not sales)? A rising rental-DOM trend means longer vacancies and softer asking-rent achievability than the comps imply.
- What's the recent tenant-quality profile in this submarket — average credit score on applications, eviction rate, late-payment / NSF rate, and stable-employment percentage? A property-management company in the area should have these aggregated.
- How much new for-sale + rental construction is in the pipeline within 1–3 miles? Heavy new supply typically softens prices + rents 12–24 months out; constrained supply supports both.
Investment metrics
- 1% rule
- 1.26% ✓
- Cap rate
- 10.48%
- Cash-on-cash
- 14.94%
- DSCR
- 1.66
- GRM
- 6.6
CMA / ARV
- ARV (on-the-fly)
- $134,064
- Comps found
- 4
Show comp detail 4 sales within ~0.75 mi
| Address | Dist | Beds/Ba | Sqft | Sold | Price | $/sf | Match |
|---|---|---|---|---|---|---|---|
| 6946 S Lakeview Ave | 0.44mi | 2/1.5 (-1) | 819 (+3%) | 3mo | $138,000 | $168 | 66 |
| 6483 S Emma Ave | 0.38mi | 2/1.0 (-1) | 768 (-4%) | 2mo | $141,000 | $184 | 65 |
| 317 E Baldwin Rd | 0.33mi | 2/1.0 (-1) | 700 (-12%) | 4mo | $18,497 | $26 | 52 |
| 414 E Sandusky | 0.18mi | 2/1.0 (-1) | 900 (+13%) | 19mo | $24,500 | $27 | 46 |
Match score weights: distance 35% · size 25% · config 20% · recency 20%. Top-matched comps best support the ARV.
Projected returns pro-forma
3.0% appreciation · 3.0% rent growth · sell at horizon
- IRR
- 21.5%
- Equity multiple
- 2.22×
- Total profit
- $27,079
- Equity at exit
- $35,565
- IRR
- 22.6%
- Equity multiple
- 4.24×
- Total profit
- $71,798
- Equity at exit
- $54,809
Cash invested: $22,147 (down + closing). Projections, not guarantees.
Landlord ↔ Tenant lean methodology
- Overall (STATE)
- 62 Landlord-Friendly
- State Michigan
- 62 Landlord-Friendly · EVEN
- County
- — inherits STATE
- City
- — inherits STATE
ZIP-level market 49642
- Active inventory
- 45
- Price-to-rent
- 6.6×
Monthly cashflow live
- Estimated rent
- $997 medium interval (Pro) →
- Mortgage (P&I)
- −$415
- Tax from tax record
- −$65 /mo · $774/yr
- Insurance
- −$33
- HOA
- −$0
- Vacancy / Maint / Mgmt
- −$209
- Net cashflow
- $276
Break-even live
UW: 25.0% down · 7.5% · 30yr · 1.5% tax · 5.0% vac · 8.0% maint · 8.0% mgmt
Financing live
Cash to close
- Down payment
- $19,774
- Closing costs
- $2,373
- Reserves months
- —
- Total cash needed
- —
Loan-product check · same deal, 3 products live
Conventional
25% down · 7.5% · 30yr
- Down + closing
- —
- Monthly P&I
- —
- Monthly cashflow
- —
- DSCR
- —
- Eligible?
- —
Personal DTI + credit; lowest rate.
DSCR
20% down · 8.5% · 30yr
- Down + closing
- —
- Monthly P&I
- —
- Monthly cashflow
- —
- DSCR
- —
- Eligible?
- —
No personal income docs; deal must DSCR.
Hard money
10% down · 12.0% · 12mo
- Down + closing
- —
- Monthly P&I
- —
- Monthly cashflow
- —
- DSCR
- —
- Eligible?
- —
Short-term bridge; refi at stabilization.
Listing history 3 events
-
2026-06-18days on market $79,095 Active 2 DOM
-
2026-06-17remarks 662-char remark
-
2026-06-17$79,095 Active 1 DOM
ⓘ Source: listings_history table (triggers on properties + properties_extension) + one-shot
backfill from property_details.listing_events for pre-trigger history.
Tax reassessment forecast MI · Partial reset (capped growth)
- Current annual tax
- $774 · $65/mo
- Projected year-2 tax
- $996 · $83/mo
- Expected delta
- +$222/yr (+$18/mo · 28.6%)
ⓘ Screening estimate from a state-policy table — verify with the county assessor before closing.
Climate risk First Street
- Flood 1/10 Low 0% chance over 30 yrs
- Wildfire 2/10 Low
- Heat 1/10 Low 7 d/yr ≥96°F today · 14 d/yr by 30 yrs out
- Wind 1/10 Low
- Air quality 2/10 Low 1 unhealthy d/yr today · 3 by 30 yrs out
Nearby sold comps map
Loading sold comps map…
Walkable amenities ~0.75 mi
Loading nearby amenities…
Taxation est. · year 1
- Rental income
- $11,969
- − Mortgage interest
- −$4,431
- − Property taxes
- −$774
- − Insurance
- −$395
- − Repairs & maintenance
- −$957
- − Management
- −$957
- − Depreciation
- −$2,301
- Taxable income
- $2,152
- Est. tax owed @ 24.0%
- −$517
- After-tax cash flow
- $2,791/yr
For passive investors: Depreciation is non-cash, so a rental often shows a tax loss while cash-flowing — sheltering income. Rental losses are passive: they offset passive income freely, and up to $25,000/yr can offset ordinary (W-2) income if you actively participate and your MAGI is under $100k (phasing out to $0 by $150k); unused losses carry forward. On sale, claimed depreciation is recaptured at up to 25%, and gains may owe capital-gains tax (a 1031 exchange can defer both). Figures are a year-1 estimate at your 24.0% rate — not tax advice; consult a CPA.
Schools (NCES district)
- District
- Baldwin Community Schools
- NCES district ID
- 2603810
- Math proficiency
- 21% ▲ 3.00%
- Reading proficiency
- 28% ▼ -2.00%
- Median HH income
- $27,638
- Composite
- 22.56/100
- National rank
- #13447
- State rank
- #618 of 760 in MI
Livability — Yates
No livability data for this city. (Only ~50 U.S. cities are tracked.)
Census & demographics
- Population (ZIP)
- 1,062
Population outlook (Lake County) Hauer SSP2
- Today (2025)
- 10,933 people
- By 2030
- 10,503 · -3.9%
- By 2040
- 9,470 · -13.4%
- By 2050
- 8,526 · -22.0%
- By 2075
- 7,160 · -34.5%
- By 2100
- 5,634 · -48.5%
Race, ethnicity, and origin ACS 2023
- Neighborhood character
- Diverse neighborhood (Simpson 0.61)
- Race & ethnicity
- White 46% Black 42% Two or more races 9% Hispanic / Latino 3%
- Common ancestry
- German 2% Lithuanian 2% Romanian 2%
- Foreign-born
- 1%
- Languages at home
- 98% English-only · German/W. Germanic 1% Spanish 1%
Political lean MEDSL · Lake
- 2024 margin
- Solid R (+32.2) · D 33.2% · R 65.4% · Other 1.4%
- 2008→2024 swing
- -44.5pp toward R · 2008: 12.3pp · 2024: -32.2pp
- All cycles
- 2024: R+32.2 2020: R+26.2 2016: R+22.9 2012: D+5.0 2008: D+12.3
Not yet ingested
- Civics
- —
Market trends
- HPI YoY
- —
- Current HPI
- —
- Rent YoY
- —
- Metro
- —
- State GDP YoY
- ▲ 1.37%
- F500 in state
- 28
Industry mix (Fortune 500 HQ in MI)
| Industry | F500 HQs | Revenue |
|---|---|---|
| Automotive Parts | 3 | $48B |
|
||
| Automotive | 2 | $372B |
|
||
| Chemicals | 1 | $45B |
|
||
| Automotive Retail | 1 | $29B |
|
||
| Healthcare / Medical Devices | 1 | $23B |
|
||
| Automotive Technology | 1 | $20B |
|
||
Price history
+0.0% since first listed3 events — show timeline
- 2026-05-10 Listed $79,095 REALCOMP
- 2026-05-10 Listed $79,095 MiRealSource-MiMLS
- 2026-05-10 Listed $79,095 SW Michigan MLS
Property tax history
+2.5%/yrLatest (2024): $774 · +4.7% YoY. Source: county tax records.
Cash-flow waterfall
monthlySold comps — $/sqft
last 12 mo · ≤1 miLoading sold comps…