 Duplex
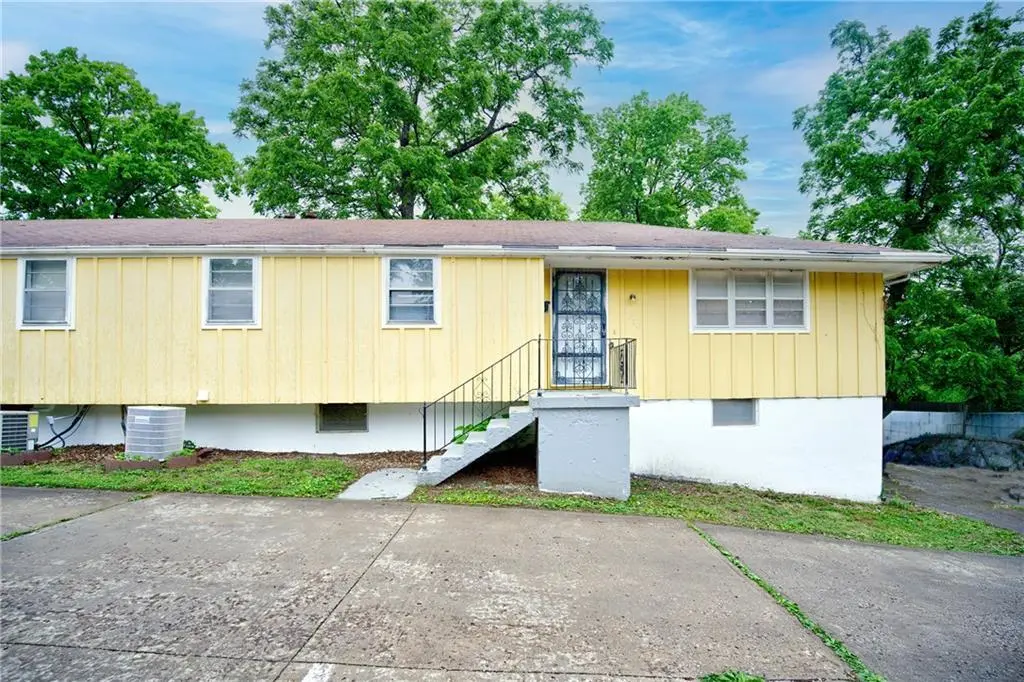
1836 E 78th St · Kansas City, MO
Flood risk 1/10 · Minimal
- FEMA flood zone
- X (unshaded)
- Chance of flooding over 30 yrs
- 0.0%
- Est. flood insurance / yr
- $507 – $1,088
Fire risk 1/10 · Minimal
- Est. fire insurance / yr
- $1,054 – $1,958
Heat risk 4/10 · Minor
- Hot days now (above 106°F)
- 7 days/yr
- Hot days in 30 yrs
- 17 days/yr
Wind risk 2/10 · Minimal
- Chance of severe wind over 30 yrs
- —
Air-quality risk 3/10 · Minor
- Unhealthy air days now
- 2 days/yr
- Unhealthy air days in 30 yrs
- 4 days/yr
Risk factors via First Street. Map © Google.
Why this score? — see what drove the C+ grade
The composite is a weighted blend of 9 inputs, each scored 0–100. Each bar is that input's sub-score; the figure is the points it added to the 100-point composite (weight × sub-score).
- Cash flow +21.2/30.0
- Appreciation +10.0/10.0
- ARV discount +7.5/15.0
- DSCR +6.8/10.0
- 1% rule +4.8/10.0
- Livability +3.9/5.0
- Rent growth +3.2/5.0
- Condition / age +2.5/5.0
- Schools +1.5/10.0
$250,000
🖨 Deal sheet 📄 Offer letter ✓ Due diligence
Multi-family units
County records classify this as Multi-Family (2-4 Unit). Listing-text estimate: 2 units. confirmed
Key facts
- 0.26 acre lot
- Garage
- Built 1965
Property features AI
Finance
- Other: Property not in flood plain; Lot approximately 0.26 acres (public records)
- Financial info: Operating expenses include other items (multi-family); No maintenance provided (community)
Exterior
- Parking: Assigned parking; Attached garage; Garage available; On-street parking; Total of 4 parking spaces
- Security: Smoke detectors
- Utilities: Public water; Public sewer; 100 amp electric service; Cable and high-speed internet available; Public road (paved) with public maintenance
- Home design: Duplex residential income property; Single-story (one story total); Zoned CITY
- Construction: Brick veneer and frame construction; Composition roof
- Exterior features: Private entrance
Interior
- Kitchen: Dishwasher; Range/oven; Refrigerator; Garbage disposal; Hot water heater
- Bedrooms: Two 3-bedroom units; Additional unit types include 4+ bedroom options
- Bathrooms: Each 3-bedroom unit has 3 bathrooms (includes 2 half bathrooms listed across units)
- Heating & cooling: Forced air heating; Multi-unit electric cooling; Individually metered heat and air
- Interior features: Appliances apply to all units; Disposal; Refrigerator; Electric range; Gas range
- Laundry & utility: Laundry located in basement; Individual water heaters; Central water heater listed; Separate meters
Neighborhood map
What this means for you Summary
Snapshot
- This is a 2 × 2-bed/1-bath units multifamily listed at $250k.
Deal economics
- At list price, monthly cash flow is $363 ($4k/yr) — positive. Per door: $182/mo.
- The deal already cash-flows at list — no discount required.
- To meet the 1% rule (rent ≥ 1% of price), the offer needs to be $244k (2.4% below list).
- Recommended offer: $244k (2.4% below list) — sets the bar for 1% rule.
- Cap rate 8.0% vs local median 3.9% in Kansas City — top-decile yield for the area; either an underpriced asset or a hidden risk that comps aren't pricing in. Stress-test before assuming the spread holds.
Location & tenants
- Location reads 78/100 on livability (#28 in MO, #2,671 nationally) — a middle-class / working-renter tenant base. Strengths: amenities A+, commute A+, cost of living A+; Watch: crime F.
- Kansas City 33 (urban): math 12% / reading 24% proficiency, ranked #308 of 324 in MO (top 95%) — low school quality limits family demand, transient renter base, plan for 1-2y turnover; 75% free/reduced lunch — lower-income household profile, screen leases tightly.
- Zoned schools: John T. Hartman Elementary (math 17% / reading 17%, grade F, #967 of 1,115 statewide, top 88%, 317 students, 99% FRL); Southeast High School (math 2% / reading 12%, grade F, #512 of 521 statewide, top 99%, 487 students, 99% FRL) — zoned schools average 99% FRL vs 75% district-wide (24 pts higher); higher-poverty schools than district average — tighter screening recommended.
- Market conditions: Rents rising (+3.0%/yr); 93 active listings in the ZIP; 4,002 units permitted in Jackson County in 2024 (2,271 in 5+ unit buildings).
- At $2,440/mo this rent would consume 64% of the median local household income ($46k/yr) (locally 679% of renters already pay >50% of income on rent) — very limited rent-growth headroom before tenants either downsize or default.
Forward outlook
- In year one you build about $27k of equity ($2k loan paydown + $25k appreciation (10.0% local appreciation)).
- Jackson County population projected at +4% by 2050 — modest demand growth; plan on rents tracking national, not racing it.
- At projected returns (10.0% appreciation + 3.0% rent growth), your $70k cash investment doubles in ~3 years — after that, you're playing with house money.
- By year 2, paydown + projected appreciation supports a ~$43k cash-out refi (75% LTV) — recoverable capital for the next deal without selling this one.
Negotiation context
- It's been on market 16 days — a 2% lower offer ($246k) is reasonable based on typical stale-listing flexibility.
Questions for the listing agent
- Can we see the unit-by-unit rent roll, current vacancy, and any below-market leases? What's the average tenancy length?
- What capital expenditures (roof, boiler, parking lot, exteriors) have been made in the last 5 years, and what's planned in the next 2?
- Built in 1965 — when were the roof, HVAC, electrical panel, plumbing, and water heater last replaced?
- Is there a deadline driving the sale (1031 exchange, divorce, estate, relocation)? That informs how much negotiation room exists.
- Crime grade is F in this area — have there been break-ins, vandalism, or insurance claims at this property in the last 3 years? What carrier currently insures it and at what premium?
- What's the average days-on-market for RENTAL listings here right now (not sales)? A rising rental-DOM trend means longer vacancies and softer asking-rent achievability than the comps imply.
- What's the recent tenant-quality profile in this submarket — average credit score on applications, eviction rate, late-payment / NSF rate, and stable-employment percentage? A property-management company in the area should have these aggregated.
- How much new apartment / multifamily construction is in the pipeline within 1–3 miles? Heavy new supply (>2% of stock underway) typically softens rents 12–24 months out; light construction supports rent growth.
Investment metrics
- 1% rule
- 0.98% ✗
- Cap rate
- 8.04%
- Cash-on-cash
- 6.22%
- DSCR
- 1.28
- GRM
- 8.5
CMA / ARV
- ARV (on-the-fly)
- $165,564
- Comps found
- 1
Show comp detail 1 sale within ~0.75 mi
| Address | Dist | Beds/Ba | Sqft | Sold | Price | $/sf | Match |
|---|---|---|---|---|---|---|---|
| 7439 Arleta Blvd | 0.46mi | 6/3.0 | 2,415 (+6%) | 18mo | $177,400 | $73 | 53 |
Match score weights: distance 35% · size 25% · config 20% · recency 20%. Top-matched comps best support the ARV.
Projected returns pro-forma
10.0% appreciation · 2.98% rent growth · sell at horizon
- IRR
- 28.8%
- Equity multiple
- 3.27×
- Total profit
- $159,171
- Equity at exit
- $225,220
- IRR
- 25.0%
- Equity multiple
- 7.43×
- Total profit
- $450,319
- Equity at exit
- $485,695
Cash invested: $70,000 (down + closing). Projections, not guarantees.
Landlord ↔ Tenant lean methodology
- Overall (STATE)
- 81 Strongly Landlord-Friendly
- State Missouri
- 81 Strongly Landlord-Friendly · R+10
- County
- — inherits STATE
- City
- — inherits STATE
ZIP-level market 64132
- Home prices YoY
- 23.6%
- Rents YoY
- 3.0%
- Active inventory
- 93
- Price-to-rent
- 17.1×
Monthly cashflow live
- Estimated rent
- $2,440 high interval (Pro) →
- Mortgage (P&I)
- −$1,311
- Tax from tax record
- −$149 /mo · $1,792/yr
- Insurance
- −$104
- HOA
- −$0
- Vacancy / Maint / Mgmt
- −$512
- Net cashflow
- $363
Break-even live
2-unit breakdown (identical units grouped — click to expand)
| Units | Beds | Baths | Est. rent |
|---|---|---|---|
| 2× units | 2 | 1 | $2,440 |
| #1 | 2 | 1 | $1,220 |
| #2 | 2 | 1 | $1,220 |
| Total (2 units) | $2,440 | ||
UW: 25.0% down · 7.5% · 30yr · 1.5% tax · 5.0% vac · 8.0% maint · 8.0% mgmt
Financing live
Cash to close
- Down payment
- $62,500
- Closing costs
- $7,500
- Reserves months
- —
- Total cash needed
- —
Loan-product check · same deal, 3 products live
Conventional
25% down · 7.5% · 30yr
- Down + closing
- —
- Monthly P&I
- —
- Monthly cashflow
- —
- DSCR
- —
- Eligible?
- —
Personal DTI + credit; lowest rate.
DSCR
20% down · 8.5% · 30yr
- Down + closing
- —
- Monthly P&I
- —
- Monthly cashflow
- —
- DSCR
- —
- Eligible?
- —
No personal income docs; deal must DSCR.
Hard money
10% down · 12.0% · 12mo
- Down + closing
- —
- Monthly P&I
- —
- Monthly cashflow
- —
- DSCR
- —
- Eligible?
- —
Short-term bridge; refi at stabilization.
Listing history 13 events
-
2026-06-18days on market $250,000 Active 16 DOM
-
2026-06-17days on market $250,000 Active 15 DOM
-
2026-06-16days on market $250,000 Active 14 DOM
-
2026-06-15days on market $250,000 Active 13 DOM
-
2026-06-13days on market $250,000 Active 11 DOM
-
2026-06-09days on market $250,000 Active 7 DOM
-
2026-06-08days on market $250,000 Active 6 DOM
-
2026-06-07days on market $250,000 Active 5 DOM
-
2026-06-05days on market $250,000 Active 2 DOM
-
2026-06-03statusdays on market $250,000 Active 1 DOM
-
2026-06-02days on market $250,000 Coming Soon 4 DOM
-
2026-06-01days on market $250,000 Coming Soon 3 DOM
-
2026-05-31days on market $250,000 Coming Soon 2 DOM
ⓘ Source: listings_history table (triggers on properties + properties_extension) + one-shot
backfill from property_details.listing_events for pre-trigger history.
Tax reassessment forecast MO · Resets to sale price
- Current annual tax
- $1,792 · $149/mo
- Projected year-2 tax
- $2,425 · $202/mo
- Expected delta
- +$633/yr (+$53/mo · 35.4%)
ⓘ Screening estimate from a state-policy table — verify with the county assessor before closing.
Climate risk First Street
- Flood 1/10 Low FEMA zone X (unshaded) · 0% chance over 30 yrs
- Wildfire 1/10 Low
- Heat 4/10 Moderate 7 d/yr ≥106°F today · 17 d/yr by 30 yrs out
- Wind 2/10 Low
- Air quality 3/10 Moderate 2 unhealthy d/yr today · 4 by 30 yrs out
Nearby sold comps map
Loading sold comps map…
Walkable amenities ~0.75 mi
Loading nearby amenities…
Taxation est. · year 1
- Rental income
- $29,280
- − Mortgage interest
- −$14,004
- − Property taxes
- −$1,792
- − Insurance
- −$1,250
- − Repairs & maintenance
- −$2,342
- − Management
- −$2,342
- − Depreciation
- −$7,273
- Taxable income
- $277
- Est. tax owed @ 24.0%
- −$66
- After-tax cash flow
- $4,291/yr
For passive investors: Depreciation is non-cash, so a rental often shows a tax loss while cash-flowing — sheltering income. Rental losses are passive: they offset passive income freely, and up to $25,000/yr can offset ordinary (W-2) income if you actively participate and your MAGI is under $100k (phasing out to $0 by $150k); unused losses carry forward. On sale, claimed depreciation is recaptured at up to 25%, and gains may owe capital-gains tax (a 1031 exchange can defer both). Figures are a year-1 estimate at your 24.0% rate — not tax advice; consult a CPA.
Schools (NCES district)
- District
- Kansas City 33
- NCES district ID
- 2916400
- Math proficiency
- 12% ▼ -8.00%
- Reading proficiency
- 24% ▬ 0.00%
- Median HH income
- $35,227
- Composite
- 14.8/100
- National rank
- #9387
- State rank
- #308 of 324 in MO
Livability — Kansas City
- Score
- 78/100
- State rank
- #28
- US rank
- #2671
Category grades
Schools grade is shown separately in the Schools card above.
Census & demographics
- Census place
- Kansas City, MO
- County
- Jackson County · 687,798 people
- City population
- 439,467
- Metro
- Kansas City, MO-KS
- Population (ZIP)
- 12,084
- Household income
- $45,622
- Rent vs Own
- Severe rent burden
- 679.0
Population outlook (Jackson County) Hauer SSP2
- Today (2025)
- 719,589 people
- By 2030
- 731,456 · +1.6%
- By 2040
- 746,689 · +3.8%
- By 2050
- 749,289 · +4.1%
- By 2075
- 736,227 · +2.3%
- By 2100
- 668,210 · -7.1%
Race, ethnicity, and origin ACS 2023
- Neighborhood character
- Predominantly Black (66%)
- Race & ethnicity
- Black 66% White 16% Hispanic / Latino 11% Two or more races 10%
- Hispanic origin (detail)
- Mexican 9%
- Common ancestry
- Italian 2% Scotch-Irish 1% Romanian 1%
- Foreign-born
- 6% · Canada, Jamaica
- Languages at home
- 92% English-only · Spanish 7%
Political lean MEDSL · Jackson
- 2024 margin
- D (+19.3) · D 58.9% · R 39.5% · Other 1.6%
- 2008→2024 swing
- -6.1pp toward R · 2008: 25.4pp · 2024: 19.3pp
- All cycles
- 2024: D+19.3 2020: D+22.0 2016: D+16.6 2012: D+19.0 2008: D+25.4
Not yet ingested
- Civics
- —
Market trends
- HPI YoY
- ▲ 79.13%
- Current HPI
- 414.4305
- Rent YoY
- ▲ 2.98%
- Metro
- Kansas City, MO-KS
- State GDP YoY
- ▲ 1.84%
- F500 in state
- 20
Industry mix (Fortune 500 HQ in MO)
| Industry | F500 HQs | Revenue |
|---|---|---|
| Healthcare | 1 | $163B |
|
||
| Insurance | 1 | $21B |
|
||
| Industrial Technology | 1 | $17B |
|
||
| Retail | 1 | $16B |
|
||
| Industrial Distribution | 1 | $10B |
|
||
| Utilities | 1 | $9B |
|
||
Price history
-13.5% since first listed4 events — show timeline
- 2026-05-29 Coming Soon $250,000 Heartland MLS as Distributed by MLS Grid
- 2020-11-24 Listing Removed — Heartland MLS as Distributed by MLS Grid
- 2020-11-19 Price Changed $255,000 Heartland MLS as Distributed by MLS Grid
- 2020-11-08 Listed $289,000 Heartland MLS as Distributed by MLS Grid
Property tax history
+11.6%/yrLatest (2025): $1,792 · +11.1% YoY. Source: county tax records.
Cash-flow waterfall
monthlySold comps — $/sqft
last 12 mo · ≤1 miLoading sold comps…