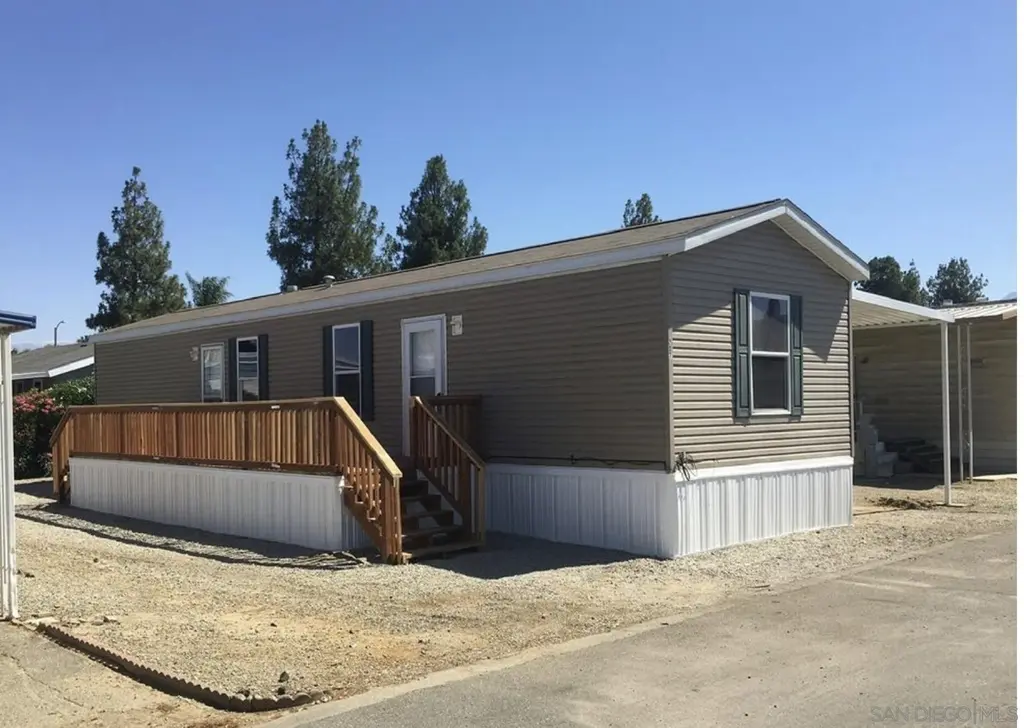
725 W Thornton Ave #72 · Hemet, CA
Flood risk 1/10 · Minimal
- FEMA flood zone
- X (unshaded)
- Chance of flooding over 30 yrs
- 0.0%
- Est. flood insurance / yr
- $507 – $1,088
Fire risk 7/10 · Major
- Est. fire insurance / yr
- $659 – $1,223
Heat risk 7/10 · Major
- Hot days now (above 104°F)
- 6 days/yr
- Hot days in 30 yrs
- 16 days/yr
Wind risk 1/10 · Minimal
- Chance of severe wind over 30 yrs
- —
Air-quality risk 6/10 · Moderate
- Unhealthy air days now
- 9 days/yr
- Unhealthy air days in 30 yrs
- 11 days/yr
Risk factors via First Street. Map © Google.
Why this score? — see what drove the B grade
The composite is a weighted blend of 9 inputs, each scored 0–100. Each bar is that input's sub-score; the figure is the points it added to the 100-point composite (weight × sub-score).
- Cash flow +30.0/30.0
- ARV discount +12.5/15.0
- 1% rule +10.0/10.0
- DSCR +10.0/10.0
- Condition / age +3.8/5.0
- Rent growth +2.9/5.0
- Livability +2.6/5.0
- Schools +2.5/10.0
- Appreciation +0.0/10.0
$79,900
🖨 Deal sheet 📄 Offer letter ✓ Due diligence
Listing remarks MLS
Welcome home to this charming two-bedroom, one-bath retreat nestled in the heart of London Spires, a beautifully maintained 55+ community. This delightful home exudes warmth and character, with a welcoming front porch perfect for sipping morning coffee or enjoying the peaceful surroundings. Inside, you’ll find a thoughtfully designed layout with inviting living spaces, cozy bedrooms, and a well-appointed bath. The home is offering both comfort and convenience in a serene setting. Experience the best of community living in this picturesque haven! Low space rent of $730/month
Key facts
- 2 parking spots
- Community pool
- Built 2020
Neighborhood map
What this means for you Summary
Snapshot
- This is a 2-bed/1.0-bath manufactured listed at $80k. Condition is rated good.
Deal economics
- At list price, monthly cash flow is $859 ($10k/yr) — positive.
- The deal already cash-flows at list — no discount required.
- Meets the 1% rule at list price ($2k rent vs $80k).
- Recommended offer: $70k (12.0% below list) — sets the bar for market timing.
- Cap rate 19.2% vs local median 4.9% in Hemet — top-decile yield for the area; either an underpriced asset or a hidden risk that comps aren't pricing in. Stress-test before assuming the spread holds.
Location & tenants
- Location reads 51/100 on livability (#1,056 in CA) — a working-class tenant base; expect higher turnover. Strengths: housing A+; Watch: crime D+, schools F, amenities F.
- Hemet Unified (suburban): math 19% / reading 41% proficiency, ranked #360 of 517 in CA (top 70%) — families likely to look elsewhere, expect single-tenant / working-renter base with shorter leases; 66% free/reduced lunch — lower-income household profile, screen leases tightly.
- Market conditions: Rents rising (+1.8%/yr); 264 active listings in the ZIP; 5 comparable units currently listed for rent nearby; rentals leasing fast (median 5d on market — plan ~1-2 weeks tenant-placement turnaround); 9,195 units permitted in Riverside County in 2024 (1,512 in 5+ unit buildings).
- This rent runs 43% of the median local income ($49k/yr) — at the standard rent-burdened threshold; future hikes will face affordability resistance.
Forward outlook
- Local home prices are declining (-3.0%/yr); year-one equity from $552 of loan paydown is wiped out by about $2k of value loss. Plan a longer hold.
- Riverside County population projected at +22% by 2050 — long-run rental-demand tailwind backs the buy-and-hold thesis.
- At projected returns (-3.0% appreciation + 1.8% rent growth), your $22k cash investment doubles in ~3 years — after that, you're playing with house money.
Negotiation context
- It's been on market 498 days — a 12% lower offer ($70k) is reasonable based on typical stale-listing flexibility.
Risks & watch-outs
- Climate carrying-cost: major wildfire risk; extreme-heat days projected 6→16/yr by 2055 (HVAC capex compounding) — expect insurance premiums to compound above CPI over the hold.
Questions for the listing agent
- It's been on market 498 days. Have you received any prior offers? Is the seller open to a 12% concession, seller financing, or rate buy-down credit?
- Why hasn't it sold? Are there any deal-killer items the seller is aware of (foundation, flood, title, zoning, code violations)?
- Is there a deadline driving the sale (1031 exchange, divorce, estate, relocation)? That informs how much negotiation room exists.
- Schools are F-rated, which usually means shorter tenancies and higher turnover. Who's the typical renter profile here, and what's been the actual vacancy rate?
- Crime grade is D in this area — have there been break-ins, vandalism, or insurance claims at this property in the last 3 years? What carrier currently insures it and at what premium?
- What's the average days-on-market for RENTAL listings here right now (not sales)? A rising rental-DOM trend means longer vacancies and softer asking-rent achievability than the comps imply.
- What's the recent tenant-quality profile in this submarket — average credit score on applications, eviction rate, late-payment / NSF rate, and stable-employment percentage? A property-management company in the area should have these aggregated.
- How much new for-sale + rental construction is in the pipeline within 1–3 miles? Heavy new supply typically softens prices + rents 12–24 months out; constrained supply supports both.
Investment metrics
- 1% rule
- 2.24% ✓
- Cap rate
- 19.20%
- Cash-on-cash
- 46.08%
- DSCR
- 3.05
- GRM
- 3.7
CMA / ARV
- ARV (median comp)
- $90,000
- List price
- $79,900
- Delta
- -11.22%
- Verdict
- UNDERPRICED
- Comps
- 20 within 1.0 mi
Show comp detail 12 sales within ~0.75 mi
| Address | Dist | Beds/Ba | Sqft | Sold | Price | $/sf | Match |
|---|---|---|---|---|---|---|---|
| 725 W Thornton Ave #115 | 0.06mi | 2/2.0 | 672 (-10%) | 10mo | $40,000 | $60 | 68 |
| 893 S Palm | 0.55mi | 2/1.0 | 720 (-4%) | 3mo | $90,000 | $125 | 66 |
| 1200 W Johnston | 0.61mi | 2/1.0 | 720 (-4%) | 1mo | $87,000 | $121 | 65 |
| 631 Santa Clara | 0.62mi | 1/1.0 (-1) | 750 (+0%) | 2mo | $118,000 | $157 | 63 |
| 1635 Santa Susana Dr | 0.58mi | 2/1.0 | 800 (+7%) | 2mo | $135,000 | $169 | 59 |
| 851 San Rafael Dr | 0.64mi | 2/1.0 | 720 (-4%) | 10mo | $145,000 | $201 | 56 |
| 873 San Ignacio | 0.58mi | 2/2.0 | 800 (+7%) | 1mo | $125,000 | $156 | 56 |
| 1097 N state St #101 | 0.59mi | 2/1.5 | 800 (+7%) | 4mo | $94,000 | $118 | 55 |
| 670 Santa Clara | 0.59mi | 1/1.0 (-1) | 807 (+8%) | 0mo | $90,000 | $112 | 54 |
| 1536 S State St #29 | 0.55mi | 2/2.0 | 800 (+7%) | 6mo | $89,999 | $112 | 53 |
| 810 San Ynez Dr | 0.74mi | 2/2.0 | 800 (+7%) | 3mo | $85,000 | $106 | 47 |
| 590 Santa Clara Cir | 0.63mi | 2/1.0 | 640 (-14%) | 10mo | $120,000 | $188 | 39 |
Match score weights: distance 35% · size 25% · config 20% · recency 20%. Top-matched comps best support the ARV.
Projected returns pro-forma
-3.0% appreciation · 1.76% rent growth · sell at horizon
- IRR
- 41.9%
- Equity multiple
- 2.77×
- Total profit
- $39,596
- Equity at exit
- $11,913
- IRR
- 47.5%
- Equity multiple
- 5.30×
- Total profit
- $96,234
- Equity at exit
- $6,908
Cash invested: $22,372 (down + closing). Projections, not guarantees.
Landlord ↔ Tenant lean methodology
- Overall (STATE)
- 18 Strongly Tenant-Friendly
- State California
- 18 Strongly Tenant-Friendly · D+13
- County
- — inherits STATE
- City
- — inherits STATE
ZIP-level market 92543
- Home prices YoY
- -26.7%
- Rents YoY
- 1.8%
- Active inventory
- 264
- Price-to-rent
- 3.7×
Monthly cashflow live
- Estimated rent
- $1,786 high interval (Pro) →
- Mortgage (P&I)
- −$419
- Tax est. 1.5%
- −$100 /mo · $1,198/yr
- Insurance
- −$33
- HOA
- −$0
- Vacancy / Maint / Mgmt
- −$375
- Net cashflow
- $859
Break-even live
UW: 25.0% down · 7.5% · 30yr · 1.5% tax · 5.0% vac · 8.0% maint · 8.0% mgmt
Financing live
Cash to close
- Down payment
- $19,975
- Closing costs
- $2,397
- Reserves months
- —
- Total cash needed
- —
Loan-product check · same deal, 3 products live
Conventional
25% down · 7.5% · 30yr
- Down + closing
- —
- Monthly P&I
- —
- Monthly cashflow
- —
- DSCR
- —
- Eligible?
- —
Personal DTI + credit; lowest rate.
DSCR
20% down · 8.5% · 30yr
- Down + closing
- —
- Monthly P&I
- —
- Monthly cashflow
- —
- DSCR
- —
- Eligible?
- —
No personal income docs; deal must DSCR.
Hard money
10% down · 12.0% · 12mo
- Down + closing
- —
- Monthly P&I
- —
- Monthly cashflow
- —
- DSCR
- —
- Eligible?
- —
Short-term bridge; refi at stabilization.
Rent comps 5 comps
| Address | Beds | Baths | Sqft | Rent | $/sqft | DOM | Units | Dist |
|---|---|---|---|---|---|---|---|---|
| 1377 Provence Ct Hemet, CA | 1.0 | 1.0 | 650 | $1,900 | $2.92 | 24d | 1 | 0.22mi |
| 1150 S Palm Ave Hemet, CA | 1.0 | 1.0 | 670 | $1,534 | $2.29 | 24d | 1 | 0.23mi |
| 1025 S Gilbert St Hemet, CA | 1.0–2.0 | 1.0–2.0 | 890 | $2,320 | $2.61 | 1d | 8 | 0.42mi |
| 1000 S Gilbert St Hemet, CA | 1.0–2.0 | 1.0 | 500 | $1,470 | $2.94 | 1d | 4 | 0.50mi |
| 893 S Palm Ave Hemet, CA | 2.0 | 2.0 | 720 | $1,375 | $1.91 | 4d | 1 | 0.57mi |
Listing history 15 events
-
2026-06-18days on market $79,900 Active 498 DOM
-
2026-06-17days on market $79,900 Active 497 DOM
-
2026-06-16days on market $79,900 Active 496 DOM
-
2026-06-15days on market $79,900 Active 495 DOM
-
2026-06-13days on market $79,900 Active 493 DOM
-
2026-06-09days on market $79,900 Active 489 DOM
-
2026-06-08days on market $79,900 Active 488 DOM
-
2026-06-07days on market $79,900 Active 487 DOM
-
2026-06-04days on market $79,900 Active 484 DOM
-
2026-06-03days on market $79,900 Active 483 DOM
-
2026-06-02days on market $79,900 Active 482 DOM
-
2026-06-01days on market $79,900 Active 481 DOM
-
2026-05-31days on market $79,900 Active 480 DOM
-
2026-04-07price $79,900 586-char remark
Show marketing remark (586 chars)
Welcome home to this charming two-bedroom, one-bath retreat nestled in the heart of London Spires, a beautifully maintained 55+ community. This delightful home exudes warmth and character, with a welcoming front porch perfect for sipping morning coffee or enjoying the peaceful surroundings. Inside, you’ll find a thoughtfully designed layout with inviting living spaces, cozy bedrooms, and a well-appointed bath. The home is offering both comfort and convenience in a serene setting. Experience the best of community living in this picturesque haven! Low space rent of $730/month
-
2025-02-05$89,000 Active 586-char remark
Show marketing remark (586 chars)
Welcome home to this charming two-bedroom, one-bath retreat nestled in the heart of London Spires, a beautifully maintained 55+ community. This delightful home exudes warmth and character, with a welcoming front porch perfect for sipping morning coffee or enjoying the peaceful surroundings. Inside, you’ll find a thoughtfully designed layout with inviting living spaces, cozy bedrooms, and a well-appointed bath. The home is offering both comfort and convenience in a serene setting. Experience the best of community living in this picturesque haven! Low space rent of $730/month
ⓘ Source: listings_history table (triggers on properties + properties_extension) + one-shot
backfill from property_details.listing_events for pre-trigger history.
Climate risk First Street
- Flood 1/10 Low FEMA zone X (unshaded) · 0% chance over 30 yrs
- Wildfire 7/10 Severe
- Heat 7/10 Severe 6 d/yr ≥104°F today · 16 d/yr by 30 yrs out
- Wind 1/10 Low
- Air quality 6/10 Major 9 unhealthy d/yr today · 11 by 30 yrs out
Nearby sold comps map
Loading sold comps map…
Walkable amenities ~0.75 mi
Loading nearby amenities…
Taxation est. · year 1
- Rental income
- $21,437
- − Mortgage interest
- −$4,476
- − Property taxes
- −$1,198
- − Insurance
- −$400
- − Repairs & maintenance
- −$1,715
- − Management
- −$1,715
- − Depreciation
- −$2,324
- Taxable income
- $9,609
- Est. tax owed @ 24.0%
- −$2,306
- After-tax cash flow
- $8,003/yr
For passive investors: Depreciation is non-cash, so a rental often shows a tax loss while cash-flowing — sheltering income. Rental losses are passive: they offset passive income freely, and up to $25,000/yr can offset ordinary (W-2) income if you actively participate and your MAGI is under $100k (phasing out to $0 by $150k); unused losses carry forward. On sale, claimed depreciation is recaptured at up to 25%, and gains may owe capital-gains tax (a 1031 exchange can defer both). Figures are a year-1 estimate at your 24.0% rate — not tax advice; consult a CPA.
Condition & rehab AI · 2 photos
This manufactured home is in good condition with a good exterior and interior. It is move-in ready with minor maintenance items to address. Painting the exterior siding and cleaning gutters would significantly enhance its curb appeal and value.
Value-add opportunities
- Both Paint exterior siding — Enhances curb appeal and adds value for both resale and rental.
- Both Clean gutters — Improves drainage and adds to the home's overall appearance, boosting value for both resale and rental.
Renovation cost estimate screening
Value-add ROI direction
- Both Paint exterior siding — Enhances curb appeal and adds value for both resale and rental. ↑
- Both Clean gutters — Improves drainage and adds to the home's overall appearance, boosting value for both resale and rental. ↑
ⓘ Cost ranges are severity-bucket heuristics (US national rule-of-thumb). Get contractor quotes + a written scope before underwriting a rehab budget.
Schools (NCES district)
- District
- Hemet Unified
- NCES district ID
- 0616920
- Math proficiency
- 19% ▼ -3.00%
- Reading proficiency
- 41% ▲ 4.00%
- Median HH income
- $39,962
- Composite
- 25.16/100
- National rank
- #7517
- State rank
- #360 of 517 in CA
Livability — Hemet
- Score
- 51/100
- State rank
- #1056
- US rank
- #25208
Category grades
Schools grade is shown separately in the Schools card above.
Census & demographics
- Census place
- Hemet, CA
- County
- Riverside County · 2,287,001 people
- City population
- 137,670
- Metro
- Riverside-San Bernardino-Ontario, CA
- Population (ZIP)
- 39,937
- Household income
- $49,396
- Rent vs Own
- Severe rent burden
- 2144.0
Population outlook (Riverside County) Hauer SSP2
- Today (2025)
- 2,664,475 people
- By 2030
- 2,802,692 · +5.2%
- By 2040
- 3,050,904 · +14.5%
- By 2050
- 3,256,783 · +22.2%
- By 2075
- 3,655,058 · +37.2%
- By 2100
- 3,766,594 · +41.4%
Race, ethnicity, and origin ACS 2023
- Neighborhood character
- Diverse neighborhood (Simpson 0.61)
- Race & ethnicity
- Hispanic / Latino 54% White 30% Two or more races 18% Black 10% Native American 2% Asian 2%
- Hispanic origin (detail)
- Mexican 48% Puerto Rican 1%
- Common ancestry
- Slovak 1% Romanian 1% Portuguese 1%
- Foreign-born
- 21% · Canada
- Languages at home
- 59% English-only · Spanish 38% Arabic 1% Tagalog/Filipino 1%
Political lean MEDSL · Riverside
- 2024 margin
- Toss-up / Even · D 48.0% · R 49.3% · Other 2.6%
- 2008→2024 swing
- -3.6pp toward R · 2008: 2.3pp · 2024: -1.3pp
- All cycles
- 2024: R+1.3 2020: D+8.0 2016: D+4.3 2012: R+0.4 2008: D+2.3
Not yet ingested
- Civics
- —
Market trends
- HPI YoY
- ▼ -147.46%
- Current HPI
- 405.1277
- Rent YoY
- ▲ 1.76%
- Metro
- Riverside-San Bernardino-Ontario, CA
- State GDP YoY
- ▲ 3.21%
- F500 in state
- 116
Industry mix (Fortune 500 HQ in CA)
| Industry | F500 HQs | Revenue |
|---|---|---|
| Technology | 27 | $1,492B |
|
||
| Financial Services | 3 | $174B |
|
||
| Retail | 3 | $44B |
|
||
| Insurance | 3 | $26B |
|
||
| Media / Entertainment | 2 | $115B |
|
||
| Pharmaceuticals / Biotech | 2 | $62B |
|
||
Price history
-10.2% since first listed2 events — show timeline
- 2026-04-07 Price Changed $79,900 SDMLS
- 2025-02-05 Listed $89,000 SDMLS
Cash-flow waterfall
monthlySold comps — $/sqft
last 12 mo · ≤1 miLoading sold comps…