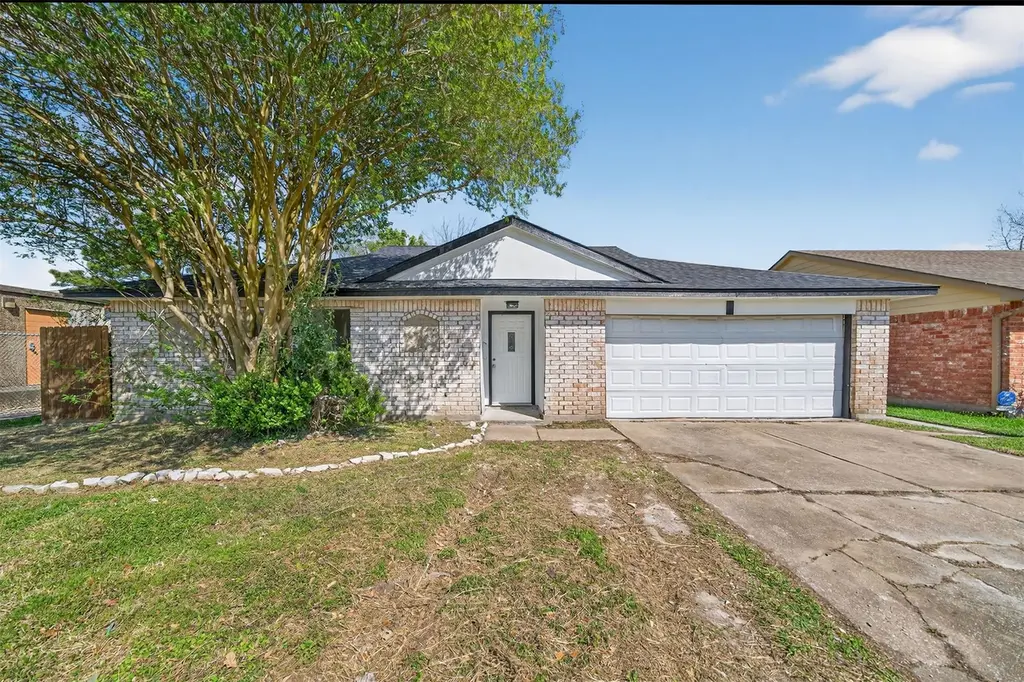
3111 Scotch Moss Ln · La Porte, TX
Flood risk 1/10 · Minimal
- FEMA flood zone
- X (unshaded)
- Chance of flooding over 30 yrs
- 0.0%
- Est. flood insurance / yr
- $507 – $1,088
Fire risk 3/10 · Minor
- Est. fire insurance / yr
- $1,222 – $2,270
Heat risk 9/10 · Severe
- Hot days now (above 108°F)
- 7 days/yr
- Hot days in 30 yrs
- 23 days/yr
Wind risk 9/10 · Severe
- Chance of severe wind over 30 yrs
- 99.0%
Air-quality risk 2/10 · Minimal
- Unhealthy air days now
- 2 days/yr
- Unhealthy air days in 30 yrs
- 2 days/yr
Risk factors via First Street. Map © Google.
Why this score? — see what drove the C- grade
The composite is a weighted blend of 9 inputs, each scored 0–100. Each bar is that input's sub-score; the figure is the points it added to the 100-point composite (weight × sub-score).
- Cash flow +18.2/30.0
- ARV discount +10.5/15.0
- 1% rule +5.7/10.0
- DSCR +5.7/10.0
- Schools +3.9/10.0
- Livability +3.5/5.0
- Rent growth +3.2/5.0
- Condition / age +2.5/5.0
- Appreciation +0.0/10.0
$214,999
🖨 Deal sheet 📄 Offer letter ✓ Due diligence
Listing remarks
Welcome to 3111 Scotch Moss Ln, a 4-bedroom, 2-bath home featuring stylish updates and major improvements for comfort and long-term value. Inside, you’ll find a bright, refreshed interior with light brown vinyl flooring and a clean, modern feel throughout. The kitchen stands out with white shaker cabinets, black hardware finishes, and stainless steel appliances, creating a timeless and functional space for everyday living. Both bathrooms have been updated with modern finishes, adding a polished touch to the home. Key upgrades include a brand-new HVAC system and a newer roof, providing added confidence and efficiency for future homeowners. The spacious layout allows flexibility for fam
Key facts
- Updated bathrooms
- 6,242 sq ft lot
- 2 garage spots
Tags
Property features AI
Finance
- Other: Lease not considered
- HOA & community: BrookGlen Community association; Annual association fee of $50
Exterior
- Parking: Attached garage with 2 parking spaces
- Utilities: Public water; Public sewer
- Home design: Residential property; Built in 1976; Slab foundation; Composition roof
- Construction: Brick construction
- Exterior features: Deck; Patio; Fully fenced yard with backyard fence; Private yard; Located in a subdivision
Interior
- Kitchen: Dishwasher; Refrigerator
- Bedrooms: Space for up to 4 bedrooms
- Bathrooms: 2 full bathrooms
- Heating & cooling: Central heating (gas); Central electric air conditioning
- Interior features: Quartz counters; Ceiling fans; One fireplace; Seven total rooms
- Laundry & utility: Washer hookup; Gas dryer hookup
Neighborhood map
What this means for you Summary
Snapshot
- This is a 4-bed/2.5-bath single-family listed at $215k.
Deal economics
- At list price, monthly cash flow is $194 ($2k/yr) — positive.
- The deal already cash-flows at list — no discount required.
- Meets the 1% rule at list price ($2k rent vs $215k).
- Recommended offer: $209k (3.0% below list) — sets the bar for market timing.
- Cap rate 7.4% vs local median 3.4% in La Porte — top-decile yield for the area; either an underpriced asset or a hidden risk that comps aren't pricing in. Stress-test before assuming the spread holds.
Location & tenants
- Location reads 70/100 on livability (#360 in TX) — a middle-class / working-renter tenant base. Strengths: cost of living A+, housing A+, crime A-; Watch: amenities F, commute F, health & safety F.
- La Porte ISD (suburban): math 41% / reading 44% proficiency, ranked #260 of 826 in TX (top 32%) — families likely to look elsewhere, expect single-tenant / working-renter base with shorter leases.
- Zoned schools: College Park El (math 52% / reading 52%, grade C-, #742 of 4,322 statewide, top 19%, 437 students, 72% FRL); La Porte H S (math 24% / reading 46%, grade F, #954 of 1,632 statewide, top 59%, 2,069 students, 51% FRL) — zoned schools average 61% FRL vs 44% district-wide (17 pts higher); higher-poverty schools than district average — tighter screening recommended.
- Market conditions: Rents rising (+2.8%/yr); 337 active listings in the ZIP; 5 comparable units currently listed for rent nearby; rentals leasing fast (median 5d on market — plan ~1-2 weeks tenant-placement turnaround); solid renter incomes; 29,883 units permitted in Harris County in 2024 (8,621 in 5+ unit buildings).
- This rent runs 34% of the median local income ($82k/yr) — at the standard rent-burdened threshold; future hikes will face affordability resistance.
Forward outlook
- Local home prices are declining (-3.0%/yr); year-one equity from $1k of loan paydown is wiped out by about $6k of value loss. Plan a longer hold.
- Harris County population projected at +47% by 2050 — long-run rental-demand tailwind backs the buy-and-hold thesis.
Negotiation context
- It's been on market 36 days — a 3% lower offer ($209k) is reasonable based on typical stale-listing flexibility.
- 6 sale attempts since 24y ago with the ask held roughly flat each time — persistent listings suggest the price (not the market) is what's stuck; bring a comps-based counter.
Risks & watch-outs
- Climate carrying-cost: severe wind risk, 99% chance of damaging wind over 30y; extreme-heat days projected 7→23/yr by 2055 (HVAC capex compounding) — expect insurance premiums to compound above CPI over the hold.
Questions for the listing agent
- It's been on market 36 days. Have you received any prior offers? Is the seller open to a 3% concession, seller financing, or rate buy-down credit?
- Built in 1976 — when were the roof, HVAC, electrical panel, plumbing, and water heater last replaced?
- What does the HOA fee cover, when was the last increase, and are there any pending special assessments or reserve-fund shortfalls?
- Is there a deadline driving the sale (1031 exchange, divorce, estate, relocation)? That informs how much negotiation room exists.
- Schools are D-rated, which usually means shorter tenancies and higher turnover. Who's the typical renter profile here, and what's been the actual vacancy rate?
- What's the average days-on-market for RENTAL listings here right now (not sales)? A rising rental-DOM trend means longer vacancies and softer asking-rent achievability than the comps imply.
- What's the recent tenant-quality profile in this submarket — average credit score on applications, eviction rate, late-payment / NSF rate, and stable-employment percentage? A property-management company in the area should have these aggregated.
- How much new for-sale + rental construction is in the pipeline within 1–3 miles? Heavy new supply typically softens prices + rents 12–24 months out; constrained supply supports both.
Investment metrics
- 1% rule
- 1.07% ✓
- Cap rate
- 7.38%
- Cash-on-cash
- 3.87%
- DSCR
- 1.17
- GRM
- 7.8
CMA / ARV
- ARV (median comp)
- $230,603
- List price
- $214,999
- Delta
- -6.77%
- Verdict
- FAIR
- Comps
- 20 within 1.0 mi
Show comp detail 12 sales within ~0.75 mi
| Address | Dist | Beds/Ba | Sqft | Sold | Price | $/sf | Match |
|---|---|---|---|---|---|---|---|
| 730 Columbia Ln | 0.49mi | 3/2.0 (-1) | 1,493 (+1%) | 3mo | $235,000 | $157 | 66 |
| 1125 E Lambuth Ln | 0.43mi | 3/2.0 (-1) | 1,560 (+5%) | 1mo | $245,000 | $157 | 63 |
| 1109 E Columbia Ln | 0.34mi | 4/2.5 | 1,660 (+12%) | 2mo | $265,000 | $160 | 62 |
| 1209 E Lambuth Ln | 0.41mi | 3/2.0 (-1) | 1,570 (+6%) | 4mo | $249,000 | $159 | 60 |
| 8514 Ashwyne Ln | 0.27mi | 3/2.0 (-1) | 1,296 (-12%) | 4mo | $219,000 | $169 | 57 |
| 4710 Meadow Way Dr | 0.42mi | 3/2.0 (-1) | 1,358 (-8%) | 4mo | $260,000 | $191 | 56 |
| 1214 E Rutgers Ln | 0.39mi | 3/1.5 (-1) | 1,630 (+10%) | 4mo | $215,000 | $132 | 53 |
| 4522 E Meadow Dr | 0.51mi | 3/2.0 (-1) | 1,621 (+10%) | 4mo | $280,000 | $173 | 50 |
| 3503 Somerton Dr | 0.47mi | 3/2.0 (-1) | 1,664 (+12%) | 0mo | $275,000 | $165 | 50 |
| 3302 Gladwyne Ln | 0.44mi | 3/2.0 (-1) | 1,290 (-13%) | 2mo | $240,000 | $186 | 50 |
| 1706 Zeppelin Cir | 0.68mi | 3/2.0 (-1) | 1,599 (+8%) | 4mo | $299,900 | $188 | 45 |
| 406 Boone Ct | 0.67mi | 3/2.0 (-1) | 1,651 (+12%) | 4mo | $295,000 | $179 | 39 |
Match score weights: distance 35% · size 25% · config 20% · recency 20%. Top-matched comps best support the ARV.
Projected returns pro-forma
-3.0% appreciation · 2.81% rent growth · sell at horizon
- IRR
- -10.4%
- Equity multiple
- 0.62×
- Total profit
- $-22,798
- Equity at exit
- $32,057
- IRR
- -1.3%
- Equity multiple
- 0.91×
- Total profit
- $-5,237
- Equity at exit
- $18,589
Cash invested: $60,200 (down + closing). Projections, not guarantees.
Landlord ↔ Tenant lean methodology
- Overall (STATE)
- 87 Strongly Landlord-Friendly
- State Texas
- 87 Strongly Landlord-Friendly · R+5
- County
- — inherits STATE
- City
- — inherits STATE
ZIP-level market 77571
- Home prices YoY
- -28.9%
- Rents YoY
- 2.8%
- Active inventory
- 337
- Price-to-rent
- 7.8×
Monthly cashflow live
- Estimated rent
- $2,310 high interval (Pro) →
- Mortgage (P&I)
- −$1,127
- Tax from tax record
- −$410 /mo · $4,922/yr
- Insurance
- −$90
- HOA
- −$4
- Vacancy / Maint / Mgmt
- −$485
- Net cashflow
- $194
Break-even live
UW: 25.0% down · 7.5% · 30yr · 1.5% tax · 5.0% vac · 8.0% maint · 8.0% mgmt
Financing live
Cash to close
- Down payment
- $53,750
- Closing costs
- $6,450
- Reserves months
- —
- Total cash needed
- —
Loan-product check · same deal, 3 products live
Conventional
25% down · 7.5% · 30yr
- Down + closing
- —
- Monthly P&I
- —
- Monthly cashflow
- —
- DSCR
- —
- Eligible?
- —
Personal DTI + credit; lowest rate.
DSCR
20% down · 8.5% · 30yr
- Down + closing
- —
- Monthly P&I
- —
- Monthly cashflow
- —
- DSCR
- —
- Eligible?
- —
No personal income docs; deal must DSCR.
Hard money
10% down · 12.0% · 12mo
- Down + closing
- —
- Monthly P&I
- —
- Monthly cashflow
- —
- DSCR
- —
- Eligible?
- —
Short-term bridge; refi at stabilization.
Rent comps 5 comps
| Address | Beds | Baths | Sqft | Rent | $/sqft | DOM | Units | Dist |
|---|---|---|---|---|---|---|---|---|
| 8406 Beechaven Rd Unit NA La Porte, TX | 4.0 | 2.0 | 1822 | $2,300 | $1.26 | 5d | 1 | 0.07mi |
| 8406 Beechaven Rd La Porte, TX | 4.0 | 2.0 | 1822 | $2,300 | $1.26 | 1d | 1 | 0.07mi |
| 7878 Spencer Hwy Unit 7911 Pasadena, TX | 3.0 | 2.0 | 1200 | $1,382 | $1.15 | 2d | 1 | 0.52mi |
| 722 E Brown Ln Deer Park, TX | 3.0 | 2.0 | 1349 | $1,844 | $1.37 | 24d | 1 | 0.66mi |
| 7201 Spencer Hwy Pasadena, TX | 1.0–3.0 | 1.0–2.0 | 925 | $1,600 | $1.73 | 43d | 18 | 1.18mi |
HOA detail
- Monthly dues
- $4 · $48/yr
Listing history 29 events
-
2026-06-09days on market $214,999 Pending 36 DOM
-
2026-06-08days on market $214,999 Pending 35 DOM
-
2026-06-07days on market $214,999 Pending 34 DOM
-
2026-06-04days on market $214,999 Pending 31 DOM
-
2026-06-03days on market $214,999 Pending 30 DOM
-
2026-06-02days on market $214,999 Pending 29 DOM
-
2026-06-01days on market $214,999 Pending 28 DOM
-
2026-05-31days on market $214,999 Pending 27 DOM
-
2026-05-16price $214,999 901-char remark
-
2026-05-10price $219,900 901-char remark
-
2026-05-04$224,900 Active 901-char remark
-
2026-05-04historical
-
2026-04-28price $227,900
-
2026-04-23price $229,900
-
2026-04-16price $232,900
-
2026-04-01$234,900 Active
-
2026-04-01historical
-
2026-03-29price $237,900
-
2026-03-29status Active
-
2026-03-28status Active
-
2026-03-28historical
-
2026-03-28historical
-
2026-03-20$239,900 Active
-
2025-11-05soldstatus
-
2025-11-05soldstatus
-
2002-09-13historical
-
2002-05-29$89,900
-
2001-10-22soldstatus
-
1988-01-02soldstatus
ⓘ Source: listings_history table (triggers on properties + properties_extension) + one-shot
backfill from property_details.listing_events for pre-trigger history.
Tax reassessment forecast TX · Resets to sale price
- Current annual tax
- $4,922 · $410/mo
- Projected year-2 tax
- $4,922 · $410/mo
- Expected delta
- $0/yr ($0/mo · 0.0%)
ⓘ Screening estimate from a state-policy table — verify with the county assessor before closing.
Climate risk First Street
- Flood 1/10 Low FEMA zone X (unshaded) · 0% chance over 30 yrs
- Wildfire 3/10 Moderate
- Heat 9/10 Extreme 7 d/yr ≥108°F today · 23 d/yr by 30 yrs out
- Wind 9/10 Extreme 99% chance of damaging wind over 30 yrs
- Air quality 2/10 Low 2 unhealthy d/yr today · 2 by 30 yrs out
Nearby sold comps map
Loading sold comps map…
Walkable amenities ~0.75 mi
Loading nearby amenities…
Taxation est. · year 1
- Rental income
- $27,725
- − Mortgage interest
- −$12,043
- − Property taxes
- −$4,922
- − Insurance
- −$1,075
- − Repairs & maintenance
- −$2,218
- − Management
- −$2,218
- − HOA
- −$48
- − Depreciation
- −$6,255
- Taxable loss
- −$1,053
- Est. tax savings @ 24.0%
- +$253
- After-tax cash flow
- $2,581/yr
For passive investors: Depreciation is non-cash, so a rental often shows a tax loss while cash-flowing — sheltering income. Rental losses are passive: they offset passive income freely, and up to $25,000/yr can offset ordinary (W-2) income if you actively participate and your MAGI is under $100k (phasing out to $0 by $150k); unused losses carry forward. On sale, claimed depreciation is recaptured at up to 25%, and gains may owe capital-gains tax (a 1031 exchange can defer both). Figures are a year-1 estimate at your 24.0% rate — not tax advice; consult a CPA.
Schools (NCES district)
- District
- La Porte ISD
- NCES district ID
- 4826190
- Math proficiency
- 41% ▼ -10.00%
- Reading proficiency
- 44% ▼ -4.00%
- Median HH income
- $71,841
- Composite
- 38.65/100
- National rank
- #4151
- State rank
- #260 of 826 in TX
Livability — La Porte
- Score
- 70/100
- State rank
- #360
- US rank
- #7754
Category grades
Schools grade is shown separately in the Schools card above.
Census & demographics
- Census place
- La Porte, TX
- County
- Harris County · 4,702,590 people
- City population
- 38,543
- Metro
- Houston-The Woodlands-Sugar Land, TX
- Population (ZIP)
- 38,543
- Household income
- $81,850
- Rent vs Own
- Severe rent burden
- 1176.0
Population outlook (Harris County) Hauer SSP2
- Today (2025)
- 5,571,493 people
- By 2030
- 6,089,821 · +9.3%
- By 2040
- 7,142,806 · +28.2%
- By 2050
- 8,185,864 · +46.9%
- By 2075
- 10,574,329 · +89.8%
- By 2100
- 12,109,958 · +117.4%
Race, ethnicity, and origin ACS 2023
- Neighborhood character
- Diverse neighborhood (Simpson 0.60)
- Race & ethnicity
- White 51% Hispanic / Latino 36% Two or more races 20% Black 8% Asian 1%
- Hispanic origin (detail)
- Mexican 31%
- Common ancestry
- Italian 4% Lithuanian 3% Iranian 1%
- Foreign-born
- 10% · Canada, Vietnam
- Languages at home
- 77% English-only · Spanish 21% Other Indo-European 1%
Political lean MEDSL · Harris
- 2024 margin
- Lean D (+5.5) · D 52.0% · R 46.4% · Other 1.6%
- 2008→2024 swing
- +3.9pp toward D · 2008: 1.6pp · 2024: 5.5pp
- All cycles
- 2024: D+5.5 2020: D+13.3 2016: D+12.4 2012: D+0.1 2008: D+1.6
Not yet ingested
- Civics
- —
Market trends
- HPI YoY
- ▼ -103.81%
- Current HPI
- 255.0768
- Rent YoY
- ▲ 2.81%
- Metro
- Houston-The Woodlands-Sugar Land, TX
- State GDP YoY
- ▲ 3.95%
- F500 in state
- 110
Industry mix (Fortune 500 HQ in TX)
| Industry | F500 HQs | Revenue |
|---|---|---|
| Energy | 16 | $1,198B |
|
||
| Technology | 5 | $198B |
|
||
| Engineering / Construction | 4 | $72B |
|
||
| Energy Services | 3 | $60B |
|
||
| Utilities | 3 | $41B |
|
||
| Healthcare | 2 | $330B |
|
||
Price history
+139.2% since first listed23 events — show timeline
- 2026-06-10 Pending — HARMLS
- 2026-05-28 Pending — HARMLS
- 2026-05-16 Price Changed $214,999 HARMLS
- 2026-05-10 Price Changed $219,900 HARMLS
- 2026-05-04 Listing Removed — HARMLS
- 2026-05-04 Listed $224,900 HARMLS
- 2026-04-28 Price Changed $227,900 HARMLS
- 2026-04-23 Price Changed $229,900 HARMLS
- 2026-04-16 Price Changed $232,900 HARMLS
- 2026-04-01 Listing Removed — HARMLS
- 2026-04-01 Listed $234,900 HARMLS
- 2026-03-29 Price Changed $237,900 HARMLS
- 2026-03-29 Relisted — HARMLS
- 2026-03-28 Relisted — HARMLS
- 2026-03-28 Listing Removed — HARMLS
- 2026-03-28 Listing Removed — HARMLS
- 2026-03-20 Listed $239,900 HARMLS
- 2025-11-05 Sold (Public Records) — Public Records
- 2025-11-05 Sold (Public Records) — Public Records
- 2002-09-13 Listing Removed — HARMLS
- 2002-05-29 Listed $89,900 HARMLS
- 2001-10-22 Sold (Public Records) — Public Records
- 1988-01-02 Sold (Public Records) — Public Records
Property tax history
+2.6%/yrLatest (2025): $4,922 · +7.5% YoY. Source: county tax records.
Cash-flow waterfall
monthlySold comps — $/sqft
last 12 mo · ≤1 miLoading sold comps…