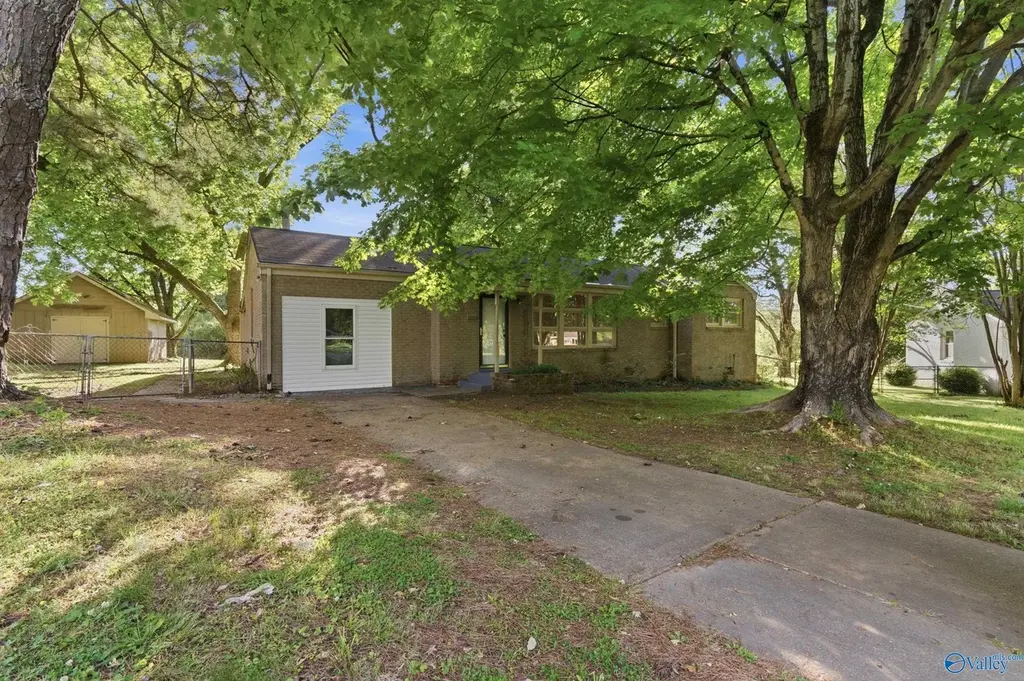
2217 Barrywood Cir NW · Huntsville, AL
Flood risk 1/10 · Minimal
- FEMA flood zone
- X (unshaded)
- Chance of flooding over 30 yrs
- 0.0%
- Est. flood insurance / yr
- $507 – $1,088
Fire risk 1/10 · Minimal
- Est. fire insurance / yr
- $916 – $1,700
Heat risk 6/10 · Moderate
- Hot days now (above 104°F)
- 7 days/yr
- Hot days in 30 yrs
- 19 days/yr
Wind risk 4/10 · Minor
- Chance of severe wind over 30 yrs
- 17.0%
Air-quality risk 2/10 · Minimal
- Unhealthy air days now
- 1 days/yr
- Unhealthy air days in 30 yrs
- 1 days/yr
Risk factors via First Street. Map © Google.
Why this score? — see what drove the D grade
The composite is a weighted blend of 9 inputs, each scored 0–100. Each bar is that input's sub-score; the figure is the points it added to the 100-point composite (weight × sub-score).
- Cash flow +13.7/30.0
- ARV discount +9.8/15.0
- DSCR +4.1/10.0
- Livability +4.1/5.0
- 1% rule +3.2/10.0
- Schools +2.9/10.0
- Rent growth +2.5/5.0
- Condition / age +2.5/5.0
- Appreciation +0.0/10.0
$179,900
🖨 Deal sheet (PDF) 📄 Offer letter ✓ Due diligence
Listing remarks
House has great potential with wood floors in main living area, and oversized lot with fenced in backyard, and detached garage. Under house has a walk-in cellar for storage or other uses. Convenient to shopping and downtown Huntsville. Needs a little loving care to make this house a home.
Key facts
- Wood floors
- Fenced in backyard
- Walk-in cellar
Tags
Property features AI
Finance
- Other:
- Financial info:
- HOA & community: No homeowners association; Subdivision: Lakewood Manor; Community features include curbs
Exterior
- Parking: Garage with workshop
- Security:
- Utilities: Public water; Public sewer; Electric heating
- Home design: Single-family residence; One story; Built in 1960; Brick construction
- Construction: Brick construction; Built in 1960; Crawl space foundation; One-level layout
- Exterior features: Treed lot; Detached outbuilding; Curb and gutters; Concrete driveway
Interior
- Kitchen:
- Bedrooms:
- Flooring:
- Bathrooms: 1 full bathroom
- Heating & cooling: Central heating (electric); Central air conditioning
- Interior features: Crawl space basement; Five total rooms
- Laundry & utility:
Neighborhood map
What this means for you Summary
Snapshot
- This is a 3-bed/1.0-bath single-family listed at $180k.
Deal economics
- At list price, monthly cash flow is $14 ($165/yr) — positive.
- The deal already cash-flows at list — no discount required.
- To meet the 1% rule (rent ≥ 1% of price), the offer needs to be $148k (17.9% below list).
- Recommended offer: $148k (17.9% below list) — sets the bar for 1% rule.
- Cap rate 6.4% vs local median 3.8% in Huntsville — top-decile yield for the area; either an underpriced asset or a hidden risk that comps aren't pricing in. Stress-test before assuming the spread holds.
Location & tenants
- Location reads 82/100 on livability (#3 in AL, #1,082 nationally) — a professional / high-income tenant draw. Strengths: commute A+, cost of living A+, housing A+; Watch: crime F.
- Huntsville City (urban): math 21% / reading 46% proficiency, ranked #48 of 129 in AL (top 37%) — families likely to look elsewhere, expect single-tenant / working-renter base with shorter leases.
- Zoned schools: Lakewood Elementary School (math 0% / reading 21%, grade F, #564 of 627 statewide, top 90%, 459 students, 86% FRL); Ronald Mcnair 78 (math 0% / reading 23%, grade F, #225 of 257 statewide, top 88%, 414 students, 87% FRL); Jemison High School (math 12% / reading 12%, grade F, #242 of 305 statewide, top 80%, 843 students, 64% FRL) — zoned schools average 79% FRL vs 46% district-wide (33 pts higher); higher-poverty schools than district average — tighter screening recommended.
- Zoned-school proficiency averages 12% at this address vs 34% district-wide (-22 pts) — the specific schools serving this property underperform the Huntsville City average; the district grade overstates school quality for this exact location.
- Market conditions: Rents soft (-0.1%/yr); 340 active listings in the ZIP; 40 comparable units currently listed for rent nearby; rentals lingering (median 46d on market — plan ~5-8 weeks vacancy on turnover, expect pricing pressure); 52% of comp listings sitting > 30 days — soft ceiling on asking rent; 4,709 units permitted in Madison County in 2024 (1,186 in 5+ unit buildings).
- This rent runs 35% of the median local income ($51k/yr) — at the standard rent-burdened threshold; future hikes will face affordability resistance.
Forward outlook
- Local home prices are declining (-3.0%/yr); year-one equity from $1k of loan paydown is wiped out by about $5k of value loss. Plan a longer hold.
- Madison County population projected at +18% by 2050 — long-run rental-demand tailwind backs the buy-and-hold thesis.
Negotiation context
- It's been on market 40 days — a 3% lower offer ($175k) is reasonable based on typical stale-listing flexibility.
- 2 sale attempts with the ask held roughly flat each time — persistent listings suggest the price (not the market) is what's stuck; bring a comps-based counter.
- Current owner paid $90k; list at $180k implies a 100% gain — meaningful room to come down on a strong offer.
Risks & watch-outs
- Climate carrying-cost: extreme-heat days projected 7→19/yr by 2055 (HVAC capex compounding) — expect insurance premiums to compound above CPI over the hold.
Questions for the listing agent
- It's been on market 40 days. Have you received any prior offers? Is the seller open to a 18% concession, seller financing, or rate buy-down credit?
- Built in 1960 — when were the roof, HVAC, electrical panel, plumbing, and water heater last replaced?
- Is there a deadline driving the sale (1031 exchange, divorce, estate, relocation)? That informs how much negotiation room exists.
- Crime grade is F in this area — have there been break-ins, vandalism, or insurance claims at this property in the last 3 years? What carrier currently insures it and at what premium?
- The area grade is low — what's the realistic commute time and amenity access for the typical tenant pool here? Any planned neighborhood developments (good or bad) we should know about?
- What's the average days-on-market for RENTAL listings here right now (not sales)? A rising rental-DOM trend means longer vacancies and softer asking-rent achievability than the comps imply.
- What's the recent tenant-quality profile in this submarket — average credit score on applications, eviction rate, late-payment / NSF rate, and stable-employment percentage? A property-management company in the area should have these aggregated.
- How much new for-sale + rental construction is in the pipeline within 1–3 miles? Heavy new supply typically softens prices + rents 12–24 months out; constrained supply supports both.
Investment metrics
- 1% rule
- 0.82% ✗
- Cap rate
- 6.38%
- Cash-on-cash
- 0.33%
- DSCR
- 1.01
- GRM
- 10.1
CMA / ARV
- ARV (median comp)
- $189,439
- List price
- $179,900
- Delta
- -5.04%
- Verdict
- FAIR
- Comps
- 20 within 1.0 mi
Show comp detail 12 sales within ~0.75 mi
| Address | Dist | Beds/Ba | Sqft | Sold | Price | $/sf | Match |
|---|---|---|---|---|---|---|---|
| 2206 Lynn Rd NW | 0.23mi | 3/1.5 | 1,421 (+1%) | 7mo | $155,000 | $109 | 80 |
| 4209 Memorial Parkway North N | 0.48mi | 3/2.0 | 1,403 (-1%) | 2mo | $185,000 | $132 | 71 |
| 2419 Tuxedo Dr NW | 0.42mi | 3/1.0 | 1,306 (-7%) | 1mo | $79,000 | $60 | 67 |
| 4304 Blue Springs Rd NW | 0.45mi | 3/2.0 | 1,366 (-3%) | 5mo | $150,000 | $110 | 66 |
| 4505 Lakeview Dr | 0.42mi | 3/2.0 | 1,434 (+2%) | 10mo | $209,000 | $146 | 66 |
| 4212 NW Lakeview Dr | 0.22mi | 3/1.5 | 1,207 (-14%) | 3mo | $205,000 | $170 | 61 |
| 2413 Springhill Rd NW | 0.58mi | 3/1.5 | 1,311 (-7%) | 4mo | $199,900 | $152 | 55 |
| 4604 Rochell Dr | 0.39mi | 3/2.0 | 1,248 (-12%) | 9mo | $210,000 | $168 | 51 |
| 2118 Medaris Rd NW | 0.62mi | 3/1.0 | 1,237 (-12%) | 1mo | $185,500 | $150 | 50 |
| 2709 Oaktree Ln | 0.67mi | 3/1.0 | 1,285 (-9%) | 9mo | $117,800 | $92 | 46 |
| 4201 Memorial Parkway North | 0.45mi | 3/2.0 | 1,228 (-13%) | 10mo | $110,000 | $90 | 45 |
| 2123 Griffith Dr NW | 0.50mi | 3/2.0 | 1,208 (-14%) | 9mo | $180,000 | $149 | 41 |
Match score weights: distance 35% · size 25% · config 20% · recency 20%. Top-matched comps best support the ARV.
Projected returns pro-forma
-3.0% appreciation · 0.0% rent growth · sell at horizon
- IRR
- -19.0%
- Equity multiple
- 0.35×
- Total profit
- $-32,640
- Equity at exit
- $26,824
- IRR
- -18.6%
- Equity multiple
- 0.12×
- Total profit
- $-44,162
- Equity at exit
- $15,554
Cash invested: $50,372 (down + closing). Projections, not guarantees.
Landlord ↔ Tenant lean methodology
- Overall (STATE)
- 90 Strongly Landlord-Friendly
- State Alabama
- 90 Strongly Landlord-Friendly · R+15
- County
- — inherits STATE
- City
- — inherits STATE
ZIP-level market 35810
- Home prices YoY
- -23.5%
- Rents YoY
- -0.1%
- Active inventory
- 340
- Price-to-rent
- 10.1×
Monthly cashflow live
- Estimated rent
- $1,477 high interval (Pro) →
- Mortgage (P&I)
- −$943
- Tax from tax record
- −$135 /mo · $1,619/yr
- Insurance
- −$75
- HOA
- −$0
- Vacancy / Maint / Mgmt
- −$310
- Net cashflow
- $14
Break-even live
Sensitivity live
| Price | -10% $116 | -5% $65 | +0% $14 | +5% $-37 | +10% $-88 |
|---|---|---|---|---|---|
| Rent | -10% $-103 | -5% $-45 | +0% $14 | +5% $72 | +10% $130 |
| Rate | -1.0pp $104 | -0.5pp $59 | base $14 | +0.5pp $-33 | +1.0pp $-80 |
UW: 25.0% down · 7.5% · 30yr · 1.5% tax · 5.0% vac · 8.0% maint · 8.0% mgmt
Financing live
Cash to close
- Down payment
- $44,975
- Closing costs
- $5,397
- Reserves months
- —
- Total cash needed
- —
Loan-product check · same deal, 3 products live
Conventional
25% down · 7.5% · 30yr
- Down + closing
- —
- Monthly P&I
- —
- Monthly cashflow
- —
- DSCR
- —
- Eligible?
- —
Personal DTI + credit; lowest rate.
DSCR
20% down · 8.5% · 30yr
- Down + closing
- —
- Monthly P&I
- —
- Monthly cashflow
- —
- DSCR
- —
- Eligible?
- —
No personal income docs; deal must DSCR.
Hard money
10% down · 12.0% · 12mo
- Down + closing
- —
- Monthly P&I
- —
- Monthly cashflow
- —
- DSCR
- —
- Eligible?
- —
Short-term bridge; refi at stabilization.
Rent comps 40 comps
| Address | Beds | Baths | Sqft | Rent | $/sqft | DOM | Units | Dist |
|---|---|---|---|---|---|---|---|---|
| 2206 Harris Rd NW Huntsville, AL | 3.0 | 1.0 | 1354 | $1,400 | $1.03 | 45d | 1 | 0.14mi |
| 3811 Lakeview Dr NW Huntsville, AL | 3.0 | 2.0 | 1707 | $1,350 | $0.79 | 45d | 1 | 0.24mi |
| 4408 Kenwood Dr NW Huntsville, AL | 3.0 | 1.5 | 1520 | $1,195 | $0.79 | 45d | 1 | 0.28mi |
| 2106 Sullivan Rd NW Huntsville, AL | 3.0 | 1.5 | 1690 | $1,195 | $0.71 | 46d | 1 | 0.31mi |
| 2602 Gibson St NW Huntsville, AL | 4.0 | 2.0 | 1795 | $1,625 | $0.91 | 45d | 1 | 0.37mi |
| 2113 Norris Rd NW Huntsville, AL | 3.0 | 1.0 | 1372 | $1,550 | $1.13 | 45d | 1 | 0.40mi |
| 4005 Memorial Pkwy NW Huntsville, AL | 3.0 | 1.0 | 1100 | $1,375 | $1.25 | 45d | 1 | 0.43mi |
| 4114 Blue Spring Rd NW Huntsville, AL | 3.0 | 2.0 | 1100 | $1,500 | $1.36 | 25d | 1 | 0.45mi |
| 4802 Proctor Cir NW Huntsville, AL | 3.0 | 1.0 | 1000 | $1,250 | $1.25 | 45d | 1 | 0.48mi |
| 2207 Norwood Dr NW Huntsville, AL | 3.0 | 1.0 | 1020 | $1,295 | $1.27 | 16d | 1 | 0.52mi |
| 2200 Norwood Dr NW Huntsville, AL | 3.0 | 1.0 | 1060 | $1,150 | $1.08 | 25d | 1 | 0.54mi |
| 2519 Birchfield St NW Huntsville, AL | 3.0 | 1.5 | 1125 | $1,195 | $1.06 | 45d | 1 | 0.55mi |
| 2117 Griffith Dr NW Huntsville, AL | 3.0 | 1.0 | 1000 | $1,095 | $1.09 | 25d | 1 | 0.57mi |
| 2415 Vining Ave NW Huntsville, AL | 3.0 | 1.0 | 1079 | $1,250 | $1.16 | 16d | 1 | 0.58mi |
| 3707 Lakewood Dr NW Huntsville, AL | 3.0 | 1.0 | 1100 | $1,100 | $1.00 | 45d | 1 | 0.61mi |
| 2117 Atkins Dr NW Huntsville, AL | 3.0 | 2.0 | 1250 | $1,699 | $1.36 | 25d | 1 | 0.73mi |
| 3606 Lakewood Rd NW Huntsville, AL | 3.0 | 1.5 | 1408 | $1,400 | $0.99 | 45d | 1 | 0.74mi |
| 2506 Jeri St NW Huntsville, AL | 3.0 | 1.5 | 1274 | $1,400 | $1.10 | 25d | 1 | 0.80mi |
| 2401 Mount Vernon Rd NW Huntsville, AL | 3.0 | 1.0 | 950 | $1,045 | $1.10 | 45d | 1 | 0.88mi |
| 5025 Blue Spring Rd NW Huntsville, AL | 3.0 | 2.5 | 1273 | $1,195 | $0.94 | 16d | 2 | 0.92mi |
| 2801 Penland Ave NW Huntsville, AL | 3.0 | 2.0 | 1650 | $1,450 | $0.88 | 25d | 1 | 0.93mi |
| 6022 Belgrade Dr NW Huntsville, AL | 3.0 | 1.5 | 1015 | $1,320 | $1.30 | 25d | 1 | 1.07mi |
| 6000 Cherokee Hills Dr NW Huntsville, AL | 3.0 | 2.0 | 1086 | $1,600 | $1.47 | 25d | 1 | 1.08mi |
| 3058 Boswell Dr NW Huntsville, AL | 4.0 | 2.0 | 1450 | $1,398 | $0.96 | 45d | 1 | 1.11mi |
| 3013 Kirkland Dr NW Huntsville, AL | 3.0 | 1.5 | 1324 | $1,295 | $0.98 | 45d | 1 | 1.16mi |
| 611 Ofallon Rd NW Huntsville, AL | 3.0 | 2.0 | 1350 | $3,000 | $2.22 | 25d | 1 | 1.16mi |
| 3205 Lewisburg Dr NW Huntsville, AL | 3.0 | 2.0 | 1408 | $1,600 | $1.14 | 25d | 1 | 1.17mi |
| 2212 Ricky Rd NW Huntsville, AL | 3.0 | 2.0 | 1539 | $1,400 | $0.91 | 25d | 1 | 1.19mi |
| 621 Murray Rd NW Huntsville, AL | 3.0 | 1.5 | 1008 | $1,325 | $1.31 | 16d | 1 | 1.20mi |
| 2032 Ricky Rd NW Huntsville, AL | 4.0 | 2.0 | 1181 | $1,523 | $1.29 | 23d | 1 | 1.28mi |
| 2640 Blue Spring Rd NW Huntsville, AL | 1.0–3.0 | 1.0–2.0 | 944 | $1,149 | $1.22 | 45d | 3 | 1.31mi |
| 641 Dawson Ter NW Huntsville, AL | 4.0 | 2.0 | 1506 | $1,675 | $1.11 | 16d | 1 | 1.35mi |
| 3601 Fay St NW Huntsville, AL | 2.0 | 1.0 | 972 | $1,195 | $1.23 | 45d | 1 | 1.36mi |
| 3202 Deerfield Rd NW Huntsville, AL | 3.0 | 2.0 | 1234 | $1,425 | $1.15 | 45d | 1 | 1.40mi |
| 522 Lisa Ln NW Huntsville, AL | 4.0 | 3.0 | 1025 | $1,695 | $1.65 | 45d | 1 | 1.41mi |
| 6207 Belgrade Dr NW Huntsville, AL | 3.0 | 1.5 | 1050 | $1,395 | $1.33 | 46d | 1 | 1.42mi |
| 2803 Hester Ln NW Huntsville, AL | 3.0 | 1.5 | 1224 | $1,400 | $1.14 | 25d | 1 | 1.45mi |
| 6214 Belgrade Dr NW Huntsville, AL | 3.0 | 1.5 | 1350 | $1,095 | $0.81 | 45d | 1 | 1.46mi |
| 3103 Sonya Dr NW Huntsville, AL | 3.0 | 1.0 | 1101 | $1,399 | $1.27 | 25d | 1 | 1.47mi |
| 3014 Winchester Rd NW Huntsville, AL | 2.0 | 2.0 | 1480 | $2,500 | $1.69 | 45d | 1 | 1.48mi |
Listing history 22 events
-
2026-06-22days on market $179,900 Active 40 DOM
-
2026-06-18days on market $179,900 Active 37 DOM
-
2026-06-17days on market $179,900 Active 36 DOM
-
2026-06-16days on market $179,900 Active 35 DOM
-
2026-06-15days on market $179,900 Active 34 DOM
-
2026-06-14days on market $179,900 Active 32 DOM
-
2026-06-10days on market $179,900 Active 29 DOM
-
2026-06-09days on market $179,900 Active 28 DOM
-
2026-06-08days on market $179,900 Active 27 DOM
-
2026-06-07days on market $179,900 Active 26 DOM
-
2026-06-03days on market $179,900 Active 22 DOM
-
2026-06-02days on market $179,900 Active 21 DOM
-
2026-06-01days on market $179,900 Active 20 DOM
-
2026-05-31days on market $179,900 Active 19 DOM
-
2026-05-30days on market $179,900 Active 18 DOM
-
2026-05-12$179,900 Active 289-char remark
-
2025-01-30historical $1,195
-
2025-01-16price $1,195
-
2025-01-08$1,295
-
2018-02-02soldstatus $90,000
-
2017-06-08soldstatus $114,500
-
2016-06-28soldstatus $49,150
ⓘ Source: listings_history table (triggers on properties + properties_extension) + one-shot
backfill from property_details.listing_events for pre-trigger history.
Tax reassessment forecast AL · Resets to sale price
- Current annual tax
- $1,619 · $135/mo
- Projected year-2 tax
- $1,619 · $135/mo
- Expected delta
- $0/yr ($0/mo · 0.0%)
ⓘ Screening estimate from a state-policy table — verify with the county assessor before closing.
Climate risk First Street
- Flood 1/10 Low FEMA zone X (unshaded) · 0% chance over 30 yrs
- Wildfire 1/10 Low
- Heat 6/10 Major 7 d/yr ≥104°F today · 19 d/yr by 30 yrs out
- Wind 4/10 Moderate 17% chance of damaging wind over 30 yrs
- Air quality 2/10 Low 1 unhealthy d/yr today · 1 by 30 yrs out
Nearby sold comps map
Loading sold comps map…
Walkable amenities ~0.75 mi
Loading nearby amenities…
Taxation est. · year 1
- Rental income
- $17,727
- − Mortgage interest
- −$10,077
- − Property taxes
- −$1,619
- − Insurance
- −$900
- − Repairs & maintenance
- −$1,418
- − Management
- −$1,418
- − Depreciation
- −$5,233
- Taxable loss
- −$2,939
- Est. tax savings @ 24.0%
- +$705
- After-tax cash flow
- $870/yr
For passive investors: Depreciation is non-cash, so a rental often shows a tax loss while cash-flowing — sheltering income. Rental losses are passive: they offset passive income freely, and up to $25,000/yr can offset ordinary (W-2) income if you actively participate and your MAGI is under $100k (phasing out to $0 by $150k); unused losses carry forward. On sale, claimed depreciation is recaptured at up to 25%, and gains may owe capital-gains tax (a 1031 exchange can defer both). Figures are a year-1 estimate at your 24.0% rate — not tax advice; consult a CPA.
Schools (NCES district)
- District
- Huntsville City
- NCES district ID
- 0101800
- Math proficiency
- 21% ▼ -23.00%
- Reading proficiency
- 46% ▬ 0.00%
- Median HH income
- $48,264
- Composite
- 28.84/100
- National rank
- #6647
- State rank
- #48 of 129 in AL
Livability — Huntsville
- Score
- 82/100
- State rank
- #3
- US rank
- #1082
Category grades
Schools grade is shown separately in the Schools card above.
Census & demographics
- Census place
- Huntsville, AL
- County
- Madison County · 380,832 people
- City population
- 220,435
- Metro
- Huntsville, AL
- Population (ZIP)
- 32,843
- Household income
- $51,233
- Rent vs Own
- Severe rent burden
- 1223.0
Population outlook (Madison County) Hauer SSP2
- Today (2025)
- 392,086 people
- By 2030
- 409,788 · +4.5%
- By 2040
- 440,557 · +12.4%
- By 2050
- 460,990 · +17.6%
- By 2075
- 502,872 · +28.3%
- By 2100
- 513,623 · +31.0%
Race, ethnicity, and origin ACS 2023
- Neighborhood character
- Predominantly Black (69%)
- Race & ethnicity
- Black 69% White 18% Hispanic / Latino 9% Two or more races 5%
- Hispanic origin (detail)
- Mexican 3% Puerto Rican 2% Dominican 2%
- Common ancestry
- Italian 2% Lithuanian 0%
- Foreign-born
- 6% · Canada
- Languages at home
- 92% English-only · Spanish 7%
Political lean MEDSL · Madison
- 2024 margin
- Lean R (+9.0) · D 44.7% · R 53.7% · Other 1.6%
- 2008→2024 swing
- +6.0pp toward D · 2008: -14.9pp · 2024: -9.0pp
- All cycles
- 2024: R+9.0 2020: R+8.0 2016: R+16.8 2012: R+18.7 2008: R+14.9
Not yet ingested
- Civics
- —
Market trends
- HPI YoY
- ▼ -61.00%
- Current HPI
- 198.9629
- Rent YoY
- ▬ -0.05%
- Metro
- Huntsville, AL
- State GDP YoY
- ▲ 2.94%
- F500 in state
- 4
Industry mix (Fortune 500 HQ in AL)
| Industry | F500 HQs | Revenue |
|---|---|---|
| Financial Services | 1 | $8B |
|
||
| Healthcare | 1 | $5B |
|
||
Price history
+266.0% since first listed7 events — show timeline
- 2026-05-12 Listed $179,900 VMLS
- 2025-01-30 Rental Removed $1,195 APPFOLIO
- 2025-01-16 Price Changed $1,195 APPFOLIO
- 2025-01-08 Listed for Rent $1,295 APPFOLIO
- 2018-02-02 Sold (Public Records) $90,000 Public Records
- 2017-06-08 Sold (Public Records) $114,500 Public Records
- 2016-06-28 Sold (Public Records) $49,150 Public Records
Property tax history
+7.1%/yrLatest (2024): $1,619 · +17.6% YoY. Source: county tax records.
Cash-flow waterfall
monthlySold comps — $/sqft
last 12 mo · ≤1 miLoading sold comps…