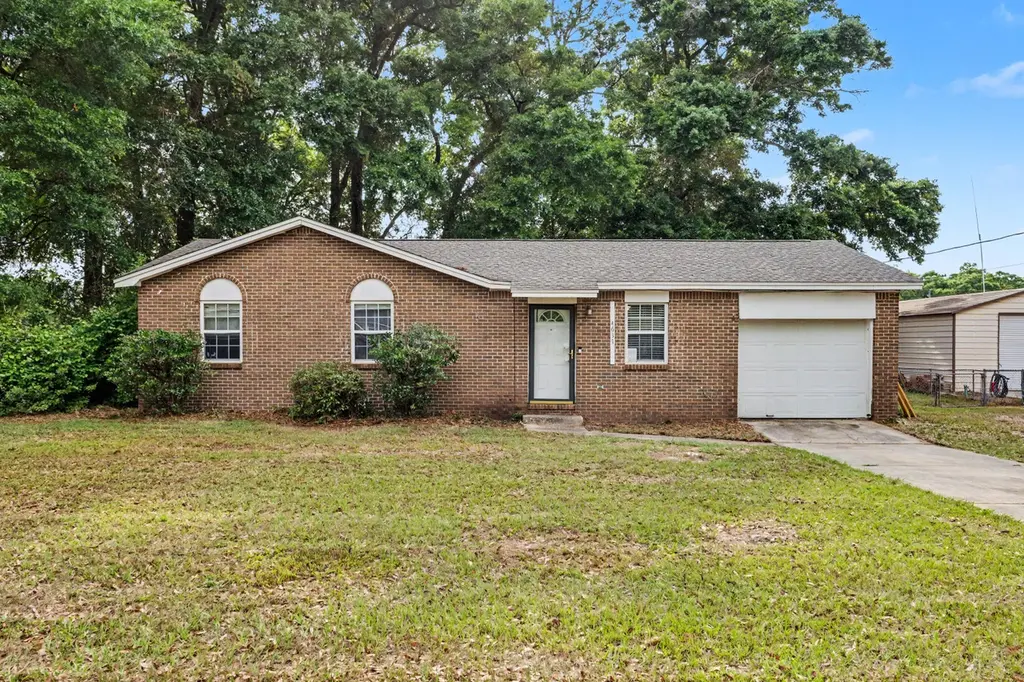
4637 Dean Dr · Pace, FL
Flood risk 1/10 · Minimal
- FEMA flood zone
- X (unshaded)
- Chance of flooding over 30 yrs
- 0.0%
- Est. flood insurance / yr
- $507 – $1,088
Fire risk 4/10 · Minor
- Est. fire insurance / yr
- $947 – $1,759
Heat risk 10/10 · Severe
- Hot days now (above 105°F)
- 7 days/yr
- Hot days in 30 yrs
- 22 days/yr
Wind risk 9/10 · Severe
- Chance of severe wind over 30 yrs
- 99.0%
Air-quality risk 1/10 · Minimal
- Unhealthy air days now
- 0 days/yr
- Unhealthy air days in 30 yrs
- 0 days/yr
Risk factors via First Street. Map © Google.
Why this score? — see what drove the C grade
The composite is a weighted blend of 9 inputs, each scored 0–100. Each bar is that input's sub-score; the figure is the points it added to the 100-point composite (weight × sub-score).
- Cash flow +20.8/30.0
- ARV discount +11.7/15.0
- DSCR +6.6/10.0
- Schools +5.3/10.0
- 1% rule +4.8/10.0
- Livability +3.5/5.0
- Rent growth +3.2/5.0
- Condition / age +2.5/5.0
- Appreciation +0.0/10.0
$200,000
🖨 Deal sheet 📄 Offer letter ✓ Due diligence
Listing remarks MLS
Beautiful brick home in the heart of Pace * Original owners have pampered this extra nice 3/2 * Giant back yard for kids & pets * Lots of shade from large oak trees * Roof appx. 5 yrs old * New A/C system inside & out (only months old) * Sidewalk & Patio made from rare handmade brick * This will not be on the market long * Show & you will sell!
Key facts
- Fenced in backyard
- 0.32 acre lot
- Garage
Tags
Property features AI
Finance
- Other: Lot dimensions approximately 101 x 141 x 101 x 141
- HOA & community: Subdivision: GREEN PASTURES
Exterior
- Parking: Attached garage with space for 1 car
- Utilities: Public water; Public sewer; Electric power (central AC/heating and electric water heater)
- Home design: Single-story Craftsman-style home; Built in 1979; Resid single-family zoning
- Construction: Brick and vinyl trim exterior; Shingle roof; Appraiser-sourced building area
- Exterior features: Open patio; Shed on the property; City street frontage; Paved road access
Interior
- Kitchen: Range hood; Refrigerator
- Bedrooms: 3 bedrooms total; Primary bedroom on the first floor
- Flooring: Tile flooring
- Bathrooms: 2 full bathrooms
- Heating & cooling: Central heating; Central air conditioning; Electric heat controls
- Interior features: Open patio (covered as a patio/porch feature is listed); Living room on the first floor
- Laundry & utility: Electric water heater
Neighborhood map
What this means for you Summary
Snapshot
- This is a 3-bed/2.0-bath single-family listed at $200k.
Deal economics
- At list price, monthly cash flow is $274 ($3k/yr) — positive.
- The deal already cash-flows at list — no discount required.
- To meet the 1% rule (rent ≥ 1% of price), the offer needs to be $196k (1.8% below list).
- Recommended offer: $194k (3.0% below list) — sets the bar for market timing.
- Cap rate 7.9% vs local median 4.5% in Pace — top-decile yield for the area; either an underpriced asset or a hidden risk that comps aren't pricing in. Stress-test before assuming the spread holds.
Location & tenants
- Location reads 69/100 on livability (#475 in FL) — a middle-class / working-renter tenant base. Strengths: cost of living A+, housing A+, crime B; Watch: amenities F, commute F, health & safety F.
- Santa Rosa (suburban): math 63% / reading 60% proficiency, ranked #8 of 73 in FL (top 11%) — acceptable for families but not a draw, mixed tenant base, ~2y average lease.
- Zoned schools: Berryhill Elementary School (math 71% / reading 62%, grade B+, #473 of 2,144 statewide, top 23%, 923 students, 51% FRL); Pace High School (math 63% / reading 62%, grade B-, #93 of 667 statewide, top 14%, 2,240 students, 34% FRL).
- Market conditions: Rents rising (+2.7%/yr); 665 active listings in the ZIP; 2 comparable units currently listed for rent nearby; solid renter incomes; 1,983 units permitted in Santa Rosa County in 2024 (128 in 5+ unit buildings).
Forward outlook
- Local home prices are declining (-3.0%/yr); year-one equity from $1k of loan paydown is wiped out by about $6k of value loss. Plan a longer hold.
- Santa Rosa County population projected at +31% by 2050 — long-run rental-demand tailwind backs the buy-and-hold thesis.
Negotiation context
- It's been on market 50 days — a 3% lower offer ($194k) is reasonable based on typical stale-listing flexibility.
- 2 sale attempts since 23y ago with the ask held roughly flat each time — persistent listings suggest the price (not the market) is what's stuck; bring a comps-based counter.
- Current owner paid $153k; 31% above their basis — modest negotiation headroom, anchor on the comps not their cost.
Risks & watch-outs
- Climate carrying-cost: severe wind risk, 99% chance of damaging wind over 30y; extreme-heat days projected 7→22/yr by 2055 (HVAC capex compounding) — expect insurance premiums to compound above CPI over the hold.
Questions for the listing agent
- It's been on market 50 days. Have you received any prior offers? Is the seller open to a 3% concession, seller financing, or rate buy-down credit?
- Built in 1979 — when were the roof, HVAC, electrical panel, plumbing, and water heater last replaced?
- Is there a deadline driving the sale (1031 exchange, divorce, estate, relocation)? That informs how much negotiation room exists.
- Schools are B-rated — typically a magnet for longer-tenancy family renters. What's the average tenant stay here, and is there a school-zone premium baked into asking?
- What's the average days-on-market for RENTAL listings here right now (not sales)? A rising rental-DOM trend means longer vacancies and softer asking-rent achievability than the comps imply.
- What's the recent tenant-quality profile in this submarket — average credit score on applications, eviction rate, late-payment / NSF rate, and stable-employment percentage? A property-management company in the area should have these aggregated.
- How much new for-sale + rental construction is in the pipeline within 1–3 miles? Heavy new supply typically softens prices + rents 12–24 months out; constrained supply supports both.
Investment metrics
- 1% rule
- 0.98% ✗
- Cap rate
- 7.93%
- Cash-on-cash
- 5.86%
- DSCR
- 1.26
- GRM
- 8.5
CMA / ARV
- ARV (on-the-fly)
- $220,480
- Comps found
- 6
Show comp detail 6 sales within ~0.75 mi
| Address | Dist | Beds/Ba | Sqft | Sold | Price | $/sf | Match |
|---|---|---|---|---|---|---|---|
| 4732 Pine Ln | 0.33mi | 3/2.0 | 1,104 (+6%) | 1mo | $230,000 | $208 | 73 |
| 4397 Pine Villa Cir | 0.42mi | 3/2.0 | 1,025 (-1%) | 22mo | $217,000 | $212 | 60 |
| 4448 Pine Villa Cir | 0.39mi | 3/2.0 | 1,146 (+10%) | 15mo | $250,000 | $218 | 52 |
| 4732 W Spencer Field Rd | 0.35mi | 2/1.0 (-1) | 1,144 (+10%) | 12mo | $95,000 | $83 | 48 |
| 4885 Mayo Cir | 0.72mi | 3/2.0 | 1,182 (+14%) | 2mo | $255,000 | $216 | 42 |
| 4604 Fowler Dr | 0.56mi | 2/1.0 (-1) | 1,160 (+12%) | 6mo | $59,000 | $51 | 41 |
Match score weights: distance 35% · size 25% · config 20% · recency 20%. Top-matched comps best support the ARV.
Projected returns pro-forma
-3.0% appreciation · 2.72% rent growth · sell at horizon
- IRR
- -7.6%
- Equity multiple
- 0.72×
- Total profit
- $-15,568
- Equity at exit
- $29,821
- IRR
- 1.7%
- Equity multiple
- 1.12×
- Total profit
- $6,492
- Equity at exit
- $17,292
Cash invested: $56,000 (down + closing). Projections, not guarantees.
Landlord ↔ Tenant lean methodology
- Overall (STATE)
- 87 Strongly Landlord-Friendly
- State Florida
- 87 Strongly Landlord-Friendly · R+3
- County
- — inherits STATE
- City
- — inherits STATE
ZIP-level market 32571
- Home prices YoY
- -17.7%
- Rents YoY
- 2.7%
- Active inventory
- 665
- Price-to-rent
- 8.5×
Monthly cashflow live
- Estimated rent
- $1,965 medium interval (Pro) →
- Mortgage (P&I)
- −$1,049
- Tax from tax record
- −$146 /mo · $1,757/yr
- Insurance
- −$83
- HOA
- −$0
- Vacancy / Maint / Mgmt
- −$413
- Net cashflow
- $274
Break-even live
UW: 25.0% down · 7.5% · 30yr · 1.5% tax · 5.0% vac · 8.0% maint · 8.0% mgmt
Financing live
Cash to close
- Down payment
- $50,000
- Closing costs
- $6,000
- Reserves months
- —
- Total cash needed
- —
Loan-product check · same deal, 3 products live
Conventional
25% down · 7.5% · 30yr
- Down + closing
- —
- Monthly P&I
- —
- Monthly cashflow
- —
- DSCR
- —
- Eligible?
- —
Personal DTI + credit; lowest rate.
DSCR
20% down · 8.5% · 30yr
- Down + closing
- —
- Monthly P&I
- —
- Monthly cashflow
- —
- DSCR
- —
- Eligible?
- —
No personal income docs; deal must DSCR.
Hard money
10% down · 12.0% · 12mo
- Down + closing
- —
- Monthly P&I
- —
- Monthly cashflow
- —
- DSCR
- —
- Eligible?
- —
Short-term bridge; refi at stabilization.
Rent comps 2 comps
| Address | Beds | Baths | Sqft | Rent | $/sqft | DOM | Units | Dist |
|---|---|---|---|---|---|---|---|---|
| 4716 Chumuckla Hwy Unit 3903 Pace, FL | 3.0 | 1.0 | 840 | $1,250 | $1.49 | 23d | 1 | 1.09mi |
| 4496 Fiske St Milton, FL | 3.0 | 2.0 | 1418 | $1,850 | $1.30 | 13d | 1 | 1.18mi |
Listing history 22 events
-
2026-06-18days on market $200,000 Active 50 DOM
-
2026-06-17days on market $200,000 Active 49 DOM
-
2026-06-16days on market $200,000 Active 48 DOM
-
2026-06-15days on market $200,000 Active 47 DOM
-
2026-06-14days on market $200,000 Active 45 DOM
-
2026-06-10days on market $200,000 Active 42 DOM
-
2026-06-09days on market $200,000 Active 41 DOM
-
2026-06-08days on market $200,000 Active 40 DOM
-
2026-06-07days on market $200,000 Active 39 DOM
-
2026-06-05days on market $200,000 Active 36 DOM
-
2026-06-03days on market $200,000 Active 35 DOM
-
2026-06-02days on market $200,000 Active 34 DOM
-
2026-06-01days on market $200,000 Active 33 DOM
-
2026-05-31days on market $200,000 Active 32 DOM
-
2026-05-31days on market $200,000 Active 31 DOM
-
2026-04-29$200,000 Active
-
2021-10-04soldstatus $153,000
-
2003-11-20soldstatus $68,500
-
2003-11-11soldstatus $68,500 362-char remark
Show marketing remark (362 chars)
Beautiful brick home in the heart of Pace * Original owners have pampered this extra nice 3/2 * Giant back yard for kids & pets * Lots of shade from large oak trees * Roof appx. 5 yrs old * New A/C system inside & out (only months old) * Sidewalk & Patio made from rare handmade brick * This will not be on the market long * Show & you will sell!
-
2003-07-14$74,500 362-char remark
Show marketing remark (362 chars)
Beautiful brick home in the heart of Pace * Original owners have pampered this extra nice 3/2 * Giant back yard for kids & pets * Lots of shade from large oak trees * Roof appx. 5 yrs old * New A/C system inside & out (only months old) * Sidewalk & Patio made from rare handmade brick * This will not be on the market long * Show & you will sell!
-
1979-04-01soldstatus $28,200
-
1979-02-01soldstatus $7,500
ⓘ Source: listings_history table (triggers on properties + properties_extension) + one-shot
backfill from property_details.listing_events for pre-trigger history.
Tax reassessment forecast FL · Resets to sale price
- Current annual tax
- $1,757 · $146/mo
- Projected year-2 tax
- $1,757 · $146/mo
- Expected delta
- $0/yr ($0/mo · -0.0%)
ⓘ Screening estimate from a state-policy table — verify with the county assessor before closing.
Climate risk First Street
- Flood 1/10 Low FEMA zone X (unshaded) · 0% chance over 30 yrs
- Wildfire 4/10 Moderate
- Heat 10/10 Extreme 7 d/yr ≥105°F today · 22 d/yr by 30 yrs out
- Wind 9/10 Extreme 99% chance of damaging wind over 30 yrs
- Air quality 1/10 Low 0 unhealthy d/yr today · 0 by 30 yrs out
Nearby sold comps map
Loading sold comps map…
Walkable amenities ~0.75 mi
Loading nearby amenities…
Taxation est. · year 1
- Rental income
- $23,577
- − Mortgage interest
- −$11,203
- − Property taxes
- −$1,757
- − Insurance
- −$1,000
- − Repairs & maintenance
- −$1,886
- − Management
- −$1,886
- − Depreciation
- −$5,818
- Taxable income
- $27
- Est. tax owed @ 24.0%
- −$6
- After-tax cash flow
- $3,277/yr
For passive investors: Depreciation is non-cash, so a rental often shows a tax loss while cash-flowing — sheltering income. Rental losses are passive: they offset passive income freely, and up to $25,000/yr can offset ordinary (W-2) income if you actively participate and your MAGI is under $100k (phasing out to $0 by $150k); unused losses carry forward. On sale, claimed depreciation is recaptured at up to 25%, and gains may owe capital-gains tax (a 1031 exchange can defer both). Figures are a year-1 estimate at your 24.0% rate — not tax advice; consult a CPA.
Schools (NCES district)
- District
- Santa Rosa
- NCES district ID
- 1201650
- Math proficiency
- 63% ▼ -6.00%
- Reading proficiency
- 60% ▼ -5.00%
- Median HH income
- $58,161
- Composite
- 53.12/100
- National rank
- #1511
- State rank
- #8 of 73 in FL
Livability — Pace
- Score
- 69/100
- State rank
- #475
- US rank
- #8593
Category grades
Schools grade is shown separately in the Schools card above.
Census & demographics
- Census place
- Pace, FL
- County
- Santa Rosa County · 194,764 people
- City population
- 42,171
- Metro
- Pensacola-Ferry Pass-Brent, FL
- Population (ZIP)
- 42,171
- Household income
- $87,617
- Rent vs Own
- Severe rent burden
- 301.0
Population outlook (Santa Rosa County) Hauer SSP2
- Today (2025)
- 195,978 people
- By 2030
- 209,782 · +7.0%
- By 2040
- 235,293 · +20.1%
- By 2050
- 256,408 · +30.8%
- By 2075
- 298,074 · +52.1%
- By 2100
- 303,216 · +54.7%
Race, ethnicity, and origin ACS 2023
- Neighborhood character
- Predominantly White (80%)
- Race & ethnicity
- White 80% Two or more races 9% Hispanic / Latino 6% Black 4% Asian 2%
- Hispanic origin (detail)
- Mexican 3%
- Common ancestry
- Lithuanian 4% Italian 3% Slovak 2%
- Foreign-born
- 6% · Canada, South Korea
- Languages at home
- 93% English-only · Spanish 2% Other Indo-European 1% Russian/Polish/Slavic 1%
Political lean MEDSL · Santa Rosa
- 2024 margin
- Solid R (+51.0) · D 24.1% · R 75.0%
- 2008→2024 swing
- -3.0pp toward R · 2008: -47.9pp · 2024: -51.0pp
- All cycles
- 2024: R+51.0 2020: R+46.5 2016: R+53.5 2012: R+52.6 2008: R+47.9
Not yet ingested
- Civics
- —
Market trends
- HPI YoY
- ▼ -62.39%
- Current HPI
- 290.2953
- Rent YoY
- ▲ 2.72%
- Metro
- Pensacola-Ferry Pass-Brent, FL
- State GDP YoY
- ▲ 3.28%
- F500 in state
- 36
Industry mix (Fortune 500 HQ in FL)
| Industry | F500 HQs | Revenue |
|---|---|---|
| Industrial Technology | 2 | $29B |
|
||
| Insurance | 2 | $17B |
|
||
| Retail | 1 | $60B |
|
||
| Technology Distribution | 1 | $58B |
|
||
| Homebuilding | 1 | $35B |
|
||
| Technology Manufacturing | 1 | $35B |
|
||
Price history
+2566.7% since first listed7 events — show timeline
- 2026-04-29 Listed $200,000 ECAR
- 2021-10-04 Sold (Public Records) $153,000 Public Records
- 2003-11-20 Sold (Public Records) $68,500 Public Records
- 2003-11-11 Sold (MLS) $68,500 PARMLS
- 2003-07-14 Listed $74,500 PARMLS
- 1979-04-01 Sold (Public Records) $28,200 Public Records
- 1979-02-01 Sold (Public Records) $7,500 Public Records
Property tax history
+6.9%/yrLatest (2025): $1,757 · +1.7% YoY. Source: county tax records.
Cash-flow waterfall
monthlySold comps — $/sqft
last 12 mo · ≤1 miLoading sold comps…