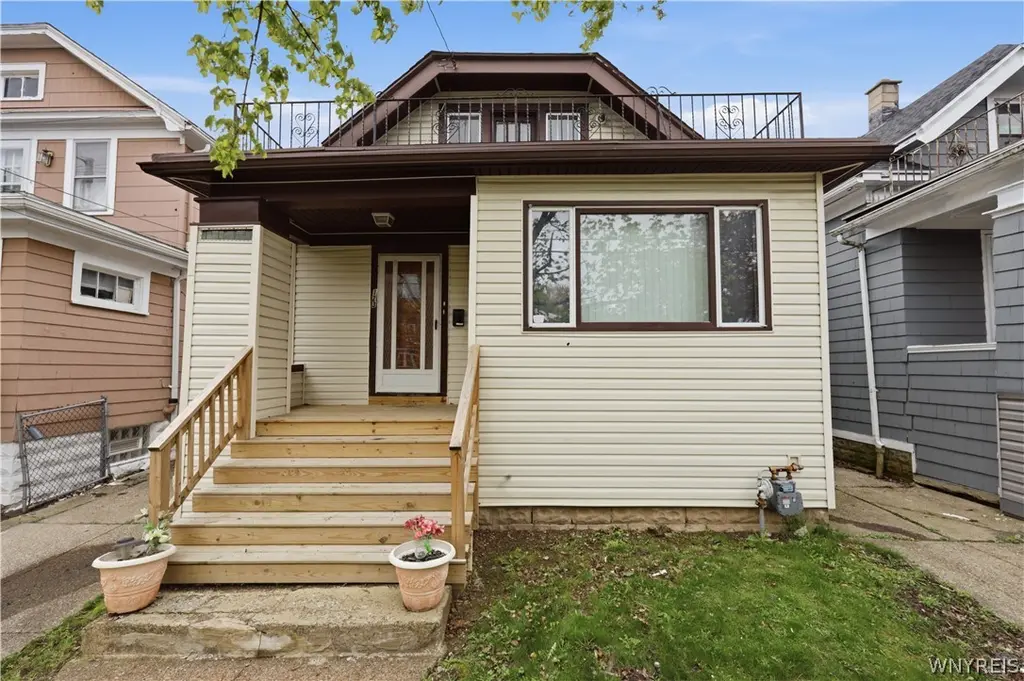
123 Rounds Ave · Buffalo, NY
Flood risk 1/10 · Minimal
- FEMA flood zone
- X (unshaded)
- Chance of flooding over 30 yrs
- 0.0%
- Est. flood insurance / yr
- $507 – $1,088
Fire risk 1/10 · Minimal
- Est. fire insurance / yr
- $691 – $1,283
Heat risk 3/10 · Minor
- Hot days now (above 92°F)
- 7 days/yr
- Hot days in 30 yrs
- 15 days/yr
Wind risk 1/10 · Minimal
- Chance of severe wind over 30 yrs
- —
Air-quality risk 3/10 · Minor
- Unhealthy air days now
- 2 days/yr
- Unhealthy air days in 30 yrs
- 3 days/yr
Risk factors via First Street. Map © Google.
Why this score? — see what drove the C- grade
The composite is a weighted blend of 9 inputs, each scored 0–100. Each bar is that input's sub-score; the figure is the points it added to the 100-point composite (weight × sub-score).
- Cash flow +18.0/30.0
- ARV discount +10.8/15.0
- DSCR +5.6/10.0
- Livability +3.9/5.0
- 1% rule +3.5/10.0
- Schools +3.3/10.0
- Rent growth +2.7/5.0
- Condition / age +2.5/5.0
- Appreciation +0.0/10.0
$179,123
🖨 Deal sheet 📄 Offer letter ✓ Due diligence
Listing remarks
WOW! IT'S READY TO MOVE IN! SPACIOUS 4BR, SO CLOSE TO SUNYAB CITY CAMPUS; NEWER PORCH & STAIRS W/ TREATED LUMBER; ENTER IN FRONT HALL W/ CLOSET; SHOES OFF TO LR, LARGE FRONT WINDOW W/ VERTICAL BLINDS; LR HAS FIREPLACE W/ MANTLE & SCONCES ON EACH SIDE; NEW THICK CARPET W/ 8LB PAD THROUGHOUT THE LOWER & UPPER LEVELS; FORMAL DINING RM W/ CEILING FAN & WAINSCOTING; 2 FIRST FLOOR BRS WITH CLOSETS; KITCHEN, SO SPACIOUS W/ LONG COUNTER, WHICH MEANS LOTS OF CABINETS, INCLUDING SPICE CABINET; NEW SINK & FAUCET, W/ WOOD LAMINATE FLOORING; BATHROOM HAS NEW FIXTURES & NEW LIGHTING; SO MANY OTHER FEATURES, AS FRESHLY PAINTED TROUGHOUT; NEW LIGHTS THROUGHOUT; UPPER LEV
Key facts
- Long counter
- Spice cabinet
- Spacious kitchen
Tags
Property features AI
Exterior
- Parking: Detached garage (1 car)
- Utilities: Electricity connected (circuit breakers); Public water connected; Sewer connected
- Home design: Two-story existing home; Rectangular residential lot near public transit; City street frontage
- Construction: Vinyl siding; Block foundation; Asphalt shingle roof; Copper plumbing; Existing (previously built)
- Exterior features: Concrete driveway; Partial fencing; Open porch
Interior
- Kitchen: Eat-in kitchen; Gas water heater (appliance noted); See remarks for additional appliance details
- Bedrooms: Two main-level bedrooms; Additional bedrooms on second floor (three bedrooms listed: Bedroom 1 on first level, Bedroom 2 on first level, Bedrooms 3 and 4 on second level)
- Flooring: Carpet; Varies
- Bathrooms: One full bathroom (on main level)
- Heating & cooling: Gas forced-air heating
- Interior features: Ceiling fan(s); Den; Separate/formal dining room; Entrance foyer; Eat-in kitchen; Separate/formal living room; Home office; Bedroom on main level; Full, partially finished basement; Living and recreation spaces included (total 8 rooms); Fireplace (1)
- Laundry & utility: Laundry in basement
Neighborhood map
What this means for you Summary
Snapshot
- This is a 3-bed/1.0-bath single-family listed at $179k.
Deal economics
- At list price, monthly cash flow is $153 ($2k/yr) — positive.
- The deal already cash-flows at list — no discount required.
- To meet the 1% rule (rent ≥ 1% of price), the offer needs to be $153k (14.7% below list).
- Recommended offer: $153k (14.7% below list) — sets the bar for 1% rule.
Location & tenants
- Location reads 77/100 on livability (#195 in NY, #3,011 nationally) — a middle-class / working-renter tenant base. Strengths: commute A+, housing A+, health & safety A+; Watch: crime F, employment D-.
- Buffalo City School District (urban): math 41% / reading 40% proficiency, ranked #535 of 590 in NY (top 91%) — families likely to look elsewhere, expect single-tenant / working-renter base with shorter leases; 75% free/reduced lunch — lower-income household profile, screen leases tightly.
- Market conditions: Rents flat; 237 active listings in the ZIP; 19 comparable units currently listed for rent nearby; rentals at typical pace (median 24d on market — plan ~3-4 weeks tenant-placement turnaround); lower-income renter base — watch delinquency; 1,244 units permitted in Erie County in 2024 (563 in 5+ unit buildings).
- This rent runs 41% of the median local income ($45k/yr) — at the standard rent-burdened threshold; future hikes will face affordability resistance.
Forward outlook
- Local home prices are declining (-3.0%/yr); year-one equity from $1k of loan paydown is wiped out by about $5k of value loss. Plan a longer hold.
Negotiation context
- It's been on market 33 days — a 3% lower offer ($174k) is reasonable based on typical stale-listing flexibility.
- 4 sale attempts since 13y ago with the ask held roughly flat each time — persistent listings suggest the price (not the market) is what's stuck; bring a comps-based counter.
Risks & watch-outs
- Watch-outs: built in 1932 — expect roof / HVAC / electrical / plumbing capex.
Questions for the listing agent
- It's been on market 33 days. Have you received any prior offers? Is the seller open to a 15% concession, seller financing, or rate buy-down credit?
- Built in 1932 — when were the roof, HVAC, electrical panel, plumbing, and water heater last replaced?
- Is there a deadline driving the sale (1031 exchange, divorce, estate, relocation)? That informs how much negotiation room exists.
- Crime grade is F in this area — have there been break-ins, vandalism, or insurance claims at this property in the last 3 years? What carrier currently insures it and at what premium?
- What's the average days-on-market for RENTAL listings here right now (not sales)? A rising rental-DOM trend means longer vacancies and softer asking-rent achievability than the comps imply.
- What's the recent tenant-quality profile in this submarket — average credit score on applications, eviction rate, late-payment / NSF rate, and stable-employment percentage? A property-management company in the area should have these aggregated.
- How much new for-sale + rental construction is in the pipeline within 1–3 miles? Heavy new supply typically softens prices + rents 12–24 months out; constrained supply supports both.
Investment metrics
- 1% rule
- 0.85% ✗
- Cap rate
- 7.32%
- Cash-on-cash
- 3.66%
- DSCR
- 1.16
- GRM
- 9.8
CMA / ARV
- ARV (median comp)
- $193,245
- List price
- $179,123
- Delta
- -7.31%
- Verdict
- FAIR
- Comps
- 20 within 1.0 mi
Show comp detail 12 sales within ~0.75 mi
| Address | Dist | Beds/Ba | Sqft | Sold | Price | $/sf | Match |
|---|---|---|---|---|---|---|---|
| 148 Rounds Ave | 0.05mi | 4/1.0 (+1) | 1,389 (-6%) | 5mo | $155,000 | $112 | 79 |
| 347 Lisbon Ave | 0.34mi | 3/1.5 | 1,558 (+6%) | 3mo | $180,000 | $116 | 70 |
| 461 Stockbridge Ave | 0.40mi | 3/1.0 | 1,336 (-10%) | 4mo | $96,500 | $72 | 63 |
| 622 Lasalle Ave | 0.14mi | 4/1.0 (+1) | 1,258 (-15%) | 3mo | $115,000 | $91 | 62 |
| 496 Berkshire Ave | 0.41mi | 3/1.0 | 1,266 (-14%) | 1mo | $125,000 | $99 | 57 |
| 14 Thornton Ave | 0.66mi | 4/2.0 (+1) | 1,445 (-2%) | 4mo | $239,900 | $166 | 53 |
| 29 Allendale Rd | 0.69mi | 3/1.5 | 1,364 (-8%) | 0mo | $155,000 | $114 | 53 |
| 307 Berkshire Ave | 0.52mi | 4/1.0 (+1) | 1,623 (+10%) | 4mo | $182,000 | $112 | 50 |
| 211 Burke Dr | 0.65mi | 3/1.0 | 1,648 (+12%) | 3mo | $275,000 | $167 | 48 |
| 965 Eggert Rd | 0.58mi | 3/1.5 | 1,296 (-12%) | 4mo | $304,500 | $235 | 47 |
| 243 Berkshire Ave | 0.59mi | 4/2.0 (+1) | 1,617 (+10%) | 1mo | $220,000 | $136 | 47 |
| 234 Treehaven Rd | 0.73mi | 2/1.0 (-1) | 1,296 (-12%) | 4mo | $275,000 | $212 | 37 |
Match score weights: distance 35% · size 25% · config 20% · recency 20%. Top-matched comps best support the ARV.
Projected returns pro-forma
-3.0% appreciation · 0.67% rent growth · sell at horizon
- IRR
- -12.9%
- Equity multiple
- 0.54×
- Total profit
- $-22,876
- Equity at exit
- $26,708
- IRR
- -7.4%
- Equity multiple
- 0.57×
- Total profit
- $-21,454
- Equity at exit
- $15,487
Cash invested: $50,154 (down + closing). Projections, not guarantees.
Landlord ↔ Tenant lean methodology
- Overall (STATE)
- 15 Strongly Tenant-Friendly
- State New York
- 15 Strongly Tenant-Friendly · D+10
- County
- — inherits STATE
- City
- — inherits STATE
ZIP-level market 14215
- Home prices YoY
- -30.0%
- Rents YoY
- 0.7%
- Active inventory
- 237
- Price-to-rent
- 9.8×
Monthly cashflow live
- Estimated rent
- $1,528 high interval (Pro) →
- Mortgage (P&I)
- −$939
- Tax from tax record
- −$40 /mo · $485/yr
- Insurance
- −$75
- HOA
- −$0
- Vacancy / Maint / Mgmt
- −$321
- Net cashflow
- $153
Break-even live
UW: 25.0% down · 7.5% · 30yr · 1.5% tax · 5.0% vac · 8.0% maint · 8.0% mgmt
Financing live
Cash to close
- Down payment
- $44,781
- Closing costs
- $5,374
- Reserves months
- —
- Total cash needed
- —
Loan-product check · same deal, 3 products live
Conventional
25% down · 7.5% · 30yr
- Down + closing
- —
- Monthly P&I
- —
- Monthly cashflow
- —
- DSCR
- —
- Eligible?
- —
Personal DTI + credit; lowest rate.
DSCR
20% down · 8.5% · 30yr
- Down + closing
- —
- Monthly P&I
- —
- Monthly cashflow
- —
- DSCR
- —
- Eligible?
- —
No personal income docs; deal must DSCR.
Hard money
10% down · 12.0% · 12mo
- Down + closing
- —
- Monthly P&I
- —
- Monthly cashflow
- —
- DSCR
- —
- Eligible?
- —
Short-term bridge; refi at stabilization.
Rent comps 19 comps
| Address | Beds | Baths | Sqft | Rent | $/sqft | DOM | Units | Dist |
|---|---|---|---|---|---|---|---|---|
| 189 Westminster Ave Buffalo, NY | 4.0 | 1.5 | 1065 | $1,595 | $1.50 | 10d | 1 | 0.40mi |
| 220 Dartmouth Ave Buffalo, NY | 2.0 | 1.0 | 1000 | $1,100 | $1.10 | 23d | 1 | 0.42mi |
| 265 Lisbon Ave Unit 2 Buffalo, NY | 3.0 | 1.0 | 1200 | $1,400 | $1.17 | 43d | 1 | 0.50mi |
| 263 Minnesota Ave Unit Upper Buffalo, NY | 3.0 | 1.0 | 1242 | $1,500 | $1.21 | 14d | 1 | 0.55mi |
| 222 Lisbon Ave Unit Upper Buffalo, NY | 3.0 | 1.0 | 1400 | $1,400 | $1.00 | 43d | 1 | 0.58mi |
| 222 Lisbon Ave Buffalo, NY | 4.0 | 1.0 | 1300 | $1,400 | $1.08 | 23d | 1 | 0.58mi |
| 97 Davidson Ave Buffalo, NY | 3.0 | 1.0 | 925 | $1,495 | $1.62 | 1d | 1 | 0.68mi |
| 140 Parkridge Ave Buffalo, NY | 3.0 | 1.0 | 990 | $1,500 | $1.52 | 43d | 1 | 0.87mi |
| 92 Lasalle Ave Unit 1 Buffalo, NY | 2.0 | 1.0 | 1000 | $1,150 | $1.15 | 43d | 1 | 0.90mi |
| 40 Lisbon Ave Unit Upper Buffalo, NY | 2.0 | 1.0 | 1057 | $1,500 | $1.42 | 11d | 1 | 0.92mi |
| 89 Lasalle Ave Buffalo, NY | 1.0–4.0 | 1.0–4.0 | 1024 | $2,291 | $2.24 | 1d | 10 | 0.96mi |
| 60 Englewood Ave Buffalo, NY | 4.0 | 1.0 | 1400 | $1,650 | $1.18 | 1d | 1 | 0.98mi |
| 26 Custer St Buffalo, NY | 2.0 | 1.0 | 1000 | $1,300 | $1.30 | 43d | 1 | 1.00mi |
| 91 Springville Ave Buffalo, NY | 4.0 | 2.0 | 1660 | $2,350 | $1.42 | 23d | 1 | 1.04mi |
| 44 Aurora Dr Buffalo, NY | 3.0 | 1.0 | 1272 | $3,300 | $2.59 | 1d | 1 | 1.20mi |
| 17 Proctor Ave Unit 1 Buffalo, NY | 2.0 | 1.0 | 900 | $1,100 | $1.22 | 43d | 1 | 1.43mi |
| 348 Capen Blvd Buffalo, NY | 3.0 | 1.5 | 1424 | $2,200 | $1.54 | 1d | 1 | 1.44mi |
| 74 Dorris Ave Buffalo, NY | 3.0 | 1.0 | 1200 | $1,450 | $1.21 | 43d | 1 | 1.46mi |
| 163 Carmel Rd Buffalo, NY | 3.0 | 1.0 | 1400 | $1,800 | $1.29 | 2d | 1 | 1.49mi |
Listing history 14 events
-
2026-06-13statusdays on market $179,123 Pending 33 DOM
-
2026-06-10days on market $179,123 Active 32 DOM
-
2026-06-09days on market $179,123 Active 31 DOM
-
2026-06-08days on market $179,123 Active 30 DOM
-
2026-06-07days on market $179,123 Active 29 DOM
-
2026-06-03days on market $179,123 Active 25 DOM
-
2026-06-02days on market $179,123 Active 24 DOM
-
2026-06-01days on market $179,123 Active 23 DOM
-
2026-05-31days on market $179,123 Active 22 DOM
-
2026-05-08$179,123 Active 1220-char remark
-
2015-12-01historical
-
2015-05-13$61,123 Active
-
2014-03-03historical
-
2013-09-09$61,123
ⓘ Source: listings_history table (triggers on properties + properties_extension) + one-shot
backfill from property_details.listing_events for pre-trigger history.
Tax reassessment forecast NY · Partial reset (capped growth)
- Current annual tax
- $485 · $40/mo
- Projected year-2 tax
- $1,756 · $146/mo
- Expected delta
- +$1,271/yr (+$106/mo · 261.8%)
ⓘ Screening estimate from a state-policy table — verify with the county assessor before closing.
Climate risk First Street
- Flood 1/10 Low FEMA zone X (unshaded) · 0% chance over 30 yrs
- Wildfire 1/10 Low
- Heat 3/10 Moderate 7 d/yr ≥92°F today · 15 d/yr by 30 yrs out
- Wind 1/10 Low
- Air quality 3/10 Moderate 2 unhealthy d/yr today · 3 by 30 yrs out
Nearby sold comps map
Loading sold comps map…
Walkable amenities ~0.75 mi
Loading nearby amenities…
Taxation est. · year 1
- Rental income
- $18,340
- − Mortgage interest
- −$10,034
- − Property taxes
- −$485
- − Insurance
- −$896
- − Repairs & maintenance
- −$1,467
- − Management
- −$1,467
- − Depreciation
- −$5,211
- Taxable loss
- −$1,220
- Est. tax savings @ 24.0%
- +$293
- After-tax cash flow
- $2,128/yr
For passive investors: Depreciation is non-cash, so a rental often shows a tax loss while cash-flowing — sheltering income. Rental losses are passive: they offset passive income freely, and up to $25,000/yr can offset ordinary (W-2) income if you actively participate and your MAGI is under $100k (phasing out to $0 by $150k); unused losses carry forward. On sale, claimed depreciation is recaptured at up to 25%, and gains may owe capital-gains tax (a 1031 exchange can defer both). Figures are a year-1 estimate at your 24.0% rate — not tax advice; consult a CPA.
Schools (NCES district)
- District
- Buffalo City School District
- NCES district ID
- 3605850
- Math proficiency
- 41% ▲ 11.00%
- Reading proficiency
- 40% ▲ 7.00%
- Median HH income
- $31,665
- Composite
- 33.17/100
- National rank
- #5544
- State rank
- #535 of 590 in NY
Livability — Buffalo
- Score
- 77/100
- State rank
- #195
- US rank
- #3011
Category grades
Schools grade is shown separately in the Schools card above.
Census & demographics
- Census place
- Buffalo, NY
- County
- Erie County · 714,559 people
- City population
- 440,021
- Metro
- Buffalo-Cheektowaga, NY
- Population (ZIP)
- 42,524
- Household income
- $44,955
- Rent vs Own
- Severe rent burden
- 2873.0
Population outlook (Erie County) Hauer SSP2
- Today (2025)
- 933,037 people
- By 2030
- 935,181 · +0.2%
- By 2040
- 928,531 · -0.5%
- By 2050
- 905,725 · -2.9%
- By 2075
- 834,037 · -10.6%
- By 2100
- 708,033 · -24.1%
Race, ethnicity, and origin ACS 2023
- Neighborhood character
- Predominantly Black (67%)
- Race & ethnicity
- Black 67% White 15% Asian 7% Hispanic / Latino 6% Two or more races 6%
- Hispanic origin (detail)
- Puerto Rican 4%
- Common ancestry
- Romanian 4% Lithuanian 1% Italian 1%
- Foreign-born
- 9% · Canada, China
- Languages at home
- 88% English-only · Other Indo-European 4% Spanish 4% Chinese 1%
Political lean MEDSL · Erie
- 2024 margin
- Lean D (+9.7) · D 54.8% · R 45.2%
- 2008→2024 swing
- -7.9pp toward R · 2008: 17.5pp · 2024: 9.7pp
- All cycles
- 2024: D+9.7 2020: D+14.7 2016: D+4.8 2012: D+15.6 2008: D+17.5
Not yet ingested
- Civics
- —
Market trends
- HPI YoY
- ▼ -126.29%
- Current HPI
- 295.2966
- Rent YoY
- ▲ 0.67%
- Metro
- Buffalo-Cheektowaga, NY
- State GDP YoY
- ▲ 2.60%
- F500 in state
- 92
Industry mix (Fortune 500 HQ in NY)
| Industry | F500 HQs | Revenue |
|---|---|---|
| Financial Services | 10 | $950B |
|
||
| Consumer Goods | 9 | $162B |
|
||
| Insurance | 4 | $225B |
|
||
| Telecommunications | 2 | $144B |
|
||
| Pharmaceuticals | 2 | $112B |
|
||
| Media / Entertainment | 2 | $69B |
|
||
Price history
+193.1% since first listed7 events — show timeline
- 2026-06-11 Pending — WNYREIS
- 2026-05-29 Relisted — WNYREIS
- 2026-05-08 Listed $179,123 WNYREIS
- 2015-12-01 Listing Removed — WNYREIS
- 2015-05-13 Listed $61,123 WNYREIS
- 2014-03-03 Listing Removed — WNYREIS
- 2013-09-09 Listed $61,123 WNYREIS
Property tax history
+5.8%/yrLatest (2025): $485 · +23.7% YoY. Source: county tax records.
Cash-flow waterfall
monthlySold comps — $/sqft
last 12 mo · ≤1 miLoading sold comps…