72985 Somera Rd · Palm Desert, CA
Flood risk 1/10 · Minimal
- FEMA flood zone
- X
- Chance of flooding over 30 yrs
- 0.0%
- Est. flood insurance / yr
- $507 – $1,088
Fire risk 5/10 · Moderate
- Est. fire insurance / yr
- $659 – $1,223
Heat risk 9/10 · Severe
- Hot days now (above 111°F)
- 8 days/yr
- Hot days in 30 yrs
- 23 days/yr
Wind risk 1/10 · Minimal
- Chance of severe wind over 30 yrs
- —
Air-quality risk 4/10 · Minor
- Unhealthy air days now
- 5 days/yr
- Unhealthy air days in 30 yrs
- 6 days/yr
Risk factors via First Street. Map © Google.
Why this score? — see what drove the B- grade
The composite is a weighted blend of 9 inputs, each scored 0–100. Each bar is that input's sub-score; the figure is the points it added to the 100-point composite (weight × sub-score).
- Cash flow +30.0/30.0
- 1% rule +10.0/10.0
- DSCR +10.0/10.0
- ARV discount +7.5/15.0
- Schools +3.8/10.0
- Rent growth +2.9/5.0
- Livability +2.6/5.0
- Condition / age +2.5/5.0
- Appreciation +0.0/10.0
$289,000
🖨 Deal sheet 📄 Offer letter ✓ Due diligence
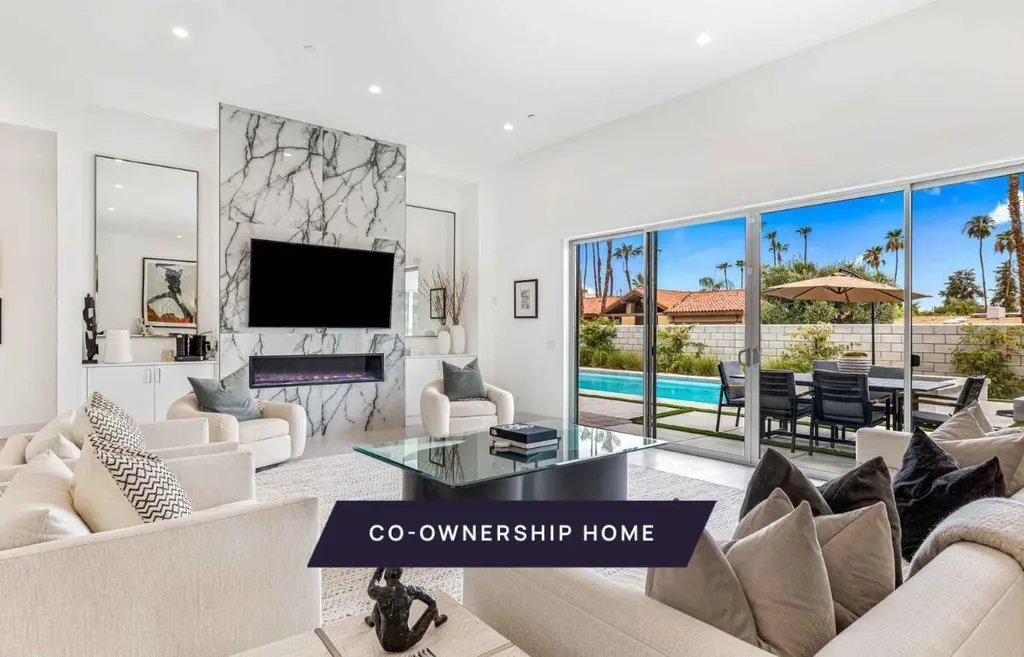
Listing remarks
New co-ownership opportunity by Pacaso: Own one-eighth of Somera, a professionally managed, turnkey home. Looking for a slice of privacy in Palm Desert? Tucked inside a walled yard on an elevated corner lot, this home is ideal for indoor/outdoor desert living. The open floor plan features 12-foot ceilings in the living room and a large glass door that opens to the pool, spa and views of the nearby mountains. The gourmet kitchen is every cook's dream, with high-end appliances and lots of counter space. The spacious primary bedroom is a homeowner oasis, offering an en suite bathroom with an oversized shower and two large closets -- and more mountain views. Three guest rooms await family and f
Key facts
- Turnkey home
- Elevated corner lot
- Large glass door
Tags
Neighborhood map
What this means for you Summary
Snapshot
- This is a 4-bed/4.0-bath single-family listed at $289k.
Deal economics
- At list price, monthly cash flow is $4k ($47k/yr) — positive.
- The deal already cash-flows at list — no discount required.
- Meets the 1% rule at list price ($7k rent vs $289k).
- Recommended offer: $285k (1.5% below list) — sets the bar for market timing.
- Cap rate 22.4% vs local median 3.5% in Palm Desert — top-decile yield for the area; either an underpriced asset or a hidden risk that comps aren't pricing in. Stress-test before assuming the spread holds.
Location & tenants
- Location reads 51/100 on livability (#1,050 in CA) — a working-class tenant base; expect higher turnover. Strengths: schools A-, employment B+, housing B; Watch: crime D, amenities F, commute F.
- Desert Sands Unified (suburban): math 31% / reading 56% proficiency, ranked #199 of 517 in CA (top 38%) — families likely to look elsewhere, expect single-tenant / working-renter base with shorter leases.
- Market conditions: Rents rising (+1.6%/yr); 545 active listings in the ZIP; 21 comparable units currently listed for rent nearby; rentals lingering (median 44d on market — plan ~5-8 weeks vacancy on turnover, expect pricing pressure); 62% of comp listings sitting > 30 days — soft ceiling on asking rent; 9,195 units permitted in Riverside County in 2024 (1,512 in 5+ unit buildings).
- At $7,447/mo this rent would consume 127% of the median local household income ($70k/yr) (locally 1734% of renters already pay >50% of income on rent) — very limited rent-growth headroom before tenants either downsize or default.
Forward outlook
- Local home prices are declining (-3.0%/yr); year-one equity from $2k of loan paydown is wiped out by about $9k of value loss. Plan a longer hold.
- Riverside County population projected at +22% by 2050 — long-run rental-demand tailwind backs the buy-and-hold thesis.
- At projected returns (-3.0% appreciation + 1.6% rent growth), your $81k cash investment doubles in ~2 years — after that, you're playing with house money.
Negotiation context
- It's been on market 27 days — a 2% lower offer ($285k) is reasonable based on typical stale-listing flexibility.
- 12 sale attempts since 5y ago with the ask held roughly flat each time — persistent listings suggest the price (not the market) is what's stuck; bring a comps-based counter.
Risks & watch-outs
- Climate carrying-cost: moderate wildfire risk; extreme-heat days projected 8→23/yr by 2055 (HVAC capex compounding) — expect insurance premiums to compound above CPI over the hold.
Questions for the listing agent
- Is there a deadline driving the sale (1031 exchange, divorce, estate, relocation)? That informs how much negotiation room exists.
- Schools are A-rated — typically a magnet for longer-tenancy family renters. What's the average tenant stay here, and is there a school-zone premium baked into asking?
- Crime grade is D in this area — have there been break-ins, vandalism, or insurance claims at this property in the last 3 years? What carrier currently insures it and at what premium?
- What's the average days-on-market for RENTAL listings here right now (not sales)? A rising rental-DOM trend means longer vacancies and softer asking-rent achievability than the comps imply.
- What's the recent tenant-quality profile in this submarket — average credit score on applications, eviction rate, late-payment / NSF rate, and stable-employment percentage? A property-management company in the area should have these aggregated.
- How much new for-sale + rental construction is in the pipeline within 1–3 miles? Heavy new supply typically softens prices + rents 12–24 months out; constrained supply supports both.
Investment metrics
- 1% rule
- 2.58% ✓
- Cap rate
- 22.43%
- Cash-on-cash
- 57.63%
- DSCR
- 3.56
- GRM
- 3.2
CMA / ARV
- ARV (on-the-fly)
- $1,632,108
- Comps found
- 12
Show comp detail 12 sales within ~0.75 mi
| Address | Dist | Beds/Ba | Sqft | Sold | Price | $/sf | Match |
|---|---|---|---|---|---|---|---|
| 72920 Homestead Rd | 0.15mi | 4/3.5 | 3,079 (-3%) | 0mo | $1,950,000 | $633 | 86 |
| 72970 Deer Grass Dr | 0.17mi | 5/5.0 (+1) | 3,190 (+1%) | 0mo | $1,970,000 | $618 | 82 |
| 73043 Monterra Cir S | 0.20mi | 3/4.5 (-1) | 3,225 (+2%) | 1mo | $1,350,000 | $419 | 80 |
| 73062 Galleria Ct | 0.24mi | 3/4.5 (-1) | 3,225 (+2%) | 3mo | $2,050,000 | $636 | 76 |
| 73230 Desert Rose Dr | 0.30mi | 3/3.0 (-1) | 3,087 (-2%) | 4mo | $1,425,000 | $462 | 69 |
| 73286 Goldflower St | 0.48mi | 4/3.0 | 3,040 (-4%) | 2mo | $2,060,000 | $678 | 65 |
| 73165 Mirasol Ct | 0.27mi | 4/3.5 | 2,796 (-12%) | 3mo | $1,050,000 | $376 | 64 |
| 73298 Buckboard Trl | 0.36mi | 4/3.0 | 2,894 (-8%) | 3mo | $1,492,000 | $516 | 62 |
| 135 Vista Valle | 0.68mi | 3/3.5 (-1) | 3,206 (+1%) | 2mo | $1,100,000 | $343 | 57 |
| 72668 Skyward Way | 0.32mi | 3/4.0 (-1) | 2,716 (-14%) | 2mo | $989,900 | $364 | 55 |
| 48365 Alan Cir | 0.36mi | 4/5.0 | 3,594 (+14%) | 2mo | $2,075,000 | $577 | 55 |
| 47386 Marrakesh Dr | 0.74mi | 3/3.0 (-1) | 2,705 (-14%) | 1mo | $1,350,000 | $499 | 31 |
Match score weights: distance 35% · size 25% · config 20% · recency 20%. Top-matched comps best support the ARV.
Projected returns pro-forma
-3.0% appreciation · 1.6% rent growth · sell at horizon
- IRR
- 54.6%
- Equity multiple
- 3.35×
- Total profit
- $190,439
- Equity at exit
- $43,091
- IRR
- 59.1%
- Equity multiple
- 6.48×
- Total profit
- $443,712
- Equity at exit
- $24,987
Cash invested: $80,920 (down + closing). Projections, not guarantees.
Landlord ↔ Tenant lean methodology
- Overall (STATE)
- 18 Strongly Tenant-Friendly
- State California
- 18 Strongly Tenant-Friendly · D+13
- County
- — inherits STATE
- City
- — inherits STATE
ZIP-level market 92260
- Rents YoY
- 1.6%
- Active inventory
- 545
- Price-to-rent
- 3.2×
Monthly cashflow live
- Estimated rent
- $7,447 high interval (Pro) →
- Mortgage (P&I)
- −$1,516
- Tax est. 1.5%
- −$361 /mo · $4,335/yr
- Insurance
- −$120
- HOA
- −$0
- Vacancy / Maint / Mgmt
- −$1,564
- Net cashflow
- $3,886
Break-even live
UW: 25.0% down · 7.5% · 30yr · 1.5% tax · 5.0% vac · 8.0% maint · 8.0% mgmt
Financing live
Cash to close
- Down payment
- $72,250
- Closing costs
- $8,670
- Reserves months
- —
- Total cash needed
- —
Loan-product check · same deal, 3 products live
Conventional
25% down · 7.5% · 30yr
- Down + closing
- —
- Monthly P&I
- —
- Monthly cashflow
- —
- DSCR
- —
- Eligible?
- —
Personal DTI + credit; lowest rate.
DSCR
20% down · 8.5% · 30yr
- Down + closing
- —
- Monthly P&I
- —
- Monthly cashflow
- —
- DSCR
- —
- Eligible?
- —
No personal income docs; deal must DSCR.
Hard money
10% down · 12.0% · 12mo
- Down + closing
- —
- Monthly P&I
- —
- Monthly cashflow
- —
- DSCR
- —
- Eligible?
- —
Short-term bridge; refi at stabilization.
Rent comps 21 comps
| Address | Beds | Baths | Sqft | Rent | $/sqft | DOM | Units | Dist |
|---|---|---|---|---|---|---|---|---|
| 72992 Bel Air Rd Palm Desert, CA | 4.0 | 3.5 | 3306 | $6,000 | $1.81 | 18d | 1 | 0.09mi |
| 73110 Calliandra St Palm Desert, CA | 3.0 | 3.0 | 2973 | $7,000 | $2.35 | 44d | 1 | 0.14mi |
| 73055 Amber St Palm Desert, CA | 3.0 | 2.5 | 2534 | $9,250 | $3.65 | 44d | 1 | 0.17mi |
| 72827 Haystack Rd Palm Desert, CA | 4.0 | 4.0 | 2247 | $7,500 | $3.34 | 44d | 1 | 0.19mi |
| 72870 Deer Grass Dr Palm Desert, CA | 4.0 | 2.5 | 2220 | $5,999 | $2.70 | 44d | 1 | 0.20mi |
| 73310 Calliandra St Palm Desert, CA | 3.0 | 3.5 | 2225 | $6,600 | $2.97 | 3d | 1 | 0.34mi |
| 72816 Mesa View Dr Palm Desert, CA | 4.0 | 3.0 | 2766 | $4,750 | $1.72 | 24d | 1 | 0.45mi |
| 72827 Bursera Way Palm Desert, CA | 4.0 | 4.0 | 2849 | $17,000 | $5.97 | 44d | 1 | 0.46mi |
| 47967 Sun Corral Trl Palm Desert, CA | 4.0 | 4.0 | 2374 | $10,000 | $4.21 | 24d | 1 | 0.58mi |
| 73460 Agave Ln Palm Desert, CA | 3.0 | 3.0 | 3585 | $15,000 | $4.18 | 44d | 1 | 0.60mi |
| 47192 El Agadir Palm Desert, CA | 3.0 | 3.0 | 2426 | $12,000 | $4.95 | 44d | 1 | 0.73mi |
| 73657 Agave Ln Palm Desert, CA | 3.0 | 3.0 | 3194 | $14,000 | $4.38 | 24d | 1 | 0.78mi |
| 47171 El Agadir Palm Desert, CA | 3.0 | 3.0 | 2293 | $7,000 | $3.05 | 44d | 1 | 0.78mi |
| 73115 Crosby Ln Palm Desert, CA | 4.0 | 4.5 | 4419 | $21,000 | $4.75 | 1d | 1 | 0.82mi |
| 48832 Cassia Pl Palm Desert, CA | 3.0 | 3.5 | 2238 | $12,000 | $5.36 | 44d | 1 | 0.85mi |
| 47430 Rabat Dr Palm Desert, CA | 3.0 | 3.0 | 2339 | $12,000 | $5.13 | 44d | 1 | 0.85mi |
| 73310 Ironwood St Palm Desert, CA | 3.0 | 4.0 | 3224 | $7,850 | $2.43 | 44d | 1 | 0.91mi |
| 47075 Marrakesh Dr Palm Desert, CA | 3.0 | 4.0 | 2466 | $6,000 | $2.43 | 44d | 1 | 1.03mi |
| 72689 Beavertail St Palm Desert, CA | 4.0 | 3.5 | 3116 | $8,500 | $2.73 | 24d | 1 | 1.05mi |
| 73640 Joshua Tree St Palm Desert, CA | 4.0 | 3.0 | 3127 | $5,750 | $1.84 | 24d | 1 | 1.23mi |
| 74085 Setting Sun Trl Palm Desert, CA | 4.0 | 4.5 | 2699 | $9,750 | $3.61 | 44d | 1 | 1.28mi |
Listing history 45 events
-
2026-06-18days on market $289,000 Active 27 DOM
-
2026-06-17days on market $289,000 Active 26 DOM
-
2026-06-16days on market $289,000 Active 25 DOM
-
2026-06-15days on market $289,000 Active 24 DOM
-
2026-06-13days on market $289,000 Active 22 DOM
-
2026-06-09days on market $289,000 Active 18 DOM
-
2026-06-08days on market $289,000 Active 17 DOM
-
2026-06-07days on market $289,000 Active 16 DOM
-
2026-06-04days on market $289,000 Active 13 DOM
-
2026-06-03days on market $289,000 Active 12 DOM
-
2026-06-02days on market $289,000 Active 11 DOM
-
2026-06-01days on market $289,000 Active 10 DOM
-
2026-05-31days on market $289,000 Active 9 DOM
-
2026-05-20historical
-
2026-02-25$289,000 Active
-
2026-02-24historical
-
2025-10-16$299,000 Active
-
2025-08-12historical
-
2025-06-13historical
-
2025-05-01$349,000 Active
-
2025-04-23historical
-
2025-02-14price $275,000
-
2025-02-12$325,000 Active
-
2025-01-22$349,000 Active
-
2024-12-16historical
-
2024-11-16price $355,000
-
2024-09-17$359,000 Active
-
2024-07-11historical
-
2024-03-22$359,000 Active
-
2024-02-20soldstatus $334,000 Closed
-
2024-01-26status Pending
-
2023-11-01$334,000 Active
-
2023-09-19historical
-
2023-08-23$334,000 Active
-
2023-08-23historical
-
2023-07-03$334,000 Active
-
2022-08-09historical
-
2022-04-08$315,000 Active
-
2022-04-05soldstatus $1,850,000 Closed
-
2022-01-29historical Active Under Contract
-
2021-12-19price $1,949,000
-
2021-12-06price $2,099,000
-
2021-10-31price $2,199,000
-
2021-10-31$1,199,000 Active
-
2018-03-28soldstatus $210,000
ⓘ Source: listings_history table (triggers on properties + properties_extension) + one-shot
backfill from property_details.listing_events for pre-trigger history.
Climate risk First Street
- Flood 1/10 Low FEMA zone X · 0% chance over 30 yrs
- Wildfire 5/10 Major
- Heat 9/10 Extreme 8 d/yr ≥111°F today · 23 d/yr by 30 yrs out
- Wind 1/10 Low
- Air quality 4/10 Moderate 5 unhealthy d/yr today · 6 by 30 yrs out
Nearby sold comps map
Loading sold comps map…
Walkable amenities ~0.75 mi
Loading nearby amenities…
Taxation est. · year 1
- Rental income
- $89,366
- − Mortgage interest
- −$16,188
- − Property taxes
- −$4,335
- − Insurance
- −$1,445
- − Repairs & maintenance
- −$7,149
- − Management
- −$7,149
- − Depreciation
- −$8,407
- Taxable income
- $44,692
- Est. tax owed @ 24.0%
- −$10,726
- After-tax cash flow
- $35,907/yr
For passive investors: Depreciation is non-cash, so a rental often shows a tax loss while cash-flowing — sheltering income. Rental losses are passive: they offset passive income freely, and up to $25,000/yr can offset ordinary (W-2) income if you actively participate and your MAGI is under $100k (phasing out to $0 by $150k); unused losses carry forward. On sale, claimed depreciation is recaptured at up to 25%, and gains may owe capital-gains tax (a 1031 exchange can defer both). Figures are a year-1 estimate at your 24.0% rate — not tax advice; consult a CPA.
Schools (NCES district)
- District
- Desert Sands Unified
- NCES district ID
- 0611110
- Math proficiency
- 31% ▼ -4.00%
- Reading proficiency
- 56% ▲ 7.00%
- Median HH income
- $54,957
- Composite
- 37.77/100
- National rank
- #4346
- State rank
- #199 of 517 in CA
Livability — Palm Desert
- Score
- 51/100
- State rank
- #1050
- US rank
- #25164
Category grades
Schools grade is shown separately in the Schools card above.
Census & demographics
- Census place
- Palm Desert, CA
- County
- Riverside County · 2,287,001 people
- City population
- 58,615
- Metro
- Riverside-San Bernardino-Ontario, CA
- Population (ZIP)
- 30,523
- Household income
- $70,091
- Rent vs Own
- Severe rent burden
- 1734.0
Population outlook (Riverside County) Hauer SSP2
- Today (2025)
- 2,664,475 people
- By 2030
- 2,802,692 · +5.2%
- By 2040
- 3,050,904 · +14.5%
- By 2050
- 3,256,783 · +22.2%
- By 2075
- 3,655,058 · +37.2%
- By 2100
- 3,766,594 · +41.4%
Race, ethnicity, and origin ACS 2023
- Neighborhood character
- Majority White (61%)
- Race & ethnicity
- White 61% Hispanic / Latino 31% Two or more races 20% Asian 4% Black 2%
- Hispanic origin (detail)
- Mexican 25%
- Common ancestry
- Italian 4% Lithuanian 3% Slovak 2%
- Foreign-born
- 18% · Canada, South Korea, Vietnam
- Languages at home
- 73% English-only · Spanish 22% French/Haitian/Cajun 1% Other Indo-European 1%
Political lean MEDSL · Riverside
- 2024 margin
- Toss-up / Even · D 48.0% · R 49.3% · Other 2.6%
- 2008→2024 swing
- -3.6pp toward R · 2008: 2.3pp · 2024: -1.3pp
- All cycles
- 2024: R+1.3 2020: D+8.0 2016: D+4.3 2012: R+0.4 2008: D+2.3
Not yet ingested
- Civics
- —
Market trends
- HPI YoY
- ▼ -364.94%
- Current HPI
- 294.9425
- Rent YoY
- ▲ 1.60%
- Metro
- Riverside-San Bernardino-Ontario, CA
- State GDP YoY
- ▲ 3.21%
- F500 in state
- 116
Industry mix (Fortune 500 HQ in CA)
| Industry | F500 HQs | Revenue |
|---|---|---|
| Technology | 27 | $1,492B |
|
||
| Financial Services | 3 | $174B |
|
||
| Retail | 3 | $44B |
|
||
| Insurance | 3 | $26B |
|
||
| Media / Entertainment | 2 | $115B |
|
||
| Pharmaceuticals / Biotech | 2 | $62B |
|
||
Price history
+37.6% since first listed32 events — show timeline
- 2026-05-20 Listing Removed — GPSMLS
- 2026-02-25 Listed $289,000 GPSMLS
- 2026-02-24 Listing Removed — GPSMLS
- 2025-10-16 Listed $299,000 GPSMLS
- 2025-08-12 Listing Removed — GPSMLS
- 2025-06-13 Listing Removed — GPSMLS
- 2025-05-01 Listed $349,000 GPSMLS
- 2025-04-23 Listing Removed — GPSMLS
- 2025-02-14 Price Changed $275,000 GPSMLS
- 2025-02-12 Listed $325,000 GPSMLS
- 2025-01-22 Listed $349,000 GPSMLS
- 2024-12-16 Listing Removed — GPSMLS
- 2024-11-16 Price Changed $355,000 GPSMLS
- 2024-09-17 Listed $359,000 GPSMLS
- 2024-07-11 Listing Removed — GPSMLS
- 2024-03-22 Listed $359,000 GPSMLS
- 2024-02-20 Sold (MLS) $334,000 GPSMLS
- 2024-01-26 Pending — GPSMLS
- 2023-11-01 Listed $334,000 GPSMLS
- 2023-09-19 Listing Removed — GPSMLS
- 2023-08-23 Listing Removed — GPSMLS
- 2023-08-23 Listed $334,000 GPSMLS
- 2023-07-03 Listed $334,000 GPSMLS
- 2022-08-09 Listing Removed — GPSMLS
- 2022-04-08 Listed $315,000 GPSMLS
- 2022-04-05 Sold (MLS) $1,850,000 GPSMLS
- 2022-01-29 Contingent — GPSMLS
- 2021-12-19 Price Changed $1,949,000 GPSMLS
- 2021-12-06 Price Changed $2,099,000 GPSMLS
- 2021-10-31 Price Changed $2,199,000 GPSMLS
- 2021-10-31 Listed $1,199,000 GPSMLS
- 2018-03-28 Sold (Public Records) $210,000 Public Records
Property tax history
+28.7%/yrLatest (2025): $26,456 · +2.3% YoY. Source: county tax records.
Cash-flow waterfall
monthlySold comps — $/sqft
last 12 mo · ≤1 miLoading sold comps…