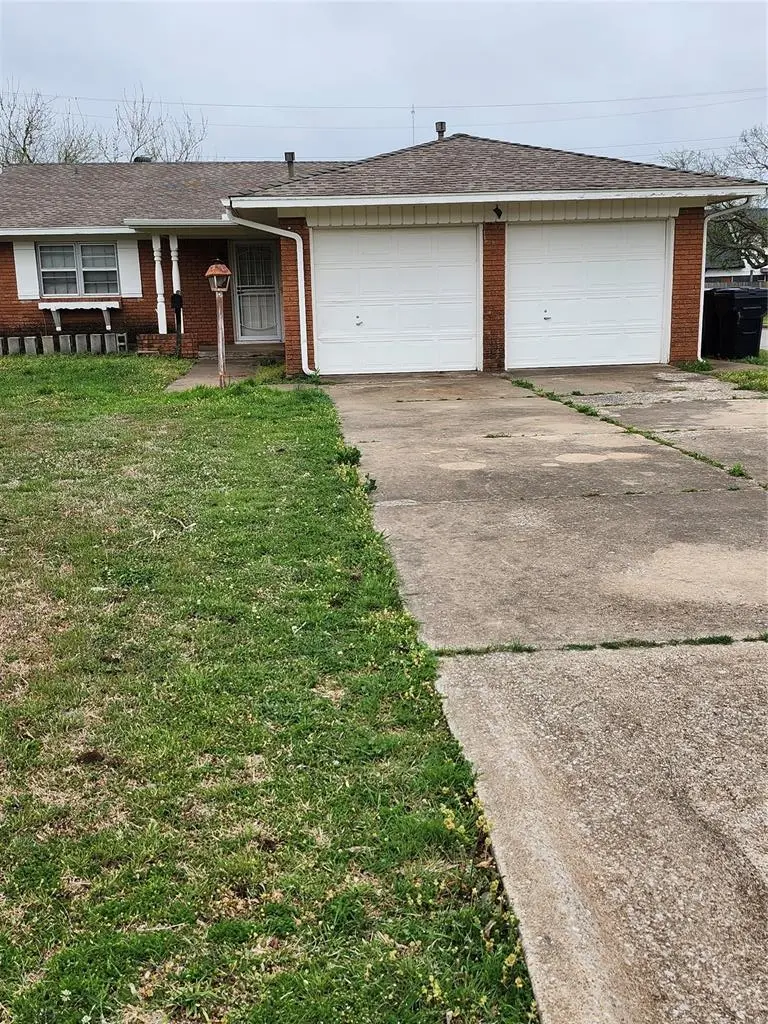
336 NW 81st St · Oklahoma City, OK
Flood risk 1/10 · Minimal
- FEMA flood zone
- X (unshaded)
- Chance of flooding over 30 yrs
- 0.0%
- Est. flood insurance / yr
- $507 – $1,088
Fire risk 2/10 · Minimal
- Est. fire insurance / yr
- $2,463 – $4,575
Heat risk 6/10 · Moderate
- Hot days now (above 107°F)
- 7 days/yr
- Hot days in 30 yrs
- 19 days/yr
Wind risk 2/10 · Minimal
- Chance of severe wind over 30 yrs
- 3.0%
Air-quality risk 2/10 · Minimal
- Unhealthy air days now
- 2 days/yr
- Unhealthy air days in 30 yrs
- 2 days/yr
Risk factors via First Street. Map © Google.
Why this score? — see what drove the B grade
The composite is a weighted blend of 9 inputs, each scored 0–100. Each bar is that input's sub-score; the figure is the points it added to the 100-point composite (weight × sub-score).
- Cash flow +28.8/30.0
- ARV discount +15.0/15.0
- DSCR +10.0/10.0
- 1% rule +6.9/10.0
- Livability +4.0/5.0
- Rent growth +3.4/5.0
- Condition / age +2.5/5.0
- Schools +0.7/10.0
- Appreciation +0.0/10.0
$115,000
🖨 Deal sheet 📄 Offer letter ✓ Due diligence
Listing remarks
THIS HOME IS ON A CORNER LOT, WITH A LARGE BACK YARD FENCED ALL AROUND. ONE OF A RARITY IN THE NEIGHBORHOOD WITH 3 BEDS, 2 BATHS, 2 CAR GARAGE. REASONABLY PRICE DUE TO UPDATING AND MINOR REPAIRS TO BE DONE BY THE BUYERS. PROPERTY IS BEING SOLD IN "AS IS" CONDITION. MULTIPLE OFFERS EXPECTED! OFFERS ACCEPTED BETWEEN APRIL 8th, 2026 THROUGH APRIL 14th, 2026. DUE BY 12:00 NOON!!! OFFERS WILL BE CONSIDERED BASED ON BEST OFFER AND BEST TERMS!
Key facts
- Large back yard
- Fenced all around
- Corner lot
Tags
Neighborhood map
What this means for you Summary
Snapshot
- This is a 3-bed/2.0-bath single-family listed at $115k.
Deal economics
- At list price, monthly cash flow is $386 ($5k/yr) — positive.
- The deal already cash-flows at list — no discount required.
- Meets the 1% rule at list price ($1k rent vs $115k).
- Recommended offer: $113k (1.5% below list) — sets the bar for market timing.
- Cap rate 10.3% vs local median 3.7% in Oklahoma City — top-decile yield for the area; either an underpriced asset or a hidden risk that comps aren't pricing in. Stress-test before assuming the spread holds.
Location & tenants
- Location reads 80/100 on livability (#3 in OK, #1,635 nationally) — a professional / high-income tenant draw. Strengths: amenities A+, commute A+, cost of living A+; Watch: crime F.
- Oklahoma City (urban): math 7% / reading 10% proficiency, ranked #254 of 270 in OK (top 94%) — low school quality limits family demand, transient renter base, plan for 1-2y turnover; 82% free/reduced lunch — lower-income household profile, screen leases tightly.
- Zoned schools: Nichols Hills Es (math 17% / reading 17%, grade F, #540 of 845 statewide, top 68%, 494 students, 0% FRL); Douglass Hs (math 2% / reading 2%, grade F, #445 of 447 statewide, top 100%, 556 students, 0% FRL) — zoned schools average 0% FRL vs 82% district-wide (82 pts lower); this property's tenant base skews higher-income than the district average.
- Market conditions: Rents rising (+3.5%/yr); 145 active listings in the ZIP; 31 comparable units currently listed for rent nearby; rentals at typical pace (median 20d on market — plan ~3-4 weeks tenant-placement turnaround); 5,365 units permitted in Oklahoma County in 2024 (569 in 5+ unit buildings).
Forward outlook
- Local home prices are declining (-3.0%/yr); year-one equity from $795 of loan paydown is wiped out by about $3k of value loss. Plan a longer hold.
- Oklahoma County population projected at +41% by 2050 — long-run rental-demand tailwind backs the buy-and-hold thesis.
- At projected returns (-3.0% appreciation + 3.5% rent growth), your $32k cash investment doubles in ~8 years — after that, you're playing with house money.
Negotiation context
- It's been on market 15 days — a 2% lower offer ($113k) is reasonable based on typical stale-listing flexibility.
Risks & watch-outs
- Climate carrying-cost: extreme-heat days projected 7→19/yr by 2055 (HVAC capex compounding) — expect insurance premiums to compound above CPI over the hold.
Questions for the listing agent
- Built in 1960 — when were the roof, HVAC, electrical panel, plumbing, and water heater last replaced?
- Is there a deadline driving the sale (1031 exchange, divorce, estate, relocation)? That informs how much negotiation room exists.
- Schools are F-rated, which usually means shorter tenancies and higher turnover. Who's the typical renter profile here, and what's been the actual vacancy rate?
- Crime grade is F in this area — have there been break-ins, vandalism, or insurance claims at this property in the last 3 years? What carrier currently insures it and at what premium?
- What's the average days-on-market for RENTAL listings here right now (not sales)? A rising rental-DOM trend means longer vacancies and softer asking-rent achievability than the comps imply.
- What's the recent tenant-quality profile in this submarket — average credit score on applications, eviction rate, late-payment / NSF rate, and stable-employment percentage? A property-management company in the area should have these aggregated.
- How much new for-sale + rental construction is in the pipeline within 1–3 miles? Heavy new supply typically softens prices + rents 12–24 months out; constrained supply supports both.
Investment metrics
- 1% rule
- 1.19% ✓
- Cap rate
- 10.32%
- Cash-on-cash
- 14.39%
- DSCR
- 1.64
- GRM
- 7.0
CMA / ARV
- ARV (on-the-fly)
- $137,982
- Comps found
- 12
Show comp detail 12 sales within ~0.75 mi
| Address | Dist | Beds/Ba | Sqft | Sold | Price | $/sf | Match |
|---|---|---|---|---|---|---|---|
| 336 NW 81st St | 0.00mi | 3/2.0 | 1,131 (0%) | 0mo | $101,000 | $89 | 100 |
| 348 NW 86th St | 0.33mi | 3/1.5 | 1,088 (-4%) | 3mo | $88,100 | $81 | 74 |
| 433 NW 87th St | 0.43mi | 3/1.5 | 1,170 (+3%) | 8mo | $100,500 | $86 | 66 |
| 904 NW 88th St | 0.67mi | 3/2.0 | 1,110 (-2%) | 2mo | $200,000 | $180 | 64 |
| 913 NW 87th St | 0.65mi | 3/2.0 | 1,099 (-3%) | 2mo | $219,900 | $200 | 63 |
| 340 NW 90th St | 0.59mi | 3/2.0 | 1,080 (-4%) | 4mo | $197,500 | $183 | 61 |
| 120 NW 81st St | 0.30mi | 4/1.5 (+1) | 1,255 (+11%) | 1mo | $60,000 | $48 | 60 |
| 209 NW 87th St | 0.48mi | 3/1.5 | 1,247 (+10%) | 2mo | $122,000 | $98 | 57 |
| 705 NW 89th St | 0.61mi | 3/1.0 | 1,071 (-5%) | 3mo | $150,000 | $140 | 56 |
| 204 NW 91st St | 0.71mi | 3/1.0 | 1,169 (+3%) | 2mo | $135,750 | $116 | 56 |
| 740 NW 87th St | 0.53mi | 2/2.0 (-1) | 974 (-14%) | 2mo | $160,000 | $164 | 45 |
| 416 NW 92nd St | 0.73mi | 2/1.5 (-1) | 1,226 (+8%) | 6mo | $149,000 | $122 | 40 |
Match score weights: distance 35% · size 25% · config 20% · recency 20%. Top-matched comps best support the ARV.
Projected returns pro-forma
-3.0% appreciation · 3.47% rent growth · sell at horizon
- IRR
- 5.2%
- Equity multiple
- 1.20×
- Total profit
- $6,566
- Equity at exit
- $17,147
- IRR
- 15.0%
- Equity multiple
- 2.24×
- Total profit
- $39,912
- Equity at exit
- $9,943
Cash invested: $32,200 (down + closing). Projections, not guarantees.
Landlord ↔ Tenant lean methodology
- Overall (STATE)
- 83 Strongly Landlord-Friendly
- State Oklahoma
- 83 Strongly Landlord-Friendly · R+20
- County
- — inherits STATE
- City
- — inherits STATE
ZIP-level market 73114
- Home prices YoY
- -12.5%
- Rents YoY
- 3.5%
- Active inventory
- 145
- Price-to-rent
- 7.0×
Monthly cashflow live
- Estimated rent
- $1,369 high interval (Pro) →
- Mortgage (P&I)
- −$603
- Tax from tax record
- −$44 /mo · $530/yr
- Insurance
- −$48
- HOA
- −$0
- Vacancy / Maint / Mgmt
- −$287
- Net cashflow
- $386
Break-even live
UW: 25.0% down · 7.5% · 30yr · 1.5% tax · 5.0% vac · 8.0% maint · 8.0% mgmt
Financing live
Cash to close
- Down payment
- $28,750
- Closing costs
- $3,450
- Reserves months
- —
- Total cash needed
- —
Loan-product check · same deal, 3 products live
Conventional
25% down · 7.5% · 30yr
- Down + closing
- —
- Monthly P&I
- —
- Monthly cashflow
- —
- DSCR
- —
- Eligible?
- —
Personal DTI + credit; lowest rate.
DSCR
20% down · 8.5% · 30yr
- Down + closing
- —
- Monthly P&I
- —
- Monthly cashflow
- —
- DSCR
- —
- Eligible?
- —
No personal income docs; deal must DSCR.
Hard money
10% down · 12.0% · 12mo
- Down + closing
- —
- Monthly P&I
- —
- Monthly cashflow
- —
- DSCR
- —
- Eligible?
- —
Short-term bridge; refi at stabilization.
Rent comps 31 comps
| Address | Beds | Baths | Sqft | Rent | $/sqft | DOM | Units | Dist |
|---|---|---|---|---|---|---|---|---|
| 401 NW 81st St Oklahoma City, OK | 4.0 | 1.5 | 1419 | $1,350 | $0.95 | 43d | 1 | 0.05mi |
| 236 NW 81st St Oklahoma City, OK | 3.0 | 2.0 | 1240 | $1,250 | $1.01 | 23d | 1 | 0.15mi |
| 225 NW 80th St Oklahoma City, OK | 3.0 | 1.5 | 1223 | $1,450 | $1.19 | 1d | 1 | 0.18mi |
| 445 NW 86th St Oklahoma City, OK | 3.0 | 2.0 | 1448 | $1,325 | $0.92 | 1d | 1 | 0.37mi |
| 8801 N Walker Ave Unit B Oklahoma City, OK | 3.0 | 2.0 | 1250 | $1,450 | $1.16 | 43d | 1 | 0.42mi |
| 324 NW 89th St Oklahoma City, OK | 3.0 | 1.5 | 1307 | $1,495 | $1.14 | 23d | 1 | 0.52mi |
| 333 NW 90th St Oklahoma City, OK | 3.0 | 1.5 | 1053 | $1,350 | $1.28 | 43d | 1 | 0.61mi |
| 8500 N Oklahoma Ave Oklahoma City, OK | 3.0 | 1.0–2.0 | 954 | $2,503 | $2.62 | 1d | 23 | 0.63mi |
| 1025 NW 86th St Oklahoma City, OK | 2.0 | 1.5 | 1100 | $1,000 | $0.91 | 43d | 1 | 0.64mi |
| 9111 N Walker Ave Oklahoma City, OK | 3.0 | 1.5 | 1092 | $1,195 | $1.09 | 1d | 1 | 0.65mi |
| 745 NW 89th St Oklahoma City, OK | 3.0 | 1.0 | 1000 | $1,275 | $1.27 | 1d | 1 | 0.67mi |
| 1133 NW 84th St Oklahoma City, OK | 3.0 | 1.0 | 884 | $1,150 | $1.30 | 23d | 1 | 0.76mi |
| 1208 NW 81st St Oklahoma City, OK | 4.0 | 1.0 | 1156 | $1,450 | $1.25 | 1d | 1 | 0.83mi |
| 1214 NW 81st St Oklahoma City, OK | 3.0 | 1.0 | 1100 | $1,350 | $1.23 | 1d | 1 | 0.85mi |
| 413 W Britton Rd Oklahoma City, OK | 2.0 | 1.0 | 912 | $840 | $0.92 | 23d | 1 | 0.87mi |
| 413 W Britton Rd Oklahoma City, OK | 2.0 | 1.0 | 912 | $840 | $0.92 | 20d | 1 | 0.87mi |
| 1216 NW 84th St Oklahoma City, OK | 2.0 | 1.5 | 1140 | $900 | $0.79 | 3d | 1 | 0.87mi |
| 1227 NW 80th St Oklahoma City, OK | 4.0 | 1.5 | 1458 | $1,400 | $0.96 | 15d | 1 | 0.88mi |
| 701 E Wilshire Blvd Oklahoma City, OK | 1.0–3.0 | 1.0 | 850 | $1,029 | $1.21 | 2d | 3 | 1.04mi |
| 1016 NW 67th St Oklahoma City, OK | 2.0 | 1.0–2.0 | 708 | $2,395 | $3.38 | 1d | 6 | 1.07mi |
| 912 NW 98th St Oklahoma City, OK | 3.0 | 1.0 | 1364 | $1,250 | $0.92 | 43d | 1 | 1.25mi |
| 1435 NW 91st St Oklahoma City, OK | 2.0 | 1.5 | 1090 | $1,000 | $0.92 | 43d | 1 | 1.27mi |
| 911 NW 98th St Oklahoma City, OK | 3.0 | 1.0 | 1122 | $1,100 | $0.98 | 1d | 1 | 1.27mi |
| 1110 Sherwood Ln #224 Nichols Hills, OK | 2.0 | 2.5 | 1250 | $2,000 | $1.60 | 43d | 1 | 1.29mi |
| 1434 NW 92nd St Unit 3 Oklahoma City, OK | 2.0 | 1.5 | 950 | $915 | $0.96 | 43d | 1 | 1.30mi |
| 1441 NW 92nd St Oklahoma City, OK | 1.0–2.0 | 1.0 | 725 | $850 | $1.17 | 43d | 1 | 1.32mi |
| 1304 Downing St Oklahoma City, OK | 2.0 | 1.0 | 1345 | $1,395 | $1.04 | 3d | 1 | 1.36mi |
| 1425 NW 94th St Oklahoma City, OK | 2.0 | 1.0 | 816 | $795 | $0.97 | 21d | 1 | 1.39mi |
| 1417 NW 95th St Oklahoma City, OK | 2.0 | 1.0 | 916 | $1,085 | $1.18 | 23d | 1 | 1.42mi |
| 1025 Hoyt Ave Oklahoma City, OK | 4.0 | 1.0 | 884 | $1,150 | $1.30 | 11d | 1 | 1.43mi |
| 910 NW 101st St Oklahoma City, OK | 3.0 | 1.0 | 1100 | $1,400 | $1.27 | 1d | 1 | 1.45mi |
Listing history 2 events
-
2026-04-23status Pending
-
2026-04-07$115,000 Active
ⓘ Source: listings_history table (triggers on properties + properties_extension) + one-shot
backfill from property_details.listing_events for pre-trigger history.
Tax reassessment forecast OK · Resets to sale price
- Current annual tax
- $530 · $44/mo
- Projected year-2 tax
- $1,035 · $86/mo
- Expected delta
- +$505/yr (+$42/mo · 95.4%)
ⓘ Screening estimate from a state-policy table — verify with the county assessor before closing.
Climate risk First Street
- Flood 1/10 Low FEMA zone X (unshaded) · 0% chance over 30 yrs
- Wildfire 2/10 Low
- Heat 6/10 Major 7 d/yr ≥107°F today · 19 d/yr by 30 yrs out
- Wind 2/10 Low 3% chance of damaging wind over 30 yrs
- Air quality 2/10 Low 2 unhealthy d/yr today · 2 by 30 yrs out
Nearby sold comps map
Loading sold comps map…
Walkable amenities ~0.75 mi
Loading nearby amenities…
Taxation est. · year 1
- Rental income
- $16,424
- − Mortgage interest
- −$6,442
- − Property taxes
- −$530
- − Insurance
- −$575
- − Repairs & maintenance
- −$1,314
- − Management
- −$1,314
- − Depreciation
- −$3,345
- Taxable income
- $2,904
- Est. tax owed @ 24.0%
- −$697
- After-tax cash flow
- $3,936/yr
For passive investors: Depreciation is non-cash, so a rental often shows a tax loss while cash-flowing — sheltering income. Rental losses are passive: they offset passive income freely, and up to $25,000/yr can offset ordinary (W-2) income if you actively participate and your MAGI is under $100k (phasing out to $0 by $150k); unused losses carry forward. On sale, claimed depreciation is recaptured at up to 25%, and gains may owe capital-gains tax (a 1031 exchange can defer both). Figures are a year-1 estimate at your 24.0% rate — not tax advice; consult a CPA.
Schools (NCES district)
- District
- Oklahoma City
- NCES district ID
- 4022770
- Math proficiency
- 7% ▼ -5.00%
- Reading proficiency
- 10% ▼ -6.00%
- Median HH income
- $35,606
- Composite
- 7.0/100
- National rank
- #9970
- State rank
- #254 of 270 in OK
Livability — Oklahoma City
- Score
- 80/100
- State rank
- #3
- US rank
- #1635
Category grades
Schools grade is shown separately in the Schools card above.
Census & demographics
- Census place
- Oklahoma City, OK
- County
- Oklahoma County · 771,644 people
- City population
- 498,656
- Metro
- Oklahoma City, OK
- Population (ZIP)
- 17,656
- Household income
- $54,936
- Rent vs Own
- Severe rent burden
- 1035.0
Population outlook (Oklahoma County) Hauer SSP2
- Today (2025)
- 911,875 people
- By 2030
- 982,413 · +7.7%
- By 2040
- 1,130,468 · +24.0%
- By 2050
- 1,288,422 · +41.3%
- By 2075
- 1,711,482 · +87.7%
- By 2100
- 2,088,448 · +129.0%
Race, ethnicity, and origin ACS 2023
- Neighborhood character
- Highly diverse neighborhood (Simpson 0.71)
- Race & ethnicity
- Black 41% White 29% Hispanic / Latino 20% Two or more races 12% Native American 3%
- Hispanic origin (detail)
- Mexican 16% Puerto Rican 1%
- Common ancestry
- Russian 1% Slovak 1% Italian 1%
- Foreign-born
- 12% · Canada, Jamaica
- Languages at home
- 78% English-only · Spanish 18%
Political lean MEDSL · Oklahoma
- 2024 margin
- Toss-up / Even · D 48.0% · R 49.7% · Other 2.3%
- 2008→2024 swing
- +15.1pp toward D · 2008: -16.8pp · 2024: -1.7pp
- All cycles
- 2024: R+1.7 2020: R+1.1 2016: R+10.5 2012: R+16.7 2008: R+16.8
Not yet ingested
- Civics
- —
Market trends
- HPI YoY
- ▼ -44.26%
- Current HPI
- 310.4705
- Rent YoY
- ▲ 3.47%
- Metro
- Oklahoma City, OK
- State GDP YoY
- ▲ 1.55%
- F500 in state
- 6
Industry mix (Fortune 500 HQ in OK)
| Industry | F500 HQs | Revenue |
|---|---|---|
| Energy | 3 | $48B |
|
||
Price history
2 events — show timeline
- 2026-04-23 Pending — MLSOK
- 2026-04-07 Listed $115,000 MLSOK
Property tax history
+2.5%/yrLatest (2025): $530 · +2.9% YoY. Source: county tax records.
Cash-flow waterfall
monthlySold comps — $/sqft
last 12 mo · ≤1 miLoading sold comps…