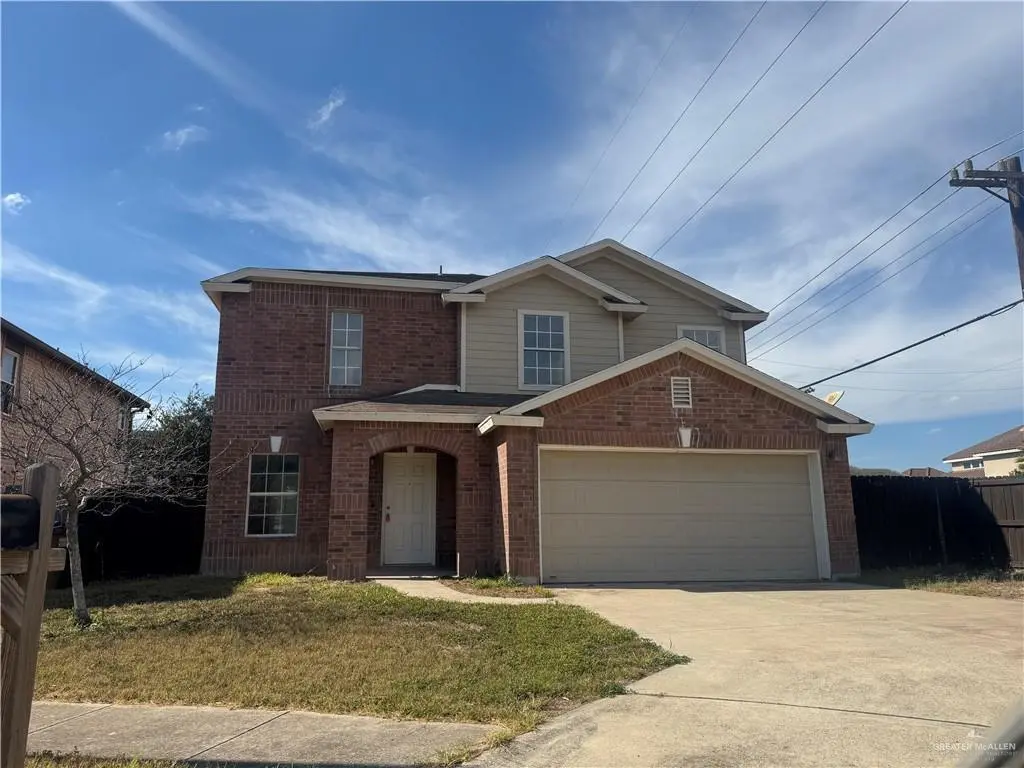
3507 Bridget St · Edinburg, TX
Flood risk 1/10 · Minimal
- FEMA flood zone
- X (shaded)
- Chance of flooding over 30 yrs
- 0.0%
- Est. flood insurance / yr
- $507 – $1,088
Fire risk 2/10 · Minimal
- Est. fire insurance / yr
- $1,222 – $2,270
Heat risk 9/10 · Severe
- Hot days now (above 111°F)
- 7 days/yr
- Hot days in 30 yrs
- 23 days/yr
Wind risk 8/10 · Major
- Chance of severe wind over 30 yrs
- 99.0%
Air-quality risk 2/10 · Minimal
- Unhealthy air days now
- 0 days/yr
- Unhealthy air days in 30 yrs
- 1 days/yr
Risk factors via First Street. Map © Google.
Why this score? — see what drove the D+ grade
The composite is a weighted blend of 9 inputs, each scored 0–100. Each bar is that input's sub-score; the figure is the points it added to the 100-point composite (weight × sub-score).
- Cash flow +13.9/30.0
- ARV discount +12.9/15.0
- 1% rule +4.4/10.0
- DSCR +4.2/10.0
- Livability +3.2/5.0
- Condition / age +2.5/5.0
- Rent growth +2.4/5.0
- Schools +2.2/10.0
- Appreciation +0.0/10.0
$229,000
🖨 Deal sheet (PDF) 📄 Offer letter ✓ Due diligence
Listing remarks MLS
This charming 2,167 sq. ft. property delivers a functional and family-friendly layout with 3 spacious bedrooms and 2.5 baths, making everyday living feel effortless. The open-concept floor plan brings in plenty of natural light, complemented by brand-new tile flooring for a clean, modern aesthetic. Located in a highly connected neighborhood, you’ll be just minutes away from schools, retail, and popular dining options, perfect for anyone who values both convenience and comfort. Book your private tour before it’s gone!
Key facts
- 5,797 sq ft lot
- 2 garage spots
- Built 2005
Neighborhood map
What this means for you Summary
Snapshot
- This is a 4-bed/2.0-bath single-family listed at $229k.
Deal economics
- At list price, monthly cash flow is $25 ($305/yr) — positive.
- The deal already cash-flows at list — no discount required.
- To meet the 1% rule (rent ≥ 1% of price), the offer needs to be $216k (5.6% below list).
- Recommended offer: $202k (12.0% below list) — sets the bar for market timing.
- Cap rate 6.4% vs local median 2.4% in Edinburg — top-decile yield for the area; either an underpriced asset or a hidden risk that comps aren't pricing in. Stress-test before assuming the spread holds.
Location & tenants
- Location reads 64/100 on livability (#784 in TX) — a middle-class / working-renter tenant base. Strengths: cost of living A+, housing A+; Watch: employment D, amenities F, commute F.
- Edinburg CISD (urban): math 20% / reading 34% proficiency, ranked #699 of 826 in TX (top 85%) — low school quality limits family demand, transient renter base, plan for 1-2y turnover; 62% free/reduced lunch — lower-income household profile, screen leases tightly.
- Zoned schools: Canterbury El (math 54% / reading 61%, grade C+, #492 of 4,322 statewide, top 12%, 676 students, 42% FRL); South Middle (math 23% / reading 46%, grade F, #858 of 1,662 statewide, top 54%, 1,309 students, 66% FRL); Robert R Vela H S (math 27% / reading 48%, grade F, #888 of 1,632 statewide, top 55%, 2,189 students, 62% FRL).
- Zoned-school proficiency averages 43% at this address vs 27% district-wide (+16 pts) — the actual schools serving this property are materially stronger than the Edinburg CISD average implies; a family-tenant draw the district grade alone would hide.
- Market conditions: Rents soft (-0.5%/yr); 411 active listings in the ZIP; 14 comparable units currently listed for rent nearby; rentals lingering (median 46d on market — plan ~5-8 weeks vacancy on turnover, expect pricing pressure); 50% of comp listings sitting > 30 days — soft ceiling on asking rent; 7,378 units permitted in Hidalgo County in 2024 (641 in 5+ unit buildings).
- This rent runs 39% of the median local income ($67k/yr) — at the standard rent-burdened threshold; future hikes will face affordability resistance.
Forward outlook
- Local home prices are declining (-3.0%/yr); year-one equity from $2k of loan paydown is wiped out by about $7k of value loss. Plan a longer hold.
- Hidalgo County population projected at +28% by 2050 — long-run rental-demand tailwind backs the buy-and-hold thesis.
Negotiation context
- It's been on market 131 days — a 12% lower offer ($202k) is reasonable based on typical stale-listing flexibility.
- 5 sale attempts since 11y ago; this cycle's ask has dropped $30k (12%) from the opening price — seller is motivated, your offer sets the floor, not the list.
Risks & watch-outs
- Climate carrying-cost: severe wind risk, 99% chance of damaging wind over 30y; extreme-heat days projected 7→23/yr by 2055 (HVAC capex compounding) — expect insurance premiums to compound above CPI over the hold.
Questions for the listing agent
- It's been on market 131 days. Have you received any prior offers? Is the seller open to a 12% concession, seller financing, or rate buy-down credit?
- Why hasn't it sold? Are there any deal-killer items the seller is aware of (foundation, flood, title, zoning, code violations)?
- Is there a deadline driving the sale (1031 exchange, divorce, estate, relocation)? That informs how much negotiation room exists.
- Schools are D-rated, which usually means shorter tenancies and higher turnover. Who's the typical renter profile here, and what's been the actual vacancy rate?
- The area grade is low — what's the realistic commute time and amenity access for the typical tenant pool here? Any planned neighborhood developments (good or bad) we should know about?
- What's the average days-on-market for RENTAL listings here right now (not sales)? A rising rental-DOM trend means longer vacancies and softer asking-rent achievability than the comps imply.
- What's the recent tenant-quality profile in this submarket — average credit score on applications, eviction rate, late-payment / NSF rate, and stable-employment percentage? A property-management company in the area should have these aggregated.
- How much new for-sale + rental construction is in the pipeline within 1–3 miles? Heavy new supply typically softens prices + rents 12–24 months out; constrained supply supports both.
Investment metrics
- 1% rule
- 0.94% ✗
- Cap rate
- 6.43%
- Cash-on-cash
- 0.48%
- DSCR
- 1.02
- GRM
- 8.8
CMA / ARV
- ARV (median comp)
- $260,069
- List price
- $229,000
- Delta
- -11.95%
- Verdict
- UNDERPRICED
- Comps
- 20 within 1.0 mi
Show comp detail 12 sales within ~0.75 mi
| Address | Dist | Beds/Ba | Sqft | Sold | Price | $/sf | Match |
|---|---|---|---|---|---|---|---|
| 3408 Madison Ave | 0.09mi | 4/3.0 | 2,423 (+12%) | 4mo | $435,000 | $180 | 69 |
| 1220 Eva St | 0.61mi | 4/2.0 | 2,139 (-1%) | 1mo | $280,500 | $131 | 68 |
| 3619 Tigris Dr | 0.32mi | 3/3.5 (-1) | 2,234 (+3%) | 3mo | $369,000 | $165 | 66 |
| 3526 Bridget St | 0.04mi | 3/2.5 (-1) | 2,420 (+12%) | 7mo | $258,000 | $107 | 66 |
| 1604 St Claire Ave | 0.37mi | 3/2.5 (-1) | 2,019 (-7%) | 2mo | $349,000 | $173 | 63 |
| 3507 Danubio Dr | 0.35mi | 4/3.0 | 2,432 (+12%) | 1mo | $415,000 | $171 | 58 |
| 1707 Red River Ave | 0.32mi | 4/3.5 | 2,464 (+14%) | 5mo | $399,900 | $162 | 52 |
| 2314 Holland Ave | 0.73mi | 4/3.5 | 2,238 (+3%) | 4mo | $389,000 | $174 | 52 |
| 2501 W Rhin Dr | 0.40mi | 4/3.5 | 2,409 (+11%) | 7mo | $375,000 | $156 | 51 |
| 2311 Penrose Ave | 0.70mi | 3/2.5 (-1) | 2,279 (+5%) | 6mo | $400,000 | $176 | 47 |
| 2316 Penrose Ave | 0.67mi | 4/3.0 | 2,459 (+14%) | 7mo | $449,900 | $183 | 36 |
| 2310 Holland Ave | 0.72mi | 4/3.0 | 2,461 (+14%) | 6mo | $410,000 | $167 | 35 |
Match score weights: distance 35% · size 25% · config 20% · recency 20%. Top-matched comps best support the ARV.
Projected returns pro-forma
-3.0% appreciation · 0.0% rent growth · sell at horizon
- IRR
- -19.1%
- Equity multiple
- 0.35×
- Total profit
- $-41,732
- Equity at exit
- $34,145
- IRR
- -20.2%
- Equity multiple
- 0.09×
- Total profit
- $-58,361
- Equity at exit
- $19,800
Cash invested: $64,120 (down + closing). Projections, not guarantees.
Landlord ↔ Tenant lean methodology
- Overall (STATE)
- 87 Strongly Landlord-Friendly
- State Texas
- 87 Strongly Landlord-Friendly · R+5
- County
- — inherits STATE
- City
- — inherits STATE
ZIP-level market 78539
- Home prices YoY
- -19.6%
- Rents YoY
- -0.5%
- Active inventory
- 411
- Price-to-rent
- 8.8×
Monthly cashflow live
- Estimated rent
- $2,162 high interval (Pro) →
- Mortgage (P&I)
- −$1,201
- Tax from tax record
- −$386 /mo · $4,636/yr
- Insurance
- −$95
- HOA
- −$0
- Vacancy / Maint / Mgmt
- −$454
- Net cashflow
- $25
Break-even live
Sensitivity live
| Price | -10% $155 | -5% $90 | +0% $25 | +5% $-39 | +10% $-104 |
|---|---|---|---|---|---|
| Rent | -10% $-145 | -5% $-60 | +0% $25 | +5% $111 | +10% $196 |
| Rate | -1.0pp $141 | -0.5pp $84 | base $25 | +0.5pp $-34 | +1.0pp $-94 |
UW: 25.0% down · 7.5% · 30yr · 1.5% tax · 5.0% vac · 8.0% maint · 8.0% mgmt
Financing live
Cash to close
- Down payment
- $57,250
- Closing costs
- $6,870
- Reserves months
- —
- Total cash needed
- —
Loan-product check · same deal, 3 products live
Conventional
25% down · 7.5% · 30yr
- Down + closing
- —
- Monthly P&I
- —
- Monthly cashflow
- —
- DSCR
- —
- Eligible?
- —
Personal DTI + credit; lowest rate.
DSCR
20% down · 8.5% · 30yr
- Down + closing
- —
- Monthly P&I
- —
- Monthly cashflow
- —
- DSCR
- —
- Eligible?
- —
No personal income docs; deal must DSCR.
Hard money
10% down · 12.0% · 12mo
- Down + closing
- —
- Monthly P&I
- —
- Monthly cashflow
- —
- DSCR
- —
- Eligible?
- —
Short-term bridge; refi at stabilization.
Rent comps 14 comps
| Address | Beds | Baths | Sqft | Rent | $/sqft | DOM | Units | Dist |
|---|---|---|---|---|---|---|---|---|
| 1612 Red River Ave Edinburg, TX | 4.0 | 4.0 | 2494 | $3,275 | $1.31 | 45d | 1 | 0.35mi |
| 2401 W Rhin Dr Edinburg, TX | 4.0 | 2.5 | 2301 | $2,400 | $1.04 | 16d | 1 | 0.36mi |
| 5018 S Hummer Ln Edinburg, TX | 3.0 | 2.0 | 1926 | $1,800 | $0.93 | 25d | 1 | 0.91mi |
| 3719 Alvarado St Edinburg, TX | 3.0 | 2.5 | 1543 | $2,095 | $1.36 | 45d | 1 | 0.95mi |
| 3118 Vera Ave Edinburg, TX | 3.0 | 2.0 | 1553 | $1,800 | $1.16 | 45d | 1 | 0.96mi |
| 323 Cavazos St Edinburg, TX | 3.0 | 2.5 | 2223 | $1,700 | $0.76 | 45d | 1 | 1.01mi |
| 104 Auburn Ave McAllen, TX | 4.0 | 3.0 | 2767 | $2,695 | $0.97 | 45d | 1 | 1.11mi |
| 104 Auburn Ave McAllen, TX | 4.0 | 3.0 | 2767 | $3,000 | $1.08 | 16d | 1 | 1.11mi |
| 2714 Blue Ridge Dr Edinburg, TX | 3.0 | 2.0 | 1966 | $1,750 | $0.89 | 16d | 1 | 1.18mi |
| 4809 S Markland Ave Edinburg, TX | 3.0 | 2.0 | 1663 | $2,550 | $1.53 | 25d | 1 | 1.19mi |
| 2501 Camino Real Viejo Mercedes, TX | 4.0 | 2.0 | 2048 | $1,400 | $0.68 | 45d | 1 | 1.21mi |
| 5211 Shalom Dr Edinburg, TX | 3.0 | 2.0 | 2305 | $2,200 | $0.95 | 45d | 1 | 1.30mi |
| 1931 W Owassa Rd Edinburg, TX | 3.0 | 3.0 | 2032 | $1,700 | $0.84 | 25d | 1 | 1.43mi |
| 125 E Kiwi St McAllen, TX | 4.0 | 3.0 | 2529 | $1,800 | $0.71 | 16d | 1 | 1.50mi |
Listing history 23 events
-
2026-06-08status $229,000 Pending 131 DOM
-
2026-06-07days on market $229,000 Option 131 DOM
-
2026-06-03days on market $229,000 Option 127 DOM
-
2026-06-02statusdays on market $229,000 Option 126 DOM
-
2026-06-01days on market $229,000 Active 125 DOM
-
2026-05-31days on market $229,000 Active 124 DOM
-
2026-05-31days on market $229,000 Active 123 DOM
-
2026-04-04price $229,000 541-char remark
Show marketing remark (541 chars)
This charming 2,167 sq. ft. property delivers a functional and family-friendly layout with 3 spacious bedrooms and 2.5 baths, making everyday living feel effortless. The open-concept floor plan brings in plenty of natural light, complemented by brand-new tile flooring for a clean, modern aesthetic. Located in a highly connected neighborhood, you’ll be just minutes away from schools, retail, and popular dining options, perfect for anyone who values both convenience and comfort. Book your private tour before it’s gone!
-
2026-03-19price $239,000 541-char remark
Show marketing remark (541 chars)
This charming 2,167 sq. ft. property delivers a functional and family-friendly layout with 3 spacious bedrooms and 2.5 baths, making everyday living feel effortless. The open-concept floor plan brings in plenty of natural light, complemented by brand-new tile flooring for a clean, modern aesthetic. Located in a highly connected neighborhood, you’ll be just minutes away from schools, retail, and popular dining options, perfect for anyone who values both convenience and comfort. Book your private tour before it’s gone!
-
2026-03-01price $244,900 541-char remark
Show marketing remark (541 chars)
This charming 2,167 sq. ft. property delivers a functional and family-friendly layout with 3 spacious bedrooms and 2.5 baths, making everyday living feel effortless. The open-concept floor plan brings in plenty of natural light, complemented by brand-new tile flooring for a clean, modern aesthetic. Located in a highly connected neighborhood, you’ll be just minutes away from schools, retail, and popular dining options, perfect for anyone who values both convenience and comfort. Book your private tour before it’s gone!
-
2026-01-26$259,000 Active 541-char remark
Show marketing remark (541 chars)
This charming 2,167 sq. ft. property delivers a functional and family-friendly layout with 3 spacious bedrooms and 2.5 baths, making everyday living feel effortless. The open-concept floor plan brings in plenty of natural light, complemented by brand-new tile flooring for a clean, modern aesthetic. Located in a highly connected neighborhood, you’ll be just minutes away from schools, retail, and popular dining options, perfect for anyone who values both convenience and comfort. Book your private tour before it’s gone!
-
2023-01-06price $259,000
-
2022-12-02price $269,000
-
2022-11-09$274,000 Active
-
2022-10-04price $274,000
-
2022-08-12$279,000 Active
-
2022-07-22$284,999 Active
-
2018-06-05price $124,500
-
2015-09-04soldstatus
-
2015-08-28soldstatus Sold
-
2015-07-17historical
-
2015-07-17price $129,900
-
2015-07-15$129,900 Active
ⓘ Source: listings_history table (triggers on properties + properties_extension) + one-shot
backfill from property_details.listing_events for pre-trigger history.
Tax reassessment forecast TX · Resets to sale price
- Current annual tax
- $4,636 · $386/mo
- Projected year-2 tax
- $4,636 · $386/mo
- Expected delta
- $0/yr ($0/mo · 0.0%)
ⓘ Screening estimate from a state-policy table — verify with the county assessor before closing.
Climate risk First Street
- Flood 1/10 Low FEMA zone X (shaded) · 0% chance over 30 yrs
- Wildfire 2/10 Low
- Heat 9/10 Extreme 7 d/yr ≥111°F today · 23 d/yr by 30 yrs out
- Wind 8/10 Severe 99% chance of damaging wind over 30 yrs
- Air quality 2/10 Low 0 unhealthy d/yr today · 1 by 30 yrs out
Nearby sold comps map
Loading sold comps map…
Walkable amenities ~0.75 mi
Loading nearby amenities…
Taxation est. · year 1
- Rental income
- $25,945
- − Mortgage interest
- −$12,828
- − Property taxes
- −$4,636
- − Insurance
- −$1,145
- − Repairs & maintenance
- −$2,076
- − Management
- −$2,076
- − Depreciation
- −$6,662
- Taxable loss
- −$3,476
- Est. tax savings @ 24.0%
- +$834
- After-tax cash flow
- $1,139/yr
For passive investors: Depreciation is non-cash, so a rental often shows a tax loss while cash-flowing — sheltering income. Rental losses are passive: they offset passive income freely, and up to $25,000/yr can offset ordinary (W-2) income if you actively participate and your MAGI is under $100k (phasing out to $0 by $150k); unused losses carry forward. On sale, claimed depreciation is recaptured at up to 25%, and gains may owe capital-gains tax (a 1031 exchange can defer both). Figures are a year-1 estimate at your 24.0% rate — not tax advice; consult a CPA.
Schools (NCES district)
- District
- Edinburg CISD
- NCES district ID
- 4818180
- Math proficiency
- 20% ▼ -34.00%
- Reading proficiency
- 34% ▼ -11.00%
- Median HH income
- $36,985
- Composite
- 22.42/100
- National rank
- #8114
- State rank
- #699 of 826 in TX
Livability — Edinburg
- Score
- 64/100
- State rank
- #784
- US rank
- #14319
Category grades
Schools grade is shown separately in the Schools card above.
Census & demographics
- Census place
- Edinburg, TX
- County
- Hidalgo County · 623,128 people
- City population
- 178,279
- Metro
- McAllen-Edinburg-Mission, TX
- Population (ZIP)
- 37,168
- Household income
- $66,967
- Rent vs Own
- Severe rent burden
- 1525.0
Population outlook (Hidalgo County) Hauer SSP2
- Today (2025)
- 955,232 people
- By 2030
- 1,009,774 · +5.7%
- By 2040
- 1,120,332 · +17.3%
- By 2050
- 1,225,036 · +28.2%
- By 2075
- 1,439,189 · +50.7%
- By 2100
- 1,533,429 · +60.5%
Race, ethnicity, and origin ACS 2023
- Neighborhood character
- Predominantly Hispanic (85%)
- Race & ethnicity
- Hispanic / Latino 85% Two or more races 45% White 10% Asian 4%
- Hispanic origin (detail)
- Mexican 77% Puerto Rican 1%
- Common ancestry
- Lithuanian 1% Italian 1% Romanian 1%
- Foreign-born
- 19% · Canada
- Languages at home
- 32% English-only · Spanish 64% Tagalog/Filipino 2% Other Asian/Pacific 1%
Political lean MEDSL · Hidalgo
- 2024 margin
- Toss-up / Even · D 48.1% · R 51.0%
- 2008→2024 swing
- -41.6pp toward R · 2008: 38.7pp · 2024: -2.9pp
- All cycles
- 2024: R+2.9 2020: D+17.1 2016: D+40.5 2012: D+41.8 2008: D+38.7
Not yet ingested
- Civics
- —
Market trends
- HPI YoY
- ▼ -51.52%
- Current HPI
- 211.4723
- Rent YoY
- ▼ -0.52%
- Metro
- McAllen-Edinburg-Mission, TX
- State GDP YoY
- ▲ 3.95%
- F500 in state
- 110
Industry mix (Fortune 500 HQ in TX)
| Industry | F500 HQs | Revenue |
|---|---|---|
| Energy | 16 | $1,198B |
|
||
| Technology | 5 | $198B |
|
||
| Engineering / Construction | 4 | $72B |
|
||
| Energy Services | 3 | $60B |
|
||
| Utilities | 3 | $41B |
|
||
| Healthcare | 2 | $330B |
|
||
Price history
+76.3% since first listed16 events — show timeline
- 2026-04-04 Price Changed $229,000 MCALLENMLS
- 2026-03-19 Price Changed $239,000 MCALLENMLS
- 2026-03-01 Price Changed $244,900 MCALLENMLS
- 2026-01-26 Listed $259,000 MCALLENMLS
- 2023-01-06 Price Changed $259,000 MCALLENMLS
- 2022-12-02 Price Changed $269,000 MCALLENMLS
- 2022-11-09 Listed $274,000 MCALLENMLS
- 2022-10-04 Price Changed $274,000 MCALLENMLS
- 2022-08-12 Listed $279,000 MCALLENMLS
- 2022-07-22 Listed $284,999 MCALLENMLS
- 2018-06-05 Price Changed $124,500 MCALLENMLS
- 2015-09-04 Sold (Public Records) — Public Records
- 2015-08-28 Sold (MLS) — MCALLENMLS
- 2015-07-17 Delisted — MCALLENMLS
- 2015-07-17 Price Changed $129,900 MCALLENMLS
- 2015-07-15 Listed $129,900 MCALLENMLS
Property tax history
+4.0%/yrLatest (2025): $4,636 · +5.5% YoY. Source: county tax records.
Cash-flow waterfall
monthlySold comps — $/sqft
last 12 mo · ≤1 miLoading sold comps…