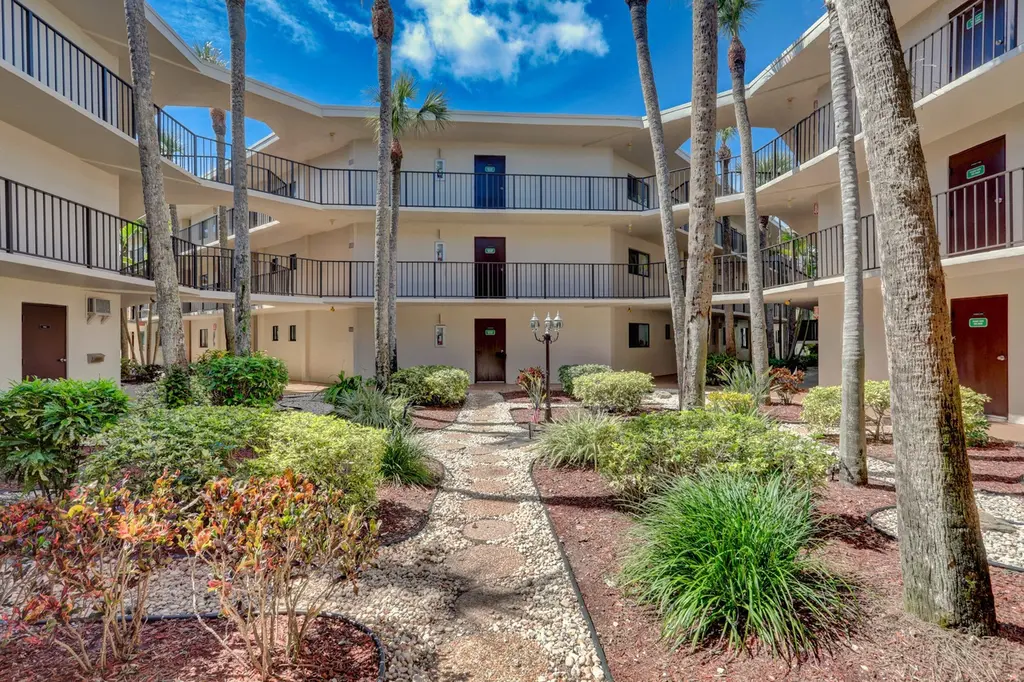
5370 Las Verdes Cir #324 · Delray Beach, FL
Flood risk 1/10 · Minimal
- FEMA flood zone
- X (unshaded)
- Chance of flooding over 30 yrs
- 0.0%
- Est. flood insurance / yr
- $507 – $1,088
Fire risk 1/10 · Minimal
- Est. fire insurance / yr
- $947 – $1,759
Heat risk 10/10 · Severe
- Hot days now (above 106°F)
- 7 days/yr
- Hot days in 30 yrs
- 27 days/yr
Wind risk 10/10 · Severe
- Chance of severe wind over 30 yrs
- 99.0%
Air-quality risk 3/10 · Minor
- Unhealthy air days now
- 2 days/yr
- Unhealthy air days in 30 yrs
- 3 days/yr
Risk factors via First Street. Map © Google.
Why this score? — see what drove the C grade
The composite is a weighted blend of 9 inputs, each scored 0–100. Each bar is that input's sub-score; the figure is the points it added to the 100-point composite (weight × sub-score).
- Cash flow +20.6/30.0
- 1% rule +8.8/10.0
- ARV discount +7.5/15.0
- DSCR +6.6/10.0
- Schools +4.3/10.0
- Livability +3.9/5.0
- Rent growth +3.6/5.0
- Condition / age +2.5/5.0
- Appreciation +0.0/10.0
$149,900
🖨 Deal sheet 📄 Offer letter ✓ Due diligence
Listing remarks
Welcome to Las Verdes, a vibrant and beautifully maintained 55+ gated community in the heart of Delray Beach. This spacious corner unit offers two bedrooms and a bright, open layout, complete with tile flooring throughout and a screened-in patio—perfect for enjoying Florida's breezy evenings. The unit includes a full-size washer and dryer for your convenience. Located just minutes from the beach, the lively restaurants and shops of Atlantic Avenue, and easy access to I-95, you'll love the lifestyle this home offers. Las Verdes features resort-style amenities including tennis courts, a clubhouse, a sparkling community pool, and a calendar full of social activities. Please note: Rentals
Key facts
- Gated community
- Clubhouse
- Tennis courts
Tags
Property features AI
Finance
- Other: Association phone available
- HOA & community: Cypress HOA with monthly fee; HOA includes cable TV, maintenance of grounds, sewer, trash, water, common areas, elevator, recreation facility; Community amenities include tennis court(s)
Exterior
- Parking: Assigned open parking (1 space)
- Security: Gated with guard
- Utilities: Public water; Public sewer; Cable available; Sewer available; Water available
- Home design: Condominium; Three or more levels; Resale; Faces east; Gated community with guard; Senior community
- Construction: CBS construction; Other roof
- Exterior features: Screened patio; Patio; Not waterfront
Interior
- Kitchen: Electric range; Dishwasher; Refrigerator
- Bedrooms: 2 bedrooms on the main level
- Flooring: Tile
- Bathrooms: 2 full bathrooms on the main level
- Heating & cooling: Central heating; Central air conditioning
- Interior features: Furnished; Disposal
- Laundry & utility: Inside laundry in a laundry closet; Electric water heater
Neighborhood map
What this means for you Summary
Snapshot
- This is a 2-bed/2.0-bath condo listed at $150k.
Deal economics
- At list price, monthly cash flow is $201 ($2k/yr) — positive.
- The deal already cash-flows at list — no discount required.
- Meets the 1% rule at list price ($2k rent vs $150k).
- Recommended offer: $145k (3.0% below list) — sets the bar for market timing.
- Cap rate 7.9% vs local median 4.3% in Delray Beach — top-decile yield for the area; either an underpriced asset or a hidden risk that comps aren't pricing in. Stress-test before assuming the spread holds.
Location & tenants
- Location reads 77/100 on livability (#202 in FL, #3,160 nationally) — a middle-class / working-renter tenant base. Strengths: housing A+, health & safety A+, commute A-; Watch: cost of living C-, crime D-, amenities F.
- Palm Beach (suburban): math 46% / reading 53% proficiency, ranked #34 of 73 in FL (top 47%) — families likely to look elsewhere, expect single-tenant / working-renter base with shorter leases.
- Zoned schools: Orchard View Elementary School (math 48% / reading 47%, grade D, #1,182 of 2,144 statewide, top 55%, 596 students, 76% FRL); Spanish River Community High School (math 64% / reading 74%, grade B, #63 of 667 statewide, top 10%, 2,578 students, 25% FRL) — zoned schools at 50% FRL track the district average.
- Market conditions: Rents rising fast (+4.3%/yr); 546 active listings in the ZIP; 40 comparable units currently listed for rent nearby; rentals at typical pace (median 25d on market — plan ~3-4 weeks tenant-placement turnaround); 3,974 units permitted in Palm Beach County in 2024 (1,012 in 5+ unit buildings).
- This rent runs 40% of the median local income ($62k/yr) — at the standard rent-burdened threshold; future hikes will face affordability resistance.
Forward outlook
- Local home prices are declining (-3.0%/yr); year-one equity from $1k of loan paydown is wiped out by about $4k of value loss. Plan a longer hold.
- Palm Beach County population projected at +30% by 2050 — long-run rental-demand tailwind backs the buy-and-hold thesis.
Negotiation context
- It's been on market 59 days — a 3% lower offer ($145k) is reasonable based on typical stale-listing flexibility.
- 6 sale attempts since 26y ago with the ask held roughly flat each time — persistent listings suggest the price (not the market) is what's stuck; bring a comps-based counter.
- Current owner paid $57k; list at $150k implies a 163% gain — meaningful room to come down on a strong offer.
Risks & watch-outs
- Climate carrying-cost: severe wind risk, 99% chance of damaging wind over 30y; extreme-heat days projected 7→27/yr by 2055 (HVAC capex compounding) — expect insurance premiums to compound above CPI over the hold.
Questions for the listing agent
- It's been on market 59 days. Have you received any prior offers? Is the seller open to a 3% concession, seller financing, or rate buy-down credit?
- What does the HOA fee cover, when was the last increase, and are there any pending special assessments or reserve-fund shortfalls?
- Any open or pending special assessments — roof, HVAC, plumbing, elevator, façade? What's the per-unit balance and payoff schedule, and is the seller paying it off at close or rolling it to the buyer?
- Is there a deadline driving the sale (1031 exchange, divorce, estate, relocation)? That informs how much negotiation room exists.
- Schools are B-rated — typically a magnet for longer-tenancy family renters. What's the average tenant stay here, and is there a school-zone premium baked into asking?
- Crime grade is D in this area — have there been break-ins, vandalism, or insurance claims at this property in the last 3 years? What carrier currently insures it and at what premium?
- What's the average days-on-market for RENTAL listings here right now (not sales)? A rising rental-DOM trend means longer vacancies and softer asking-rent achievability than the comps imply.
- What's the recent tenant-quality profile in this submarket — average credit score on applications, eviction rate, late-payment / NSF rate, and stable-employment percentage? A property-management company in the area should have these aggregated.
- How much new apartment / multifamily construction is in the pipeline within 1–3 miles? Heavy new supply (>2% of stock underway) typically softens rents 12–24 months out; light construction supports rent growth.
Investment metrics
- 1% rule
- 1.38% ✓
- Cap rate
- 7.90%
- Cash-on-cash
- 5.74%
- DSCR
- 1.26
- GRM
- 6.1
CMA / ARV
No comps found within radius.
Projected returns pro-forma
-3.0% appreciation · 4.28% rent growth · sell at horizon
- IRR
- -5.4%
- Equity multiple
- 0.80×
- Total profit
- $-8,533
- Equity at exit
- $22,351
- IRR
- 6.3%
- Equity multiple
- 1.51×
- Total profit
- $21,480
- Equity at exit
- $12,961
Cash invested: $41,972 (down + closing). Projections, not guarantees.
Landlord ↔ Tenant lean methodology
- Overall (STATE)
- 87 Strongly Landlord-Friendly
- State Florida
- 87 Strongly Landlord-Friendly · R+3
- County
- — inherits STATE
- City
- — inherits STATE
ZIP-level market 33484
- Rents YoY
- 4.3%
- Active inventory
- 546
- Price-to-rent
- 6.1×
Monthly cashflow live
- Estimated rent
- $2,062 high interval (Pro) →
- Mortgage (P&I)
- −$786
- Tax from tax record
- −$226 /mo · $2,708/yr
- Insurance
- −$62
- HOA
- −$354
- Vacancy / Maint / Mgmt
- −$433
- Net cashflow
- $201
Break-even live
UW: 25.0% down · 7.5% · 30yr · 1.5% tax · 5.0% vac · 8.0% maint · 8.0% mgmt
Financing live
Cash to close
- Down payment
- $37,475
- Closing costs
- $4,497
- Reserves months
- —
- Total cash needed
- —
Loan-product check · same deal, 3 products live
Conventional
25% down · 7.5% · 30yr
- Down + closing
- —
- Monthly P&I
- —
- Monthly cashflow
- —
- DSCR
- —
- Eligible?
- —
Personal DTI + credit; lowest rate.
DSCR
20% down · 8.5% · 30yr
- Down + closing
- —
- Monthly P&I
- —
- Monthly cashflow
- —
- DSCR
- —
- Eligible?
- —
No personal income docs; deal must DSCR.
Hard money
10% down · 12.0% · 12mo
- Down + closing
- —
- Monthly P&I
- —
- Monthly cashflow
- —
- DSCR
- —
- Eligible?
- —
Short-term bridge; refi at stabilization.
Rent comps 40 comps
| Address | Beds | Baths | Sqft | Rent | $/sqft | DOM | Units | Dist |
|---|---|---|---|---|---|---|---|---|
| 5310 Las Verdes Cir #106 Delray Beach, FL | 2.0 | 2.0 | 1050 | $1,900 | $1.81 | 24d | 1 | 0.09mi |
| 5130 Las Verdes Cir #101 Delray Beach, FL | 2.0 | 2.0 | 1030 | $1,825 | $1.77 | 24d | 1 | 0.14mi |
| 5220 Las Verdes Cir Delray Beach, FL | 2.0 | 2.0 | 963 | $1,825 | $1.90 | 22d | 2 | 0.18mi |
| 5220 Las Verdes Cir #101 Delray Beach, FL | 2.0 | 2.0 | 876 | $1,950 | $2.23 | 5d | 1 | 0.19mi |
| 5190 Las Verdes Cir #315 Delray Beach, FL | 2.0 | 2.0 | 930 | $2,000 | $2.15 | 8d | 1 | 0.20mi |
| 5299 Copperleaf Cir Delray Beach, FL | 2.0 | 2.0 | 1070 | $2,000 | $1.87 | 24d | 1 | 0.25mi |
| 481 Burgundy K Delray Beach, FL | 2.0 | 2.0 | 902 | $1,700 | $1.88 | 24d | 1 | 0.41mi |
| 416 Burgundy N Unit I Delray Beach, FL | 1.0 | 1.5 | 760 | $2,100 | $2.76 | 24d | 1 | 0.45mi |
| 39 Burgundy a Delray Beach, FL | 2.0 | 2.0 | 902 | $1,400 | $1.55 | 24d | 1 | 0.45mi |
| 519 Burgundy K Delray Beach, FL | 1.0 | 1.5 | 760 | $2,400 | $3.16 | 24d | 1 | 0.46mi |
| 767 Burgundy P Delray Beach, FL | 2.0 | 2.0 | 902 | $1,550 | $1.72 | 24d | 1 | 0.46mi |
| 313 Burgundy G Delray Beach, FL | 2.0 | 2.0 | 907 | $2,050 | $2.26 | 24d | 1 | 0.46mi |
| 548 Burgundy L Delray Beach, FL | 2.0 | 2.0 | 902 | $1,900 | $2.11 | 8d | 1 | 0.46mi |
| 599 Burgundy M Delray Beach, FL | 3.0 | 2.0 | 1097 | $2,100 | $1.91 | 3d | 1 | 0.46mi |
| 812 Burgundy Q Delray Beach, FL | 2.0 | 2.0 | 907 | $1,799 | $1.98 | 24d | 1 | 0.46mi |
| 998 Normandy Trl Unit 998 Delray Beach, FL | 2.0 | 2.0 | 907 | $1,800 | $1.98 | 24d | 1 | 0.49mi |
| 998 Normandy Trl Unit 998 Delray Beach, FL | 2.0 | 2.0 | 907 | $1,800 | $1.98 | 15d | 1 | 0.49mi |
| 29 Burgundy a Delray Beach, FL | 2.0 | 2.0 | 902 | $1,800 | $2.00 | 24d | 1 | 0.49mi |
| 509 Capri Dr Unit 509 Delray Beach, FL | 2.0 | 2.0 | 910 | $2,500 | $2.75 | 2d | 1 | 0.52mi |
| 507 Capri Dr Delray Beach, FL | 2.0 | 2.0 | 910 | $2,200 | $2.42 | 24d | 1 | 0.52mi |
| 16363 Water Way Delray Beach, FL | 2.0 | 2.0 | 943 | $2,500 | $2.65 | 24d | 1 | 0.54mi |
| 949 Normandy Trl Unit 949 Delray Beach, FL | 2.0 | 2.0 | 907 | $3,500 | $3.86 | 24d | 1 | 0.57mi |
| 16387 Water Way #16387 Delray Beach, FL | 2.0 | 2.0 | 943 | $2,475 | $2.62 | 24d | 1 | 0.59mi |
| 522 Capri K Unit K Delray Beach, FL | 1.0 | 1.5 | 730 | $1,350 | $1.85 | 24d | 1 | 0.59mi |
| 930 Normandy T Delray Beach, FL | 1.0 | 1.5 | 760 | $2,800 | $3.68 | 8d | 1 | 0.59mi |
| 542 Normandy Ln Unit 542 Delray Beach, FL | 2.0 | 2.0 | 907 | $1,600 | $1.76 | 24d | 1 | 0.60mi |
| 468 Capri J Delray Beach, FL | 2.0 | 2.0 | 910 | $1,400 | $1.54 | 24d | 1 | 0.61mi |
| 66 Capri B #66 Delray Beach, FL | 2.0 | 2.0 | 910 | $2,000 | $2.20 | 19d | 1 | 0.62mi |
| 16344 Country Lake Cir Delray Beach, FL | 2.0 | 2.0 | 943 | $2,250 | $2.39 | 5d | 1 | 0.63mi |
| 16344 Country Lake Cir Delray Beach, FL | 2.0 | 2.0 | 943 | $2,150 | $2.28 | 5d | 1 | 0.63mi |
| 115 Capri B Unit 115 Delray Beach, FL | 2.0 | 2.0 | 1044 | $2,000 | $1.92 | 24d | 1 | 0.64mi |
| 560 Capri Ln Delray Beach, FL | 1.0 | 1.5 | 760 | $1,500 | $1.97 | 24d | 1 | 0.64mi |
| 207 Capri E #207 Delray Beach, FL | 2.0 | 2.0 | 910 | $1,700 | $1.87 | 8d | 1 | 0.64mi |
| 66 Capri B Unit B Delray Beach, FL | 2.0 | 2.0 | 910 | $2,000 | $2.20 | 14d | 1 | 0.65mi |
| 556 Capri L Unit L Delray Beach, FL | 2.0 | 2.0 | 910 | $1,575 | $1.73 | 24d | 1 | 0.65mi |
| 4801 S Citation Dr Delray Beach, FL | 1.0–3.0 | 1.0–2.0 | 1180 | $3,024 | $2.56 | 2d | 38 | 0.66mi |
| 452 Normandy J Delray Beach, FL | 2.0 | 2.0 | 907 | $1,600 | $1.76 | 24d | 1 | 0.69mi |
| 452 Normandy J Unit J Delray Beach, FL | 2.0 | 2.0 | 907 | $1,600 | $1.76 | 24d | 1 | 0.69mi |
| 98 Capri C Delray Beach, FL | 1.0 | 1.5 | 795 | $1,695 | $2.13 | 24d | 1 | 0.69mi |
| 595 Normandy M Delray Beach, FL | 2.0 | 2.0 | 907 | $1,750 | $1.93 | 24d | 1 | 0.73mi |
HOA detail condo
- Monthly dues
- $354 · $4,248/yr
- Likely covers
- poolsecurity
- Assessments
- None detected in remarks — confirm with the listing agent.
Listing history 29 events
-
2026-06-18days on market $149,900 Active 59 DOM
-
2026-06-17days on market $149,900 Active 58 DOM
-
2026-06-16days on market $149,900 Active 57 DOM
-
2026-06-15days on market $149,900 Active 56 DOM
-
2026-06-13days on market $149,900 Active 54 DOM
-
2026-06-09days on market $149,900 Active 50 DOM
-
2026-06-08days on market $149,900 Active 49 DOM
-
2026-06-07days on market $149,900 Active 48 DOM
-
2026-06-04days on market $149,900 Active 45 DOM
-
2026-06-03days on market $149,900 Active 44 DOM
-
2026-06-02days on market $149,900 Active 43 DOM
-
2026-06-01days on market $149,900 Active 42 DOM
-
2026-05-31days on market $149,900 Active 41 DOM
-
2026-04-20$149,900 Active
-
2026-04-01historical
-
2025-06-10price $174,900
-
2025-04-21$184,900 Active
-
2025-01-01historical
-
2023-11-07$220,000 Active
-
2023-11-06historical
-
2023-02-15price $200,000
-
2022-10-13price $219,900
-
2022-09-19$229,900 Active
-
2013-09-22historical
-
2001-03-26soldstatus $57,000
-
2001-03-26soldstatus $57,000
-
2001-02-26historical
-
2000-10-02$60,000
-
2000-03-29$69,000
ⓘ Source: listings_history table (triggers on properties + properties_extension) + one-shot
backfill from property_details.listing_events for pre-trigger history.
Tax reassessment forecast FL · Resets to sale price
- Current annual tax
- $2,708 · $226/mo
- Projected year-2 tax
- $2,708 · $226/mo
- Expected delta
- $0/yr ($0/mo · 0.0%)
ⓘ Screening estimate from a state-policy table — verify with the county assessor before closing.
Climate risk First Street
- Flood 1/10 Low FEMA zone X (unshaded) · 0% chance over 30 yrs
- Wildfire 1/10 Low
- Heat 10/10 Extreme 7 d/yr ≥106°F today · 27 d/yr by 30 yrs out
- Wind 10/10 Extreme 99% chance of damaging wind over 30 yrs
- Air quality 3/10 Moderate 2 unhealthy d/yr today · 3 by 30 yrs out
Nearby sold comps map
Loading sold comps map…
Walkable amenities ~0.75 mi
Loading nearby amenities…
Taxation est. · year 1
- Rental income
- $24,746
- − Mortgage interest
- −$8,397
- − Property taxes
- −$2,708
- − Insurance
- −$750
- − Repairs & maintenance
- −$1,980
- − Management
- −$1,980
- − HOA
- −$4,248
- − Depreciation
- −$4,361
- Taxable income
- $324
- Est. tax owed @ 24.0%
- −$78
- After-tax cash flow
- $2,333/yr
For passive investors: Depreciation is non-cash, so a rental often shows a tax loss while cash-flowing — sheltering income. Rental losses are passive: they offset passive income freely, and up to $25,000/yr can offset ordinary (W-2) income if you actively participate and your MAGI is under $100k (phasing out to $0 by $150k); unused losses carry forward. On sale, claimed depreciation is recaptured at up to 25%, and gains may owe capital-gains tax (a 1031 exchange can defer both). Figures are a year-1 estimate at your 24.0% rate — not tax advice; consult a CPA.
Schools (NCES district)
- District
- Palm Beach
- NCES district ID
- 1201500
- Math proficiency
- 46% ▼ -16.00%
- Reading proficiency
- 53% ▼ -4.00%
- Median HH income
- $53,943
- Composite
- 42.72/100
- National rank
- #3160
- State rank
- #34 of 73 in FL
Livability — Delray Beach
- Score
- 77/100
- State rank
- #202
- US rank
- #3160
Category grades
Schools grade is shown separately in the Schools card above.
Census & demographics
- County
- Palm Beach County · 1,438,312 people
- City population
- 123,167
- Metro
- Miami-Fort Lauderdale-Pompano Beach, FL
- Population (ZIP)
- 26,208
- Household income
- $62,151
- Rent vs Own
- Severe rent burden
- 991.0
Population outlook (Palm Beach County) Hauer SSP2
- Today (2025)
- 1,637,487 people
- By 2030
- 1,743,255 · +6.5%
- By 2040
- 1,948,712 · +19.0%
- By 2050
- 2,132,979 · +30.3%
- By 2075
- 2,530,027 · +54.5%
- By 2100
- 2,706,979 · +65.3%
Race, ethnicity, and origin ACS 2023
- Neighborhood character
- Predominantly White (74%)
- Race & ethnicity
- White 74% Hispanic / Latino 14% Two or more races 10% Black 5% Asian 2%
- Hispanic origin (detail)
- Puerto Rican 2% Cuban 2%
- Common ancestry
- Scotch-Irish 7% Romanian 6% Italian 2%
- Foreign-born
- 23% · Canada, Jamaica, China
- Languages at home
- 76% English-only · Spanish 13% Russian/Polish/Slavic 3% French/Haitian/Cajun 3%
Political lean MEDSL · Palm Beach
- 2024 margin
- Toss-up / Even · D 50.0% · R 49.2%
- 2008→2024 swing
- -22.1pp toward R · 2008: 22.9pp · 2024: 0.8pp
- All cycles
- 2024: D+0.8 2020: D+12.8 2016: D+15.3 2012: D+17.0 2008: D+22.9
Not yet ingested
- Civics
- —
Market trends
- HPI YoY
- ▼ -232.73%
- Current HPI
- 254.5016
- Rent YoY
- ▲ 4.28%
- Metro
- Miami-Fort Lauderdale-Pompano Beach, FL
- State GDP YoY
- ▲ 3.28%
- F500 in state
- 36
Industry mix (Fortune 500 HQ in FL)
| Industry | F500 HQs | Revenue |
|---|---|---|
| Industrial Technology | 2 | $29B |
|
||
| Insurance | 2 | $17B |
|
||
| Retail | 1 | $60B |
|
||
| Technology Distribution | 1 | $58B |
|
||
| Homebuilding | 1 | $35B |
|
||
| Technology Manufacturing | 1 | $35B |
|
||
Price history
+117.2% since first listed16 events — show timeline
- 2026-04-20 Listed $149,900 Beaches MLS
- 2026-04-01 Listing Removed — Beaches MLS
- 2025-06-10 Price Changed $174,900 Beaches MLS
- 2025-04-21 Listed $184,900 Beaches MLS
- 2025-01-01 Listing Removed — Beaches MLS
- 2023-11-07 Listed $220,000 Beaches MLS
- 2023-11-06 Listing Removed — Beaches MLS
- 2023-02-15 Price Changed $200,000 Beaches MLS
- 2022-10-13 Price Changed $219,900 Beaches MLS
- 2022-09-19 Listed $229,900 Beaches MLS
- 2013-09-22 Listing Removed — Beaches MLS
- 2001-03-26 Sold (Public Records) $57,000 Public Records
- 2001-03-26 Sold (MLS) $57,000 Beaches MLS
- 2001-02-26 Listing Removed — Beaches MLS
- 2000-10-02 Listed $60,000 Beaches MLS
- 2000-03-29 Listed $69,000 Beaches MLS
Property tax history
+6.8%/yrLatest (2025): $2,708 · +7.2% YoY. Source: county tax records.
Cash-flow waterfall
monthlySold comps — $/sqft
last 12 mo · ≤1 miLoading sold comps…