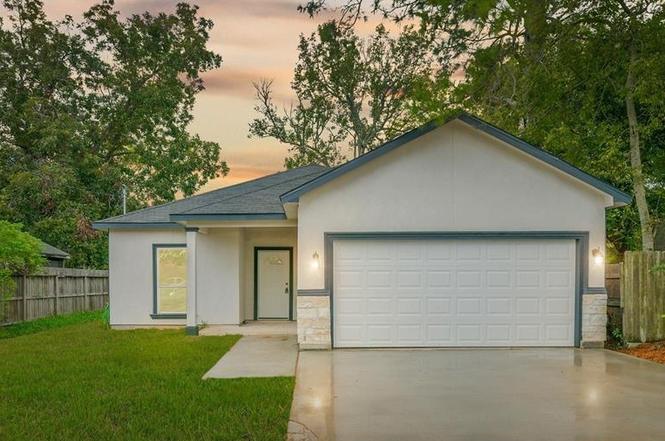
2609 Boss St · La Marque, TX
Flood risk 5/10 · Moderate
- FEMA flood zone
- X (shaded)
- Chance of flooding over 30 yrs
- 0.43%
- Est. flood insurance / yr
- $507 – $1,088
Fire risk 3/10 · Minor
- Est. fire insurance / yr
- $1,222 – $2,270
Heat risk 10/10 · Severe
- Hot days now (above 110°F)
- 7 days/yr
- Hot days in 30 yrs
- 27 days/yr
Wind risk 10/10 · Severe
- Chance of severe wind over 30 yrs
- 99.0%
Air-quality risk 3/10 · Minor
- Unhealthy air days now
- 2 days/yr
- Unhealthy air days in 30 yrs
- 2 days/yr
Risk factors via First Street. Map © Google.
Why this score? — see what drove the F grade
The composite is a weighted blend of 9 inputs, each scored 0–100. Each bar is that input's sub-score; the figure is the points it added to the 100-point composite (weight × sub-score).
- ARV discount +8.2/15.0
- Cash flow +8.0/30.0
- Rent growth +3.5/5.0
- 1% rule +3.4/10.0
- Livability +3.0/5.0
- Condition / age +2.5/5.0
- Schools +2.4/10.0
- DSCR +2.0/10.0
- Appreciation +0.0/10.0
$249,000
🖨 Deal sheet 📄 Offer letter ✓ Due diligence
Listing remarks
MOVE IN READY!! Welcome to this beautifully updated home in the heart of La Marque! Nestled on a quiet street, this charming property offers modern comfort, an open layout, and a spacious backyard—perfect for relaxing or entertaining. Home features a modern luxury touch throughout, including quartz countertops in kitchen and bathrooms. Located on a quiet street with quick access to I-45 and just minutes from Galveston, this move-in-ready home is ideal for buyers seeking style, comfort, and convenience. This home is waiting for its new owner! Let it be You!
Key facts
- Quartz countertops
- Spacious backyard
- Quick access to i-45
Tags
Property features AI
Finance
- Other: Seller disclosure available
Exterior
- Parking: Attached 2-car garage
- Utilities: Public water; Public sewer
- Home design: Residential property; Single-story (first-floor living); Built in 2022; Slab foundation
- Construction: Cement siding, stone and stucco exterior; Composition/shingle/wood roof
- Exterior features: Covered patio; Patio; Deck; Private yard; Fenced backyard; Subdivision lot
Interior
- Kitchen: Disposal
- Bedrooms: Primary bedroom (first floor) — approx. 14 x 12; Bedroom (first floor) — approx. 12 x 11.5; Bedroom (first floor) — approx. 12 x 10; Bonus room (first floor)
- Flooring: Plank; Tile; Vinyl
- Bathrooms: 2 full bathrooms
- Heating & cooling: Central heating (electric); Central air (electric)
- Interior features: Breakfast bar; Pantry; Self-closing cabinet doors; Self-closing drawers; Ceiling fans; Kitchen/Dining combo
- Laundry & utility: Washer hookup; Electric dryer hookup
Neighborhood map
What this means for you Summary
Snapshot
- This is a 3-bed/2.0-bath single-family listed at $249k.
Deal economics
- At list price, monthly cash flow is $-256 ($-3k/yr) — negative.
- To cash-flow at today's rent, offer at most $204k (18.2% below list).
- To meet the 1% rule (rent ≥ 1% of price), the offer needs to be $209k (16.2% below list).
- Recommended offer: $204k (18.2% below list) — sets the bar for cash-flow.
Location & tenants
- Location reads 59/100 on livability (#1,136 in TX) — a working-class tenant base; expect higher turnover. Strengths: cost of living A+, housing A+; Watch: employment D, crime F, amenities F.
- Texas City ISD (suburban): math 28% / reading 29% proficiency, ranked #655 of 826 in TX (top 79%) — low school quality limits family demand, transient renter base, plan for 1-2y turnover; 66% free/reduced lunch — lower-income household profile, screen leases tightly.
- Zoned schools: Hayley El (math 7% / reading 11%, grade F, #4,293 of 4,322 statewide, top 99%, 562 students, 92% FRL); La Marque H S (math 27% / reading 20%, grade F, #1,342 of 1,632 statewide, top 82%, 647 students, 91% FRL) — zoned schools average 92% FRL vs 66% district-wide (26 pts higher); higher-poverty schools than district average — tighter screening recommended.
- Zoned-school proficiency averages 16% at this address vs 28% district-wide (-12 pts) — the specific schools serving this property underperform the Texas City ISD average; the district grade overstates school quality for this exact location.
- Market conditions: Rents rising (+4.0%/yr); 654 active listings in the ZIP; 8 comparable units currently listed for rent nearby; rentals at typical pace (median 24d on market — plan ~3-4 weeks tenant-placement turnaround); 3,258 units permitted in Galveston County in 2024 (0 in 5+ unit buildings).
- This rent runs 34% of the median local income ($75k/yr) — at the standard rent-burdened threshold; future hikes will face affordability resistance.
Forward outlook
- Local home prices are declining (-3.0%/yr); year-one equity from $2k of loan paydown is wiped out by about $7k of value loss. Plan a longer hold.
- Galveston County population projected at +43% by 2050 — long-run rental-demand tailwind backs the buy-and-hold thesis.
Negotiation context
- It's been on market 159 days — a 12% lower offer ($219k) is reasonable based on typical stale-listing flexibility.
- 3 sale attempts since 3y ago; this cycle's ask has dropped $17k (6%) from the opening price — seller is motivated, your offer sets the floor, not the list.
Risks & watch-outs
- Climate carrying-cost: moderate flood risk; severe wind risk, 99% chance of damaging wind over 30y; extreme-heat days projected 7→27/yr by 2055 (HVAC capex compounding) — expect insurance premiums to compound above CPI over the hold.
Questions for the listing agent
- What do current leases actually rent for vs. the listed asking? Can we see a recent rent roll and the last 12 months of T-12 income?
- It's been on market 159 days. Have you received any prior offers? Is the seller open to a 18% concession, seller financing, or rate buy-down credit?
- Why hasn't it sold? Are there any deal-killer items the seller is aware of (foundation, flood, title, zoning, code violations)?
- Is there a deadline driving the sale (1031 exchange, divorce, estate, relocation)? That informs how much negotiation room exists.
- Schools are F-rated, which usually means shorter tenancies and higher turnover. Who's the typical renter profile here, and what's been the actual vacancy rate?
- Crime grade is F in this area — have there been break-ins, vandalism, or insurance claims at this property in the last 3 years? What carrier currently insures it and at what premium?
- The area grade is low — what's the realistic commute time and amenity access for the typical tenant pool here? Any planned neighborhood developments (good or bad) we should know about?
- What's the average days-on-market for RENTAL listings here right now (not sales)? A rising rental-DOM trend means longer vacancies and softer asking-rent achievability than the comps imply.
- What's the recent tenant-quality profile in this submarket — average credit score on applications, eviction rate, late-payment / NSF rate, and stable-employment percentage? A property-management company in the area should have these aggregated.
- How much new for-sale + rental construction is in the pipeline within 1–3 miles? Heavy new supply typically softens prices + rents 12–24 months out; constrained supply supports both.
Investment metrics
- 1% rule
- 0.84% ✗
- Cap rate
- 5.06%
- Cash-on-cash
- -4.41%
- DSCR
- 0.80
- GRM
- 9.9
CMA / ARV
- ARV (on-the-fly)
- $252,855
- Comps found
- 12
Show comp detail 12 sales within ~0.75 mi
| Address | Dist | Beds/Ba | Sqft | Sold | Price | $/sf | Match |
|---|---|---|---|---|---|---|---|
| 121 Lake Rd | 0.31mi | 3/2.0 | 1,909 (+2%) | 4mo | $68,000 | $36 | 79 |
| 2012 Bellview | 0.17mi | 4/3.0 (+1) | 1,812 (-3%) | 1mo | $254,900 | $141 | 77 |
| 2832 Ashley St | 0.28mi | 3/2.0 | 1,750 (-7%) | 1mo | $289,000 | $165 | 75 |
| 2508 N Houston Dr | 0.40mi | 4/2.0 (+1) | 1,867 (-0%) | 2mo | $115,000 | $62 | 74 |
| 2805 N Houston Dr | 0.44mi | 3/2.5 | 1,832 (-2%) | 4mo | $130,000 | $71 | 70 |
| 2405 Stonewall St | 0.30mi | 4/3.0 (+1) | 1,812 (-3%) | 2mo | $249,900 | $138 | 70 |
| 1825 Thompson St | 0.29mi | 3/2.5 | 1,676 (-10%) | 4mo | $229,900 | $137 | 64 |
| 1401 Austin St | 0.49mi | 4/3.0 (+1) | 2,054 (+10%) | 4mo | $249,900 | $122 | 49 |
| 112 S Rose St | 0.64mi | 4/3.0 (+1) | 1,812 (-3%) | 9mo | $244,900 | $135 | 48 |
| 3116 Mckinney Dr | 0.47mi | 4/2.0 (+1) | 2,116 (+13%) | 7mo | $165,000 | $78 | 46 |
| 114 S Rose St | 0.63mi | 3/2.5 | 1,676 (-10%) | 6mo | $229,900 | $137 | 46 |
| 1112 Cora St | 0.60mi | 3/2.0 | 1,631 (-13%) | 6mo | $175,000 | $107 | 45 |
Match score weights: distance 35% · size 25% · config 20% · recency 20%. Top-matched comps best support the ARV.
Projected returns pro-forma
-3.0% appreciation · 3.95% rent growth · sell at horizon
- IRR
- -22.5%
- Equity multiple
- 0.22×
- Total profit
- $-54,492
- Equity at exit
- $37,127
- IRR
- -14.1%
- Equity multiple
- 0.15×
- Total profit
- $-59,432
- Equity at exit
- $21,529
Cash invested: $69,720 (down + closing). Projections, not guarantees.
Landlord ↔ Tenant lean methodology
- Overall (STATE)
- 87 Strongly Landlord-Friendly
- State Texas
- 87 Strongly Landlord-Friendly · R+5
- County
- — inherits STATE
- City
- — inherits STATE
ZIP-level market 77568
- Home prices YoY
- -22.7%
- Rents YoY
- 4.0%
- Active inventory
- 654
- Price-to-rent
- 9.9×
Monthly cashflow live
- Estimated rent
- $2,087 high interval (Pro) →
- Mortgage (P&I)
- −$1,306
- Tax from tax record
- −$495 /mo · $5,938/yr
- Insurance
- −$104
- HOA
- −$0
- Vacancy / Maint / Mgmt
- −$438
- Net cashflow
- $-256
Break-even live
UW: 25.0% down · 7.5% · 30yr · 1.5% tax · 5.0% vac · 8.0% maint · 8.0% mgmt
Financing live
Cash to close
- Down payment
- $62,250
- Closing costs
- $7,470
- Reserves months
- —
- Total cash needed
- —
Loan-product check · same deal, 3 products live
Conventional
25% down · 7.5% · 30yr
- Down + closing
- —
- Monthly P&I
- —
- Monthly cashflow
- —
- DSCR
- —
- Eligible?
- —
Personal DTI + credit; lowest rate.
DSCR
20% down · 8.5% · 30yr
- Down + closing
- —
- Monthly P&I
- —
- Monthly cashflow
- —
- DSCR
- —
- Eligible?
- —
No personal income docs; deal must DSCR.
Hard money
10% down · 12.0% · 12mo
- Down + closing
- —
- Monthly P&I
- —
- Monthly cashflow
- —
- DSCR
- —
- Eligible?
- —
Short-term bridge; refi at stabilization.
Rent comps 8 comps
| Address | Beds | Baths | Sqft | Rent | $/sqft | DOM | Units | Dist |
|---|---|---|---|---|---|---|---|---|
| 1006 E Camp Cir La Marque, TX | 3.0 | 1.0 | 1230 | $1,500 | $1.22 | 24d | 1 | 0.29mi |
| 1401 Austin St La Marque, TX | 4.0 | 3.0 | 1542 | $2,400 | $1.56 | 43d | 1 | 0.46mi |
| 309 S Bell Dr Texas City, TX | 2.0 | 2.0 | 1316 | $1,650 | $1.25 | 43d | 1 | 0.57mi |
| 1230 Kirsten St La Marque, TX | 3.0 | 2.0 | 1704 | $1,660 | $0.97 | 2d | 1 | 0.64mi |
| 203 Beatrice St La Marque, TX | 3.0 | 1.0 | 1304 | $1,395 | $1.07 | 24d | 1 | 0.72mi |
| 14403 Daniel Shores Dr La Marque, TX | 4.0 | 3.0–3.5 | 1872 | $2,600 | $1.39 | 1d | 12 | 0.99mi |
| 1029 Sycamore St La Marque, TX | 3.0 | 2.0 | 1928 | $1,695 | $0.88 | 15d | 1 | 1.18mi |
| 113 N Pecan Dr Texas City, TX | 4.0 | 2.0 | 1468 | $3,000 | $2.04 | 43d | 1 | 1.41mi |
Listing history 13 events
-
2026-05-05status Pending
-
2026-04-30status Pending
-
2026-04-09price $249,000
-
2026-04-09price $255,999
-
2025-11-26$265,999 Active
-
2024-10-07soldstatus
-
2024-04-09historical
-
2024-02-25price $299,000
-
2023-12-24price $329,000
-
2023-11-18status Active
-
2023-09-12historical
-
2023-01-15$349,500 Active
-
2018-08-03soldstatus
ⓘ Source: listings_history table (triggers on properties + properties_extension) + one-shot
backfill from property_details.listing_events for pre-trigger history.
Tax reassessment forecast TX · Resets to sale price
- Current annual tax
- $5,938 · $495/mo
- Projected year-2 tax
- $5,938 · $495/mo
- Expected delta
- $0/yr ($0/mo · 0.0%)
ⓘ Screening estimate from a state-policy table — verify with the county assessor before closing.
Climate risk First Street
- Flood 5/10 Major FEMA zone X (shaded) · 43% chance over 30 yrs
- Wildfire 3/10 Moderate
- Heat 10/10 Extreme 7 d/yr ≥110°F today · 27 d/yr by 30 yrs out
- Wind 10/10 Extreme 99% chance of damaging wind over 30 yrs
- Air quality 3/10 Moderate 2 unhealthy d/yr today · 2 by 30 yrs out
Nearby sold comps map
Loading sold comps map…
Walkable amenities ~0.75 mi
Loading nearby amenities…
Taxation est. · year 1
- Rental income
- $25,039
- − Mortgage interest
- −$13,948
- − Property taxes
- −$5,938
- − Insurance
- −$1,245
- − Repairs & maintenance
- −$2,003
- − Management
- −$2,003
- − Depreciation
- −$7,244
- Taxable loss
- −$7,341
- Est. tax savings @ 24.0%
- +$1,762
- After-tax cash flow
- $-1,309/yr
For passive investors: Depreciation is non-cash, so a rental often shows a tax loss while cash-flowing — sheltering income. Rental losses are passive: they offset passive income freely, and up to $25,000/yr can offset ordinary (W-2) income if you actively participate and your MAGI is under $100k (phasing out to $0 by $150k); unused losses carry forward. On sale, claimed depreciation is recaptured at up to 25%, and gains may owe capital-gains tax (a 1031 exchange can defer both). Figures are a year-1 estimate at your 24.0% rate — not tax advice; consult a CPA.
Schools (NCES district)
- District
- Texas City ISD
- NCES district ID
- 4842510
- Math proficiency
- 28% ▼ -10.00%
- Reading proficiency
- 29% ▼ -4.00%
- Median HH income
- $44,875
- Composite
- 24.47/100
- National rank
- #7664
- State rank
- #655 of 826 in TX
Livability — La Marque
- Score
- 59/100
- State rank
- #1136
- US rank
- #20037
Category grades
Schools grade is shown separately in the Schools card above.
Census & demographics
- Census place
- La Marque, TX
- County
- Galveston County · 357,330 people
- City population
- 23,083
- Metro
- Houston-The Woodlands-Sugar Land, TX
- Population (ZIP)
- 23,083
- Household income
- $74,694
- Rent vs Own
- Severe rent burden
- 700.0
Population outlook (Galveston County) Hauer SSP2
- Today (2025)
- 390,640 people
- By 2030
- 425,226 · +8.9%
- By 2040
- 493,765 · +26.4%
- By 2050
- 559,698 · +43.3%
- By 2075
- 719,260 · +84.1%
- By 2100
- 819,628 · +109.8%
Race, ethnicity, and origin ACS 2023
- Neighborhood character
- Highly diverse neighborhood (Simpson 0.71)
- Race & ethnicity
- White 37% Hispanic / Latino 29% Black 26% Two or more races 17% Asian 3%
- Hispanic origin (detail)
- Mexican 22% Puerto Rican 1%
- Common ancestry
- Lithuanian 1% Italian 1% Serbian 1%
- Foreign-born
- 8% · Canada
- Languages at home
- 77% English-only · Spanish 21% Tagalog/Filipino 1% Other Asian/Pacific 1%
Political lean MEDSL · Galveston
- 2024 margin
- Strong R (+27.4) · D 35.7% · R 63.1% · Other 1.2%
- 2008→2024 swing
- -7.9pp toward R · 2008: -19.5pp · 2024: -27.4pp
- All cycles
- 2024: R+27.4 2020: R+22.6 2016: R+22.6 2012: R+26.9 2008: R+19.5
Not yet ingested
- Civics
- —
Market trends
- HPI YoY
- ▼ -69.39%
- Current HPI
- 236.0239
- Rent YoY
- ▲ 3.95%
- Metro
- Houston-The Woodlands-Sugar Land, TX
- State GDP YoY
- ▲ 3.95%
- F500 in state
- 110
Industry mix (Fortune 500 HQ in TX)
| Industry | F500 HQs | Revenue |
|---|---|---|
| Energy | 16 | $1,198B |
|
||
| Technology | 5 | $198B |
|
||
| Engineering / Construction | 4 | $72B |
|
||
| Energy Services | 3 | $60B |
|
||
| Utilities | 3 | $41B |
|
||
| Healthcare | 2 | $330B |
|
||
Price history
-28.8% since first listed13 events — show timeline
- 2026-05-05 Pending — HARMLS
- 2026-04-30 Pending — HARMLS
- 2026-04-09 Price Changed $249,000 HARMLS
- 2026-04-09 Price Changed $255,999 HARMLS
- 2025-11-26 Listed $265,999 HARMLS
- 2024-10-07 Sold (Public Records) — Public Records
- 2024-04-09 Listing Removed — HARMLS
- 2024-02-25 Price Changed $299,000 HARMLS
- 2023-12-24 Price Changed $329,000 HARMLS
- 2023-11-18 Relisted — HARMLS
- 2023-09-12 Listing Removed — HARMLS
- 2023-01-15 Listed $349,500 HARMLS
- 2018-08-03 Sold (Public Records) — Public Records
Property tax history
+49.2%/yrLatest (2025): $5,938 · -3.5% YoY. Source: county tax records.
Cash-flow waterfall
monthlySold comps — $/sqft
last 12 mo · ≤1 miLoading sold comps…