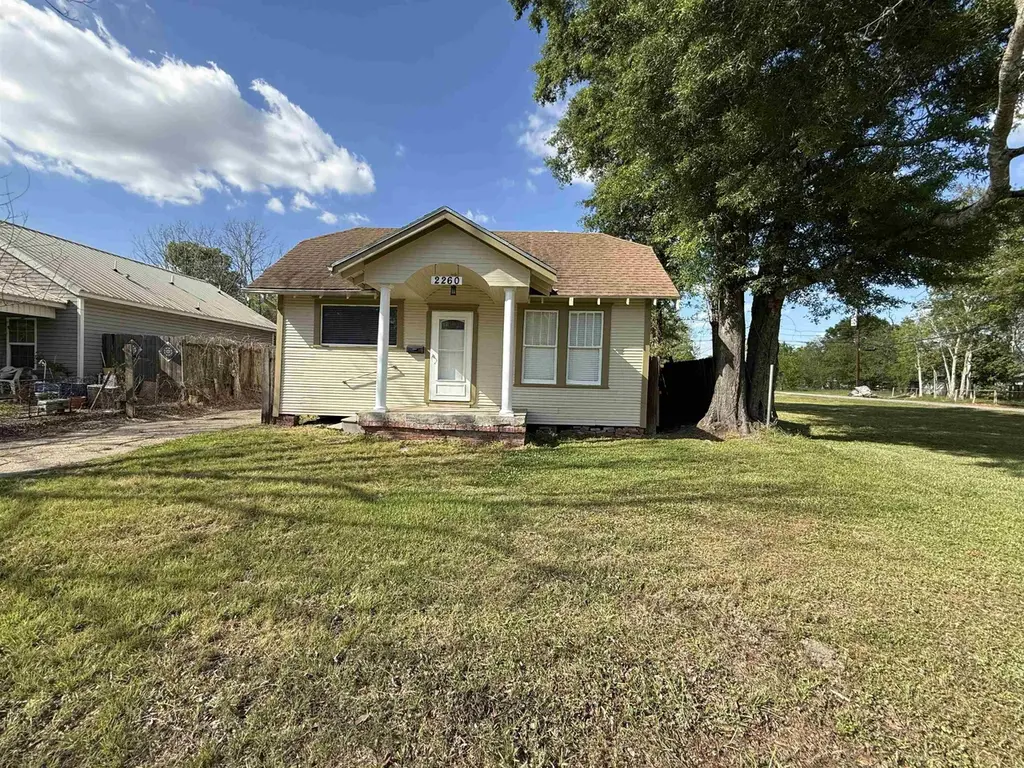
2260 Rusk St · Beaumont, TX
Flood risk 4/10 · Minor
- FEMA flood zone
- X
- Chance of flooding over 30 yrs
- 0.24%
- Est. flood insurance / yr
- $507 – $1,088
Fire risk 1/10 · Minimal
- Est. fire insurance / yr
- $1,222 – $2,270
Heat risk 9/10 · Severe
- Hot days now (above 109°F)
- 7 days/yr
- Hot days in 30 yrs
- 24 days/yr
Wind risk 9/10 · Severe
- Chance of severe wind over 30 yrs
- 99.0%
Air-quality risk 2/10 · Minimal
- Unhealthy air days now
- 1 days/yr
- Unhealthy air days in 30 yrs
- 1 days/yr
Risk factors via First Street. Map © Google.
Why this score? — see what drove the C grade
The composite is a weighted blend of 9 inputs, each scored 0–100. Each bar is that input's sub-score; the figure is the points it added to the 100-point composite (weight × sub-score).
- Cash flow +16.3/30.0
- ARV discount +15.0/15.0
- Appreciation +8.1/10.0
- DSCR +5.0/10.0
- 1% rule +4.4/10.0
- Livability +3.2/5.0
- Rent growth +2.5/5.0
- Condition / age +2.5/5.0
- Schools +1.5/10.0
$115,000
🖨 Deal sheet 📄 Offer letter ✓ Due diligence
Listing remarks MLS
This diamond in the rough is ready for you to bring it back to life and make it your own in the heart of the Oaks Historic District. Original hardwood floors add warmth and character throughout the main living spaces, while fresh interior and exterior paint provide a clean starting point for your vision. Imagine slow mornings with coffee by the windows, evenings spent restoring the charm of a classic home, and weekends creating a space that reflects your personal style. Mature trees and a timeless neighborhood setting offer the kind of character you simply cannot recreate. With solid bones and endless potential, this is your opportunity to create something truly special in one of Beaumont’s most established historic areas.
Key facts
- Solid bones
- Endless potential
- Hardwood floors
Tags
Neighborhood map
What this means for you Summary
Snapshot
- This is a 3-bed/1.0-bath single-family listed at $115k.
Deal economics
- At list price, monthly cash flow is $63 ($751/yr) — positive.
- The deal already cash-flows at list — no discount required.
- To meet the 1% rule (rent ≥ 1% of price), the offer needs to be $108k (5.8% below list).
- Recommended offer: $108k (6.0% below list) — sets the bar for market timing.
- Cap rate 6.9% vs local median 5.3% in Beaumont — top-decile yield for the area; either an underpriced asset or a hidden risk that comps aren't pricing in. Stress-test before assuming the spread holds.
Location & tenants
- Location reads 64/100 on livability (#739 in TX) — a middle-class / working-renter tenant base. Strengths: cost of living A+, housing A+, health & safety A+; Watch: employment D, schools D-, crime F.
- Beaumont ISD (urban): math 14% / reading 22% proficiency, ranked #789 of 826 in TX (top 96%) — low school quality limits family demand, transient renter base, plan for 1-2y turnover; 69% free/reduced lunch — lower-income household profile, screen leases tightly.
- Market conditions: 73 active listings in the ZIP; 20 comparable units currently listed for rent nearby; rentals at typical pace (median 24d on market — plan ~3-4 weeks tenant-placement turnaround); 343 units permitted in Jefferson County in 2024 (0 in 5+ unit buildings).
Forward outlook
- In year one you build about $8k of equity ($795 loan paydown + $7k appreciation (6.2% local appreciation)).
- At projected returns (6.2% appreciation + 3.0% rent growth), your $32k cash investment doubles in ~4 years — after that, you're playing with house money.
- By year 5, paydown + projected appreciation supports a ~$35k cash-out refi (75% LTV) — recoverable capital for the next deal without selling this one.
Negotiation context
- It's been on market 83 days — a 6% lower offer ($108k) is reasonable based on typical stale-listing flexibility.
Risks & watch-outs
- Climate carrying-cost: severe wind risk, 99% chance of damaging wind over 30y; extreme-heat days projected 7→24/yr by 2055 (HVAC capex compounding) — expect insurance premiums to compound above CPI over the hold.
Questions for the listing agent
- It's been on market 83 days. Have you received any prior offers? Is the seller open to a 6% concession, seller financing, or rate buy-down credit?
- Built in 1962 — when were the roof, HVAC, electrical panel, plumbing, and water heater last replaced?
- Why hasn't it sold? Are there any deal-killer items the seller is aware of (foundation, flood, title, zoning, code violations)?
- Is there a deadline driving the sale (1031 exchange, divorce, estate, relocation)? That informs how much negotiation room exists.
- Schools are D-rated, which usually means shorter tenancies and higher turnover. Who's the typical renter profile here, and what's been the actual vacancy rate?
- Crime grade is F in this area — have there been break-ins, vandalism, or insurance claims at this property in the last 3 years? What carrier currently insures it and at what premium?
- What's the average days-on-market for RENTAL listings here right now (not sales)? A rising rental-DOM trend means longer vacancies and softer asking-rent achievability than the comps imply.
- What's the recent tenant-quality profile in this submarket — average credit score on applications, eviction rate, late-payment / NSF rate, and stable-employment percentage? A property-management company in the area should have these aggregated.
- How much new for-sale + rental construction is in the pipeline within 1–3 miles? Heavy new supply typically softens prices + rents 12–24 months out; constrained supply supports both.
Investment metrics
- 1% rule
- 0.94% ✗
- Cap rate
- 6.95%
- Cash-on-cash
- 2.33%
- DSCR
- 1.10
- GRM
- 8.8
CMA / ARV
- ARV (median comp)
- $145,067
- List price
- $115,000
- Delta
- -20.73%
- Verdict
- UNDERPRICED
- Comps
- 15 within 1.0 mi
Projected returns pro-forma
6.25% appreciation · 3.0% rent growth · sell at horizon
- IRR
- 17.9%
- Equity multiple
- 2.21×
- Total profit
- $38,932
- Equity at exit
- $74,133
- IRR
- 17.4%
- Equity multiple
- 4.45×
- Total profit
- $110,993
- Equity at exit
- $136,053
Cash invested: $32,200 (down + closing). Projections, not guarantees.
Landlord ↔ Tenant lean methodology
- Overall (STATE)
- 87 Strongly Landlord-Friendly
- State Texas
- 87 Strongly Landlord-Friendly · R+5
- County
- — inherits STATE
- City
- — inherits STATE
ZIP-level market 77701
- Home prices YoY
- 3.8%
- Active inventory
- 73
- Price-to-rent
- 8.8×
Monthly cashflow live
- Estimated rent
- $1,083 high interval (Pro) →
- Mortgage (P&I)
- −$603
- Tax from tax record
- −$142 /mo · $1,703/yr
- Insurance
- −$48
- HOA
- −$0
- Vacancy / Maint / Mgmt
- −$227
- Net cashflow
- $63
Break-even live
UW: 25.0% down · 7.5% · 30yr · 1.5% tax · 5.0% vac · 8.0% maint · 8.0% mgmt
Financing live
Cash to close
- Down payment
- $28,750
- Closing costs
- $3,450
- Reserves months
- —
- Total cash needed
- —
Loan-product check · same deal, 3 products live
Conventional
25% down · 7.5% · 30yr
- Down + closing
- —
- Monthly P&I
- —
- Monthly cashflow
- —
- DSCR
- —
- Eligible?
- —
Personal DTI + credit; lowest rate.
DSCR
20% down · 8.5% · 30yr
- Down + closing
- —
- Monthly P&I
- —
- Monthly cashflow
- —
- DSCR
- —
- Eligible?
- —
No personal income docs; deal must DSCR.
Hard money
10% down · 12.0% · 12mo
- Down + closing
- —
- Monthly P&I
- —
- Monthly cashflow
- —
- DSCR
- —
- Eligible?
- —
Short-term bridge; refi at stabilization.
Rent comps 20 comps
| Address | Beds | Baths | Sqft | Rent | $/sqft | DOM | Units | Dist |
|---|---|---|---|---|---|---|---|---|
| 2329 Broadway Unit 2337-02 Beaumont, TX | 2.0 | 1.0 | 990 | $999 | $1.01 | 23d | 1 | 0.40mi |
| 2329 Broadway Unit 2290-06 Beaumont, TX | 2.0 | 1.0 | 990 | $999 | $1.01 | 14d | 1 | 0.40mi |
| 705 N 5th St Beaumont, TX | 2.0 | 1.0 | 900 | $800 | $0.89 | 14d | 1 | 0.63mi |
| 2248 Hazel St Beaumont, TX | 2.0 | 1.5 | 950 | $795 | $0.84 | 44d | 1 | 0.70mi |
| 1860 Forsythe St Unit 1860 Beaumont, TX | 2.0 | 1.0 | 700 | $800 | $1.14 | 21d | 1 | 0.73mi |
| 880 N 7th St Unit 10 Beaumont, TX | 2.0 | 1.0 | 880 | $875 | $0.99 | 44d | 1 | 0.73mi |
| 2275 Harrison Ave Unit 14 Beaumont, TX | 2.0 | 1.0 | 880 | $875 | $0.99 | 23d | 1 | 0.73mi |
| 2275 Harrison Ave Unit 15 Beaumont, TX | 2.0 | 1.0 | 880 | $875 | $0.99 | 44d | 1 | 0.73mi |
| 690 E Avenue Unit A Beaumont, TX | 3.0 | 1.0 | 1300 | $975 | $0.75 | 14d | 1 | 0.73mi |
| 2290 Long Ave Unit 05 Beaumont, TX | 2.0 | 1.0 | 1055 | $950 | $0.90 | 23d | 1 | 0.83mi |
| 2260 Ashley St Beaumont, TX | 3.0 | 2.0 | 1471 | $1,595 | $1.08 | 14d | 1 | 0.89mi |
| 2640 Harrison Ave Beaumont, TX | 3.0 | 1.0 | 1158 | $1,295 | $1.12 | 23d | 1 | 0.93mi |
| 1107 Avenue A Unit 1111 Beaumont, TX | 2.0 | 1.0 | 1012 | $995 | $0.98 | 23d | 1 | 1.09mi |
| 1107 Avenue A Unit 1109 Beaumont, TX | 2.0 | 1.0 | 1012 | $995 | $0.98 | 44d | 1 | 1.09mi |
| 355 N 18th St Beaumont, TX | 3.0 | 2.0 | 1050 | $1,395 | $1.33 | 44d | 1 | 1.19mi |
| 2450 S 8th St Beaumont, TX | 3.0 | 1.0 | 940 | $1,450 | $1.54 | 14d | 1 | 1.21mi |
| 3720 Laurel Ave Unit Laurel Ave unit 12 Beaumont, TX | 2.0 | 1.5 | 1188 | $1,095 | $0.92 | 23d | 1 | 1.33mi |
| 3720 Laurel St #6 Beaumont, TX | 2.0 | 1.5 | 1152 | $1,095 | $0.95 | 14d | 1 | 1.34mi |
| 1545 Avenue B Beaumont, TX | 2.0 | 1.0 | 1212 | $695 | $0.57 | 44d | 1 | 1.35mi |
| 2570 Sweetgum Ln Beaumont, TX | 1.0–2.0 | 1.0–1.5 | 876 | $1,599 | $1.82 | 14d | 15 | 1.42mi |
Listing history 18 events
-
2026-06-18days on market $115,000 Active 83 DOM
-
2026-06-17days on market $115,000 Active 82 DOM
-
2026-06-16days on market $115,000 Active 81 DOM
-
2026-06-15days on market $115,000 Active 80 DOM
-
2026-06-14days on market $115,000 Active 78 DOM
-
2026-06-13days on market $115,000 Active 77 DOM
-
2026-06-10days on market $115,000 Active 75 DOM
-
2026-06-09days on market $115,000 Active 74 DOM
-
2026-06-08days on market $115,000 Active 73 DOM
-
2026-06-07days on market $115,000 Active 72 DOM
-
2026-06-03days on market $115,000 Active 68 DOM
-
2026-06-02days on market $115,000 Active 67 DOM
-
2026-06-01days on market $115,000 Active 66 DOM
-
2026-05-31days on market $115,000 Active 65 DOM
-
2026-05-30days on market $115,000 Active 64 DOM
-
2026-05-09price $115,000 738-char remark
Show marketing remark (738 chars)
This diamond in the rough is ready for you to bring it back to life and make it your own in the heart of the Oaks Historic District. Original hardwood floors add warmth and character throughout the main living spaces, while fresh interior and exterior paint provide a clean starting point for your vision. Imagine slow mornings with coffee by the windows, evenings spent restoring the charm of a classic home, and weekends creating a space that reflects your personal style. Mature trees and a timeless neighborhood setting offer the kind of character you simply cannot recreate. With solid bones and endless potential, this is your opportunity to create something truly special in one of Beaumont’s most established historic areas.
-
2026-03-27$125,000 Active 738-char remark
Show marketing remark (738 chars)
This diamond in the rough is ready for you to bring it back to life and make it your own in the heart of the Oaks Historic District. Original hardwood floors add warmth and character throughout the main living spaces, while fresh interior and exterior paint provide a clean starting point for your vision. Imagine slow mornings with coffee by the windows, evenings spent restoring the charm of a classic home, and weekends creating a space that reflects your personal style. Mature trees and a timeless neighborhood setting offer the kind of character you simply cannot recreate. With solid bones and endless potential, this is your opportunity to create something truly special in one of Beaumont’s most established historic areas.
-
2006-01-31soldstatus
ⓘ Source: listings_history table (triggers on properties + properties_extension) + one-shot
backfill from property_details.listing_events for pre-trigger history.
Tax reassessment forecast TX · Resets to sale price
- Current annual tax
- $1,703 · $142/mo
- Projected year-2 tax
- $2,104 · $175/mo
- Expected delta
- +$402/yr (+$33/mo · 23.6%)
ⓘ Screening estimate from a state-policy table — verify with the county assessor before closing.
Climate risk First Street
- Flood 4/10 Moderate FEMA zone X · 24% chance over 30 yrs
- Wildfire 1/10 Low
- Heat 9/10 Extreme 7 d/yr ≥109°F today · 24 d/yr by 30 yrs out
- Wind 9/10 Extreme 99% chance of damaging wind over 30 yrs
- Air quality 2/10 Low 1 unhealthy d/yr today · 1 by 30 yrs out
Nearby sold comps map
Loading sold comps map…
Walkable amenities ~0.75 mi
Loading nearby amenities…
Taxation est. · year 1
- Rental income
- $12,994
- − Mortgage interest
- −$6,442
- − Property taxes
- −$1,703
- − Insurance
- −$575
- − Repairs & maintenance
- −$1,040
- − Management
- −$1,040
- − Depreciation
- −$3,345
- Taxable loss
- −$1,150
- Est. tax savings @ 24.0%
- +$276
- After-tax cash flow
- $1,027/yr
For passive investors: Depreciation is non-cash, so a rental often shows a tax loss while cash-flowing — sheltering income. Rental losses are passive: they offset passive income freely, and up to $25,000/yr can offset ordinary (W-2) income if you actively participate and your MAGI is under $100k (phasing out to $0 by $150k); unused losses carry forward. On sale, claimed depreciation is recaptured at up to 25%, and gains may owe capital-gains tax (a 1031 exchange can defer both). Figures are a year-1 estimate at your 24.0% rate — not tax advice; consult a CPA.
Schools (NCES district)
- District
- Beaumont ISD
- NCES district ID
- 4809670
- Math proficiency
- 14% ▼ -13.00%
- Reading proficiency
- 22% ▼ -7.00%
- Median HH income
- $41,683
- Composite
- 15.43/100
- National rank
- #9316
- State rank
- #789 of 826 in TX
Livability — Beaumont
- Score
- 64/100
- State rank
- #739
- US rank
- #13710
Category grades
Schools grade is shown separately in the Schools card above.
Census & demographics
- Census place
- Beaumont, TX
- County
- Jefferson County · 203,592 people
- City population
- 125,901
- Metro
- Beaumont-Port Arthur, TX
- Population (ZIP)
- 12,381
- Household income
- $49,181
- Rent vs Own
- Severe rent burden
- 516.0
Population outlook (Jefferson County) Hauer SSP2
- Today (2025)
- 259,015 people
- By 2030
- 260,685 · +0.6%
- By 2040
- 263,309 · +1.7%
- By 2050
- 265,237 · +2.4%
- By 2075
- 270,193 · +4.3%
- By 2100
- 255,628 · -1.3%
Race, ethnicity, and origin ACS 2023
- Neighborhood character
- Diverse neighborhood (Simpson 0.60)
- Race & ethnicity
- Hispanic / Latino 44% Black 44% Two or more races 21% White 8% Asian 3%
- Hispanic origin (detail)
- Mexican 38%
- Common ancestry
- Lithuanian 1%
- Foreign-born
- 21% · Canada, Vietnam
- Languages at home
- 56% English-only · Spanish 40% Vietnamese 3%
Political lean MEDSL · Jefferson
- 2024 margin
- Lean R (+8.9) · D 45.1% · R 54.0%
- 2008→2024 swing
- -11.1pp toward R · 2008: 2.2pp · 2024: -8.9pp
- All cycles
- 2024: R+8.9 2020: R+1.6 2016: R+0.5 2012: D+1.6 2008: D+2.2
Not yet ingested
- Civics
- —
Market trends
- HPI YoY
- ▲ 6.25%
- Current HPI
- 170.1843
- Rent YoY
- —
- Metro
- Beaumont-Port Arthur, TX
- State GDP YoY
- ▲ 3.95%
- F500 in state
- 110
Industry mix (Fortune 500 HQ in TX)
| Industry | F500 HQs | Revenue |
|---|---|---|
| Energy | 16 | $1,198B |
|
||
| Technology | 5 | $198B |
|
||
| Engineering / Construction | 4 | $72B |
|
||
| Energy Services | 3 | $60B |
|
||
| Utilities | 3 | $41B |
|
||
| Healthcare | 2 | $330B |
|
||
Price history
-8.0% since first listed3 events — show timeline
- 2026-05-09 Price Changed $115,000 BBOR
- 2026-03-27 Listed $125,000 BBOR
- 2006-01-31 Sold (Public Records) — Public Records
Property tax history
+4.9%/yrLatest (2025): $1,703 · +5.5% YoY. Source: county tax records.
Cash-flow waterfall
monthlySold comps — $/sqft
last 12 mo · ≤1 miLoading sold comps…