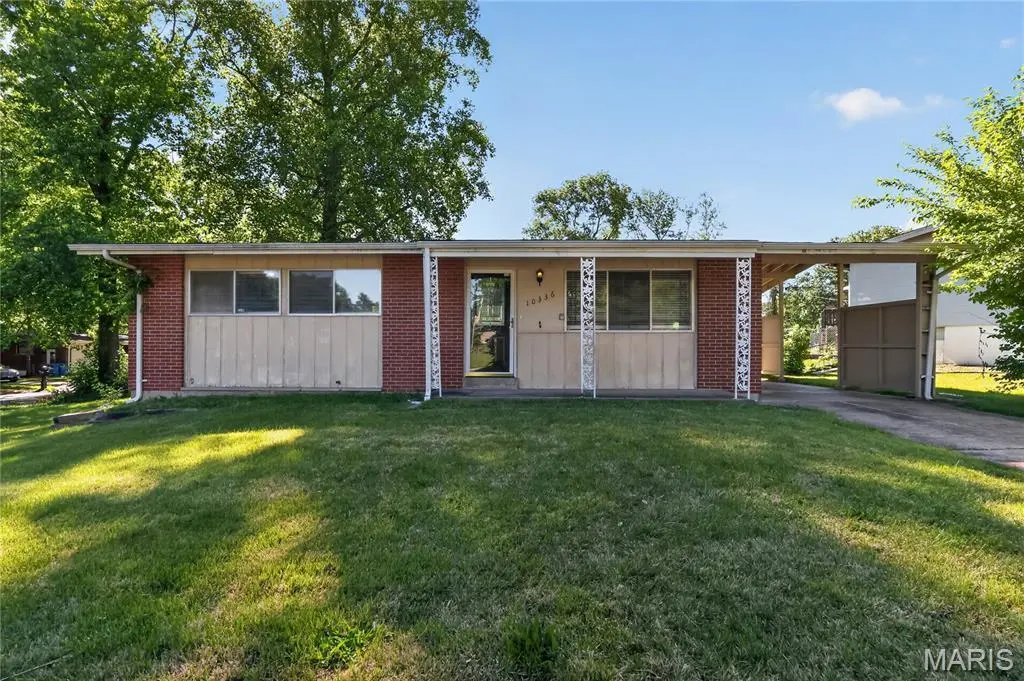
10336 Deem Dr · Dellwood, MO
Flood risk 1/10 · Minimal
- FEMA flood zone
- X (unshaded)
- Chance of flooding over 30 yrs
- 0.0%
- Est. flood insurance / yr
- $473 – $860
Fire risk 1/10 · Minimal
- Est. fire insurance / yr
- $1,054 – $1,958
Heat risk 5/10 · Moderate
- Hot days now (above 107°F)
- 7 days/yr
- Hot days in 30 yrs
- 21 days/yr
Wind risk 2/10 · Minimal
- Chance of severe wind over 30 yrs
- 1.0%
Air-quality risk 3/10 · Minor
- Unhealthy air days now
- 3 days/yr
- Unhealthy air days in 30 yrs
- 5 days/yr
Risk factors via First Street. Map © Google.
Why this score? — see what drove the B+ grade
The composite is a weighted blend of 9 inputs, each scored 0–100. Each bar is that input's sub-score; the figure is the points it added to the 100-point composite (weight × sub-score).
- Cash flow +27.9/30.0
- ARV discount +15.0/15.0
- DSCR +9.9/10.0
- 1% rule +7.7/10.0
- Appreciation +6.9/10.0
- Rent growth +3.7/5.0
- Livability +3.3/5.0
- Condition / age +2.5/5.0
- Schools +0.4/10.0
$104,900
🖨 Deal sheet 📄 Offer letter ✓ Due diligence
Listing remarks MLS
WHAT A DEAL! Cozy home ready for your personal touches. This home features three bedrooms, separate dining, large corner lot nestled in a quiet neighborhood. Basement is partially finished, fully carpeted, sectioned off with extra room, storage/utility room. Close to everything.
Key facts
- 0.26 acre lot
- Parking
- Built 1959
Property features AI
Finance
- Other: Lease not considered
Exterior
- Parking: Carport with 1 space (total parking 1)
- Utilities: Public water; Public sewer; Electric service by Ameren
- Home design: Single-family residence; One story; House with slab foundation
- Construction: Brick construction; Composition roof; Built per public records
- Exterior features: Level lot; Lot dimensions approximately 113 x 111 x 73 x 94
Interior
- Kitchen: Range; Refrigerator
- Bedrooms: 3 bedrooms on the main level
- Flooring: Carpet; Vinyl
- Bathrooms: 1 full bathroom on the main level
- Heating & cooling: Forced air heating; Central air conditioning (electric)
- Interior features: Smoke detectors
Neighborhood map
What this means for you Summary
Snapshot
- This is a 3-bed/1.0-bath single-family listed at $105k.
Deal economics
- At list price, monthly cash flow is $322 ($4k/yr) — positive.
- The deal already cash-flows at list — no discount required.
- Meets the 1% rule at list price ($1k rent vs $105k).
- Recommended offer: $102k (3.0% below list) — sets the bar for market timing.
Location & tenants
- Location reads 66/100 on livability (#239 in MO) — a middle-class / working-renter tenant base. Strengths: cost of living A+, housing A+; Watch: health & safety C-, crime D-, amenities F.
- Riverview Gardens (suburban): math 2% / reading 9% proficiency, ranked #324 of 324 in MO (top 100%) — low school quality limits family demand, transient renter base, plan for 1-2y turnover; 90% free/reduced lunch — lower-income household profile, screen leases tightly.
- Zoned schools: Lemasters Elem. (math 2% / reading 12%, grade F, #1,058 of 1,115 statewide, top 96%, 295 students, 99% FRL); Riverview Gardens Sr. High (math 2% / reading 18%, grade F, #501 of 521 statewide, top 97%, 1,331 students, 100% FRL).
- Market conditions: Rents rising fast (+5.0%/yr); 372 active listings in the ZIP; 40 comparable units currently listed for rent nearby; rentals at typical pace (median 24d on market — plan ~3-4 weeks tenant-placement turnaround); lower-income renter base — watch delinquency; 920 units permitted in St. Louis County in 2024 (250 in 5+ unit buildings).
- This rent runs 39% of the median local income ($41k/yr) — at the standard rent-burdened threshold; future hikes will face affordability resistance.
Forward outlook
- In year one you build about $5k of equity ($725 loan paydown + $4k appreciation (3.8% local appreciation)).
- At projected returns (3.8% appreciation + 5.0% rent growth), your $29k cash investment doubles in ~4 years — after that, you're playing with house money.
- By year 8, paydown + projected appreciation supports a ~$35k cash-out refi (75% LTV) — recoverable capital for the next deal without selling this one.
Negotiation context
- It's been on market 34 days — a 3% lower offer ($102k) is reasonable based on typical stale-listing flexibility.
- 2 sale attempts since 14y ago with the ask held roughly flat each time — persistent listings suggest the price (not the market) is what's stuck; bring a comps-based counter.
Risks & watch-outs
- Watch-outs: built in 1959 — expect roof / HVAC / electrical / plumbing capex.
- Climate carrying-cost: extreme-heat days projected 7→21/yr by 2055 (HVAC capex compounding) — expect insurance premiums to compound above CPI over the hold.
Questions for the listing agent
- It's been on market 34 days. Have you received any prior offers? Is the seller open to a 3% concession, seller financing, or rate buy-down credit?
- Built in 1959 — when were the roof, HVAC, electrical panel, plumbing, and water heater last replaced?
- Is there a deadline driving the sale (1031 exchange, divorce, estate, relocation)? That informs how much negotiation room exists.
- Schools are D-rated, which usually means shorter tenancies and higher turnover. Who's the typical renter profile here, and what's been the actual vacancy rate?
- Crime grade is D in this area — have there been break-ins, vandalism, or insurance claims at this property in the last 3 years? What carrier currently insures it and at what premium?
- What's the average days-on-market for RENTAL listings here right now (not sales)? A rising rental-DOM trend means longer vacancies and softer asking-rent achievability than the comps imply.
- What's the recent tenant-quality profile in this submarket — average credit score on applications, eviction rate, late-payment / NSF rate, and stable-employment percentage? A property-management company in the area should have these aggregated.
- How much new for-sale + rental construction is in the pipeline within 1–3 miles? Heavy new supply typically softens prices + rents 12–24 months out; constrained supply supports both.
Investment metrics
- 1% rule
- 1.27% ✓
- Cap rate
- 9.97%
- Cash-on-cash
- 13.15%
- DSCR
- 1.59
- GRM
- 6.6
CMA / ARV
- ARV (median comp)
- $134,110
- List price
- $104,900
- Delta
- -21.78%
- Verdict
- UNDERPRICED
- Comps
- 20 within 1.0 mi
Show comp detail 12 sales within ~0.75 mi
| Address | Dist | Beds/Ba | Sqft | Sold | Price | $/sf | Match |
|---|---|---|---|---|---|---|---|
| 1923 Nashua Dr | 0.10mi | 3/1.0 | 1,014 (0%) | 1mo | $149,900 | $148 | 94 |
| 10257 Dacey Dr | 0.05mi | 3/1.5 | 1,014 (0%) | 2mo | $120,000 | $118 | 94 |
| 10269 Dacey Dr | 0.02mi | 4/1.0 (+1) | 1,014 (0%) | 1mo | $169,000 | $167 | 94 |
| 1646 Hudson Rd | 0.47mi | 3/1.0 | 1,014 (0%) | 2mo | $164,500 | $162 | 76 |
| 10515 Alliance Dr | 0.52mi | 3/1.0 | 1,014 (0%) | 0mo | $112,900 | $111 | 76 |
| 10418 Quaker Dr | 0.52mi | 3/1.5 | 1,014 (0%) | 2mo | $64,900 | $64 | 72 |
| 10129 Ventura Dr | 0.41mi | 3/2.0 | 1,055 (+4%) | 2mo | $129,900 | $123 | 69 |
| 1716 Atmore Dr | 0.51mi | 3/1.0 | 950 (-6%) | 2mo | $130,000 | $137 | 64 |
| 1715 Hudson Rd | 0.43mi | 2/1.0 (-1) | 1,145 (+13%) | 1mo | $125,000 | $109 | 52 |
| 10228 Viscount Dr | 0.70mi | 3/1.5 | 925 (-9%) | 2mo | $155,000 | $168 | 49 |
| 10719 Trask Dr | 0.65mi | 3/1.0 | 900 (-11%) | 3mo | $143,500 | $159 | 48 |
| 10038 Balboa Dr | 0.61mi | 3/1.0 | 864 (-15%) | 2mo | $49,900 | $58 | 45 |
Match score weights: distance 35% · size 25% · config 20% · recency 20%. Top-matched comps best support the ARV.
Projected returns pro-forma
3.79% appreciation · 4.97% rent growth · sell at horizon
- IRR
- 22.9%
- Equity multiple
- 2.37×
- Total profit
- $40,301
- Equity at exit
- $51,903
- IRR
- 24.2%
- Equity multiple
- 4.87×
- Total profit
- $113,721
- Equity at exit
- $83,885
Cash invested: $29,372 (down + closing). Projections, not guarantees.
Landlord ↔ Tenant lean methodology
- Overall (STATE)
- 81 Strongly Landlord-Friendly
- State Missouri
- 81 Strongly Landlord-Friendly · R+10
- County
- — inherits STATE
- City
- — inherits STATE
ZIP-level market 63136
- Home prices YoY
- 0.9%
- Rents YoY
- 5.0%
- Active inventory
- 372
- Price-to-rent
- 6.6×
Monthly cashflow live
- Estimated rent
- $1,331 high interval (Pro) →
- Mortgage (P&I)
- −$550
- Tax from tax record
- −$136 /mo · $1,632/yr
- Insurance
- −$44
- HOA
- −$0
- Vacancy / Maint / Mgmt
- −$280
- Net cashflow
- $322
Break-even live
UW: 25.0% down · 7.5% · 30yr · 1.5% tax · 5.0% vac · 8.0% maint · 8.0% mgmt
Financing live
Cash to close
- Down payment
- $26,225
- Closing costs
- $3,147
- Reserves months
- —
- Total cash needed
- —
Loan-product check · same deal, 3 products live
Conventional
25% down · 7.5% · 30yr
- Down + closing
- —
- Monthly P&I
- —
- Monthly cashflow
- —
- DSCR
- —
- Eligible?
- —
Personal DTI + credit; lowest rate.
DSCR
20% down · 8.5% · 30yr
- Down + closing
- —
- Monthly P&I
- —
- Monthly cashflow
- —
- DSCR
- —
- Eligible?
- —
No personal income docs; deal must DSCR.
Hard money
10% down · 12.0% · 12mo
- Down + closing
- —
- Monthly P&I
- —
- Monthly cashflow
- —
- DSCR
- —
- Eligible?
- —
Short-term bridge; refi at stabilization.
Rent comps 40 comps
| Address | Beds | Baths | Sqft | Rent | $/sqft | DOM | Units | Dist |
|---|---|---|---|---|---|---|---|---|
| 62 Capitol Hill Dr Saint Louis, MO | 3.0 | 2.0 | 1239 | $1,250 | $1.01 | 43d | 1 | 0.09mi |
| 10239 Green Valley Dr Saint Louis, MO | 3.0 | 1.0 | 1014 | $1,395 | $1.38 | 23d | 1 | 0.16mi |
| 10304 Bon Oak Dr Saint Louis, MO | 3.0 | 1.5 | 1500 | $1,250 | $0.83 | 43d | 1 | 0.29mi |
| 10124 Winkler Dr Saint Louis, MO | 2.0 | 1.0 | 792 | $1,400 | $1.77 | 2d | 1 | 0.43mi |
| 10128 Cloverdale Dr Saint Louis, MO | 2.0 | 1.0 | 792 | $1,000 | $1.26 | 23d | 1 | 0.45mi |
| 10128 Cloverdale Dr Saint Louis, MO | 2.0 | 1.0 | 792 | $1,000 | $1.26 | 43d | 1 | 0.45mi |
| 10129 Cavalier Ct Saint Louis, MO | 3.0 | 1.5 | 912 | $1,250 | $1.37 | 23d | 1 | 0.50mi |
| 10078 Green Valley Dr Saint Louis, MO | 3.0 | 1.0 | 900 | $1,325 | $1.47 | 7d | 1 | 0.52mi |
| 1547 Babcock Dr Saint Louis, MO | 3.0 | 1.0 | 1014 | $1,480 | $1.46 | 43d | 1 | 0.65mi |
| 2259 Ainsworth Dr Saint Louis, MO | 4.0 | 2.0 | 1500 | $1,776 | $1.18 | 43d | 1 | 0.67mi |
| 1654 Mowbry Ln Saint Louis, MO | 3.0 | 1.0 | 936 | $1,300 | $1.39 | 23d | 1 | 0.67mi |
| 10329 Chesley Dr Saint Louis, MO | 3.0 | 1.0 | 1014 | $1,350 | $1.33 | 23d | 1 | 0.72mi |
| 1926 Chambers Rd Saint Louis, MO | 4.0 | 1.0 | 1095 | $995 | $0.91 | 14d | 1 | 0.75mi |
| 10322 Monarch Dr Saint Louis, MO | 3.0 | 2.0 | 1073 | $1,728 | $1.61 | 23d | 1 | 0.79mi |
| 2257 Luxmore Dr Saint Louis, MO | 3.0 | 3.0 | 1073 | $1,495 | $1.39 | 23d | 1 | 0.79mi |
| 10504 Baron Dr Saint Louis, MO | 3.0 | 1.0 | 1000 | $1,300 | $1.30 | 7d | 1 | 0.84mi |
| 10409 Count Dr Saint Louis, MO | 3.0 | 1.0 | 912 | $1,100 | $1.21 | 21d | 1 | 0.87mi |
| 10512 Count Dr Saint Louis, MO | 3.0 | 1.0 | 888 | $1,195 | $1.35 | 14d | 1 | 0.90mi |
| 9868 Lorna Ln Saint Louis, MO | 3.0 | 1.0 | 1032 | $1,175 | $1.14 | 43d | 1 | 0.91mi |
| 10365 Lord Dr Saint Louis, MO | 3.0 | 1.0 | 864 | $1,075 | $1.24 | 1d | 1 | 0.93mi |
| 9827 Winkler Dr Saint Louis, MO | 3.0 | 1.0 | 864 | $1,450 | $1.68 | 7d | 1 | 0.93mi |
| 9840 Medford Dr Saint Louis, MO | 3.0 | 1.0 | 912 | $1,095 | $1.20 | 43d | 1 | 0.93mi |
| 9823 Winkler Dr Saint Louis, MO | 2.0 | 1.0 | 788 | $900 | $1.14 | 43d | 1 | 0.94mi |
| 1733 Kappel Ave Saint Louis, MO | 3.0 | 1.0 | 912 | $1,250 | $1.37 | 23d | 1 | 0.96mi |
| 10113 Count Dr Saint Louis, MO | 2.0 | 1.0 | 882 | $775 | $0.88 | 43d | 1 | 0.96mi |
| 9812 Balboa Dr Saint Louis, MO | 4.0 | 2.0 | 1500 | $1,495 | $1.00 | 21d | 1 | 0.97mi |
| 13061 Lord Dr St. Louis, MO | 2.0 | 1.0 | 900 | $1,040 | $1.16 | 21d | 1 | 0.97mi |
| 9839 Medford Dr Saint Louis, MO | 3.0 | 1.0 | 912 | $1,095 | $1.20 | 43d | 1 | 0.97mi |
| 2257 Chambers Rd Saint Louis, MO | 3.0 | 1.0 | 1200 | $1,400 | $1.17 | 23d | 1 | 0.98mi |
| 10112 Count Dr Saint Louis, MO | 2.0 | 1.0 | 792 | $1,000 | $1.26 | 7d | 1 | 0.99mi |
| 10404 Earl Dr Saint Louis, MO | 2.0 | 1.0 | 770 | $1,100 | $1.43 | 3d | 1 | 1.01mi |
| 9850 Dennis Dr Saint Louis, MO | 2.0 | 1.0 | 1032 | $1,175 | $1.14 | 43d | 1 | 1.02mi |
| 2745 Rottingdean Dr St. Louis, MO | 1.0–2.0 | 1.0 | 825 | $975 | $1.18 | 43d | 1 | 1.02mi |
| 10501 Duke Dr Saint Louis, MO | 2.0 | 1.0 | 1140 | $1,090 | $0.96 | 43d | 1 | 1.05mi |
| 2008 Kappel Dr Saint Louis, MO | 3.0 | 1.0 | 858 | $1,175 | $1.37 | 23d | 1 | 1.05mi |
| 9845 Dennis Dr Saint Louis, MO | 3.0 | 1.0 | 960 | $1,550 | $1.61 | 12d | 1 | 1.05mi |
| 9709 Balboa Dr Saint Louis, MO | 3.0 | 1.0 | 1000 | $1,600 | $1.60 | 43d | 1 | 1.08mi |
| 2326 Chambers Rd Saint Louis, MO | 2.0 | 1.0 | 1056 | $1,050 | $0.99 | 23d | 1 | 1.10mi |
| 2544 Netherton Dr Saint Louis, MO | 3.0 | 2.0 | 1288 | $1,945 | $1.51 | 1d | 1 | 1.11mi |
| 10113 Duke Dr Saint Louis, MO | 3.0 | 1.0 | 770 | $1,325 | $1.72 | 43d | 1 | 1.13mi |
Listing history 22 events
-
2026-06-18days on market $104,900 Active 34 DOM
-
2026-06-17days on market $104,900 Active 33 DOM
-
2026-06-16days on market $104,900 Active 32 DOM
-
2026-06-15days on market $104,900 Active 31 DOM
-
2026-06-13days on market $104,900 Active 29 DOM
-
2026-06-13days on market $104,900 Active 28 DOM
-
2026-06-09days on market $104,900 Active 25 DOM
-
2026-06-08days on market $104,900 Active 24 DOM
-
2026-06-07days on market $104,900 Active 23 DOM
-
2026-06-05days on market $104,900 Active 20 DOM
-
2026-06-03days on market $104,900 Active 19 DOM
-
2026-06-02days on market $104,900 Active 18 DOM
-
2026-06-01days on market $104,900 Active 17 DOM
-
2026-05-31days on market $104,900 Active 16 DOM
-
2026-05-15$104,900 Active 420-char remark
-
2015-09-01soldstatus $15,382,732
-
2013-01-04soldstatus 279-char remark
Show marketing remark (279 chars)
WHAT A DEAL! Cozy home ready for your personal touches. This home features three bedrooms, separate dining, large corner lot nestled in a quiet neighborhood. Basement is partially finished, fully carpeted, sectioned off with extra room, storage/utility room. Close to everything.
-
2012-11-02$24,000 279-char remark
Show marketing remark (279 chars)
WHAT A DEAL! Cozy home ready for your personal touches. This home features three bedrooms, separate dining, large corner lot nestled in a quiet neighborhood. Basement is partially finished, fully carpeted, sectioned off with extra room, storage/utility room. Close to everything.
-
1995-09-13soldstatus $57,000
-
1989-05-01soldstatus $25,000
-
1989-05-01soldstatus
-
1988-11-01soldstatus $40,090
ⓘ Source: listings_history table (triggers on properties + properties_extension) + one-shot
backfill from property_details.listing_events for pre-trigger history.
Tax reassessment forecast MO · Resets to sale price
- Current annual tax
- $1,632 · $136/mo
- Projected year-2 tax
- $1,632 · $136/mo
- Expected delta
- $0/yr ($0/mo · 0.0%)
ⓘ Screening estimate from a state-policy table — verify with the county assessor before closing.
Climate risk First Street
- Flood 1/10 Low FEMA zone X (unshaded) · 0% chance over 30 yrs
- Wildfire 1/10 Low
- Heat 5/10 Major 7 d/yr ≥107°F today · 21 d/yr by 30 yrs out
- Wind 2/10 Low 100% chance of damaging wind over 30 yrs
- Air quality 3/10 Moderate 3 unhealthy d/yr today · 5 by 30 yrs out
Nearby sold comps map
Loading sold comps map…
Walkable amenities ~0.75 mi
Loading nearby amenities…
Taxation est. · year 1
- Rental income
- $15,975
- − Mortgage interest
- −$5,876
- − Property taxes
- −$1,632
- − Insurance
- −$524
- − Repairs & maintenance
- −$1,278
- − Management
- −$1,278
- − Depreciation
- −$3,052
- Taxable income
- $2,335
- Est. tax owed @ 24.0%
- −$560
- After-tax cash flow
- $3,302/yr
For passive investors: Depreciation is non-cash, so a rental often shows a tax loss while cash-flowing — sheltering income. Rental losses are passive: they offset passive income freely, and up to $25,000/yr can offset ordinary (W-2) income if you actively participate and your MAGI is under $100k (phasing out to $0 by $150k); unused losses carry forward. On sale, claimed depreciation is recaptured at up to 25%, and gains may owe capital-gains tax (a 1031 exchange can defer both). Figures are a year-1 estimate at your 24.0% rate — not tax advice; consult a CPA.
Schools (NCES district)
- District
- Riverview Gardens
- NCES district ID
- 2926670
- Math proficiency
- 2% ▼ -6.00%
- Reading proficiency
- 9% ▼ -6.00%
- Median HH income
- $32,759
- Composite
- 4.22/100
- National rank
- #10058
- State rank
- #324 of 324 in MO
Livability — Dellwood
- Score
- 66/100
- State rank
- #239
- US rank
- #11618
Category grades
Schools grade is shown separately in the Schools card above.
Census & demographics
- Census place
- Dellwood, MO
- County
- Saint Louis County · 888,823 people
- Metro
- St. Louis, MO-IL
- Population (ZIP)
- 40,929
- Household income
- $41,154
- Rent vs Own
- Severe rent burden
- 3085.0
Population outlook (St. Louis County) Hauer SSP2
- Today (2025)
- 1,025,227 people
- By 2030
- 1,028,023 · +0.3%
- By 2040
- 1,020,940 · -0.4%
- By 2050
- 1,007,280 · -1.8%
- By 2075
- 987,277 · -3.7%
- By 2100
- 921,984 · -10.1%
Race, ethnicity, and origin ACS 2023
- Neighborhood character
- Predominantly Black (90%)
- Race & ethnicity
- Black 90% White 5% Two or more races 3%
- Foreign-born
- 1% · Canada
Political lean MEDSL · St. Louis
- 2024 margin
- Strong D (+23.4) · D 60.8% · R 37.4% · Other 1.7%
- 2008→2024 swing
- +3.5pp toward D · 2008: 19.9pp · 2024: 23.4pp
- All cycles
- 2024: D+23.4 2020: D+24.0 2016: D+16.2 2012: D+13.7 2008: D+19.9
Not yet ingested
- Civics
- —
Market trends
- HPI YoY
- ▲ 3.79%
- Current HPI
- 420.28
- Rent YoY
- ▲ 4.97%
- Metro
- St. Louis, MO-IL
- State GDP YoY
- ▲ 1.84%
- F500 in state
- 20
Industry mix (Fortune 500 HQ in MO)
| Industry | F500 HQs | Revenue |
|---|---|---|
| Healthcare | 1 | $163B |
|
||
| Insurance | 1 | $21B |
|
||
| Industrial Technology | 1 | $17B |
|
||
| Retail | 1 | $16B |
|
||
| Industrial Distribution | 1 | $10B |
|
||
| Utilities | 1 | $9B |
|
||
Price history
+161.7% since first listed8 events — show timeline
- 2026-05-15 Listed $104,900 MARIS as Distributed by MLS Grid
- 2015-09-01 Sold (Public Records) $15,382,732 Public Records
- 2013-01-04 Sold (MLS) — MARIS as Distributed by MLS Grid
- 2012-11-02 Listed $24,000 MARIS as Distributed by MLS Grid
- 1995-09-13 Sold (Public Records) $57,000 Public Records
- 1989-05-01 Sold (Public Records) — Public Records
- 1989-05-01 Sold (Public Records) $25,000 Public Records
- 1988-11-01 Sold (Public Records) $40,090 Public Records
Property tax history
+7.6%/yrLatest (2022): $1,632 · +0.4% YoY. Source: county tax records.
Cash-flow waterfall
monthlySold comps — $/sqft
last 12 mo · ≤1 miLoading sold comps…