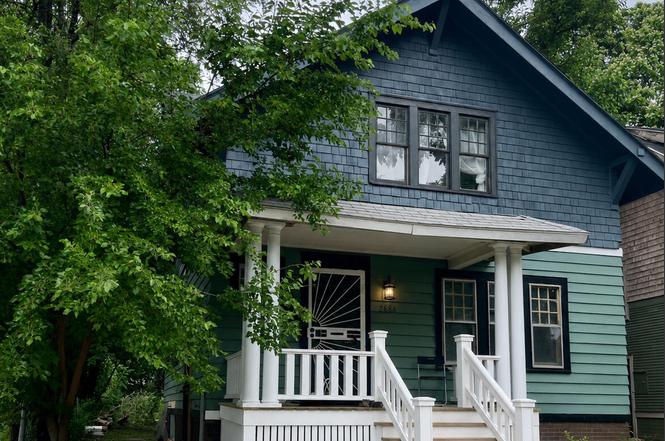
2686 Vicksburg St · Detroit, MI
Flood risk 4/10 · Minor
- FEMA flood zone
- X (unshaded)
- Chance of flooding over 30 yrs
- 0.2%
- Est. flood insurance / yr
- $507 – $1,088
Fire risk 1/10 · Minimal
- Est. fire insurance / yr
- $784 – $1,456
Heat risk 3/10 · Minor
- Hot days now (above 97°F)
- 7 days/yr
- Hot days in 30 yrs
- 15 days/yr
Wind risk 2/10 · Minimal
- Chance of severe wind over 30 yrs
- —
Air-quality risk 4/10 · Minor
- Unhealthy air days now
- 4 days/yr
- Unhealthy air days in 30 yrs
- 6 days/yr
Risk factors via First Street. Map © Google.
Why this score? — see what drove the D+ grade
The composite is a weighted blend of 9 inputs, each scored 0–100. Each bar is that input's sub-score; the figure is the points it added to the 100-point composite (weight × sub-score).
- Cash flow +21.8/30.0
- DSCR +7.0/10.0
- 1% rule +5.4/10.0
- Rent growth +3.8/5.0
- Livability +3.7/5.0
- Condition / age +2.5/5.0
- Schools +1.3/10.0
- ARV discount +0.0/15.0
- Appreciation +0.0/10.0
$138,500
🖨 Deal sheet (PDF) 📄 Offer letter ✓ Due diligence
Listing remarks MLS
Check out this beautifully renovated, charming Detroit home just blocks from La Salle Gardens! Featuring 3 beds and 2 full baths, this property blends historic charm with modern updates like original hardwood floors, brand-new plumbing lines to the street, and updated neighborhood gas lines. The stunning open-concept kitchen showcases salvaged leathered marble from an iconic Detroit building, flowing into a bright living area and a flexible den/office space. The main floor also boasts a welcoming foyer, a full bath with a monochrome tiled shower, historic brick fireplace, and a bonus laundry/storage room. Upstairs, find 3 spacious bedrooms with massive walk-in closets and a second full bath with a classic clawfoot tub. Perfectly located within walking distance to Moon Dog Cafe and just 5-10 minutes from New Center and Wayne State University!Property is agent owned.
Key facts
- Renovated
- Open-concept kitchen
- 3,920 sq ft lot
Tags
Property features AI
Exterior
- Utilities: Public water; Natural gas available; Electricity available
- Home design: Traditional single-family residence; Built in 1916
- Construction: Wood siding; Asphalt roof; Living area approximately 1,089 sq ft
- Exterior features: Sidewalk; Paved road access
Interior
- Kitchen: Kitchen (approximately 13 x 13); Oven; Refrigerator
- Bedrooms: Primary bedroom (approximately 11.6 x 11.5); Bedroom 2 (approximately 10.8 x 11.6); Bedroom 3 (approximately 10.2 x 11.5)
- Bathrooms: 2 full bathrooms
- Heating & cooling: Forced air heating; Window cooling units
- Interior features: Pantry; Michigan-style basement; 13 total rooms
- Laundry & utility: Washer; Dryer; Electric water heater
Neighborhood map
What this means for you Summary
Snapshot
- This is a 3-bed/1.0-bath single-family listed at $138k.
Deal economics
- At list price, monthly cash flow is $217 ($3k/yr) — positive.
- The deal already cash-flows at list — no discount required.
- Meets the 1% rule at list price ($1k rent vs $138k).
Location & tenants
- Location reads 73/100 on livability (#218 in MI) — a middle-class / working-renter tenant base. Strengths: amenities A+, commute A+, cost of living A+; Watch: schools F, crime F, employment F.
- Detroit Public Schools Community District (urban): math 10% / reading 24% proficiency, ranked #499 of 540 in MI (top 92%) — low school quality limits family demand, transient renter base, plan for 1-2y turnover; 90% free/reduced lunch — lower-income household profile, screen leases tightly.
- Market conditions: Rents rising fast (+5.2%/yr); 273 active listings in the ZIP; 40 comparable units currently listed for rent nearby; rentals at typical pace (median 25d on market — plan ~3-4 weeks tenant-placement turnaround); 42% of comp listings sitting > 30 days — soft ceiling on asking rent; 2,639 units permitted in Wayne County in 2024 (1,216 in 5+ unit buildings).
- This rent runs 39% of the median local income ($45k/yr) — at the standard rent-burdened threshold; future hikes will face affordability resistance.
Forward outlook
- Local home prices are declining (-3.0%/yr); year-one equity from $958 of loan paydown is wiped out by about $4k of value loss. Plan a longer hold.
- Wayne County population projected at -17% by 2050 — secular population decline; favor cash flow + early exit over multi-decade hold.
Negotiation context
- Only 8 days on market — expect competitive offers; lowballing is unlikely to land.
- 3 sale attempts with the ask held roughly flat each time — persistent listings suggest the price (not the market) is what's stuck; bring a comps-based counter.
Risks & watch-outs
- Watch-outs: built in 1916 — expect roof / HVAC / electrical / plumbing capex.
Questions for the listing agent
- Built in 1916 — when were the roof, HVAC, electrical panel, plumbing, and water heater last replaced?
- Is there a deadline driving the sale (1031 exchange, divorce, estate, relocation)? That informs how much negotiation room exists.
- Schools are F-rated, which usually means shorter tenancies and higher turnover. Who's the typical renter profile here, and what's been the actual vacancy rate?
- Crime grade is F in this area — have there been break-ins, vandalism, or insurance claims at this property in the last 3 years? What carrier currently insures it and at what premium?
- The area grade is low — what's the realistic commute time and amenity access for the typical tenant pool here? Any planned neighborhood developments (good or bad) we should know about?
- What's the average days-on-market for RENTAL listings here right now (not sales)? A rising rental-DOM trend means longer vacancies and softer asking-rent achievability than the comps imply.
- What's the recent tenant-quality profile in this submarket — average credit score on applications, eviction rate, late-payment / NSF rate, and stable-employment percentage? A property-management company in the area should have these aggregated.
- How much new for-sale + rental construction is in the pipeline within 1–3 miles? Heavy new supply typically softens prices + rents 12–24 months out; constrained supply supports both.
Investment metrics
- 1% rule
- 1.04% ✓
- Cap rate
- 8.17%
- Cash-on-cash
- 6.70%
- DSCR
- 1.30
- GRM
- 8.0
CMA / ARV
- ARV (on-the-fly)
- $112,167
- Comps found
- 12
Show comp detail 12 sales within ~0.75 mi
| Address | Dist | Beds/Ba | Sqft | Sold | Price | $/sf | Match |
|---|---|---|---|---|---|---|---|
| 2637 Carter St | 0.31mi | 3/1.0 | 1,092 (+0%) | 11mo | $86,000 | $79 | 76 |
| 3005 Lothrop St | 0.41mi | 3/1.0 | 1,200 (+10%) | 2mo | $48,900 | $41 | 62 |
| 3208 Carter St | 0.41mi | 3/1.0 | 1,179 (+8%) | 20mo | $45,000 | $38 | 51 |
| 1669 W Philadelphia St | 0.71mi | 3/1.5 | 1,162 (+7%) | 16mo | $205,000 | $176 | 40 |
| 1674 W Euclid St | 0.70mi | 3/1.5 | 1,026 (-6%) | 20mo | $193,500 | $189 | 39 |
| 7427 Dunedin St | 0.58mi | 3/1.0 | 1,243 (+14%) | 13mo | $160,000 | $129 | 38 |
| 6080 16th St | 0.73mi | 3/1.0 | 1,160 (+6%) | 23mo | $119,000 | $103 | 36 |
| 6200 15th St | 0.64mi | 2/2.0 (-1) | 1,194 (+10%) | 18mo | $275,000 | $230 | 30 |
| 4010 HAZELWOOD St | 0.71mi | 2/2.0 (-1) | 1,206 (+11%) | 14mo | $80,500 | $67 | 28 |
| 4010 Hazelwood St | 0.71mi | 2/2.0 (-1) | 1,206 (+11%) | 14mo | $80,500 | $67 | 28 |
| 9242 Genessee St | 0.65mi | 3/1.0 | 1,248 (+15%) | 23mo | $61,902 | $50 | 26 |
| 2681 Nebraska St | 0.59mi | 4/2.5 (+1) | 1,238 (+14%) | 20mo | $189,700 | $153 | 22 |
Match score weights: distance 35% · size 25% · config 20% · recency 20%. Top-matched comps best support the ARV.
Projected returns pro-forma
-3.0% appreciation · 5.2% rent growth · sell at horizon
- IRR
- -3.6%
- Equity multiple
- 0.86×
- Total profit
- $-5,373
- Equity at exit
- $20,651
- IRR
- 8.4%
- Equity multiple
- 1.70×
- Total profit
- $27,145
- Equity at exit
- $11,975
Cash invested: $38,780 (down + closing). Projections, not guarantees.
Landlord ↔ Tenant lean methodology
- Overall (STATE)
- 62 Landlord-Friendly
- State Michigan
- 62 Landlord-Friendly · EVEN
- County
- — inherits STATE
- City
- — inherits STATE
ZIP-level market 48206
- Rents YoY
- 5.2%
- Active inventory
- 273
- Price-to-rent
- 8.0×
Monthly cashflow live
- Estimated rent
- $1,447 high interval (Pro) →
- Mortgage (P&I)
- −$726
- Tax from tax record
- −$142 /mo · $1,708/yr
- Insurance
- −$58
- HOA
- −$0
- Vacancy / Maint / Mgmt
- −$304
- Net cashflow
- $217
Break-even live
Sensitivity live
| Price | -10% $295 | -5% $256 | +0% $217 | +5% $177 | +10% $138 |
|---|---|---|---|---|---|
| Rent | -10% $102 | -5% $159 | +0% $217 | +5% $274 | +10% $331 |
| Rate | -1.0pp $286 | -0.5pp $252 | base $217 | +0.5pp $181 | +1.0pp $144 |
UW: 25.0% down · 7.5% · 30yr · 1.5% tax · 5.0% vac · 8.0% maint · 8.0% mgmt
Financing live
Cash to close
- Down payment
- $34,625
- Closing costs
- $4,155
- Reserves months
- —
- Total cash needed
- —
Loan-product check · same deal, 3 products live
Conventional
25% down · 7.5% · 30yr
- Down + closing
- —
- Monthly P&I
- —
- Monthly cashflow
- —
- DSCR
- —
- Eligible?
- —
Personal DTI + credit; lowest rate.
DSCR
20% down · 8.5% · 30yr
- Down + closing
- —
- Monthly P&I
- —
- Monthly cashflow
- —
- DSCR
- —
- Eligible?
- —
No personal income docs; deal must DSCR.
Hard money
10% down · 12.0% · 12mo
- Down + closing
- —
- Monthly P&I
- —
- Monthly cashflow
- —
- DSCR
- —
- Eligible?
- —
Short-term bridge; refi at stabilization.
Rent comps 40 comps
| Address | Beds | Baths | Sqft | Rent | $/sqft | DOM | Units | Dist |
|---|---|---|---|---|---|---|---|---|
| 2504 W Euclid St Unit 2504 Detroit, MI | 3.0 | 1.0 | 1475 | $1,650 | $1.12 | 44d | 1 | 0.21mi |
| 2506 W Euclid St Detroit, MI | 3.0 | 1.0 | 1475 | $1,675 | $1.14 | 44d | 1 | 0.21mi |
| 2504 W Euclid St Unit 2506 Detroit, MI | 3.0 | 1.0 | 1475 | $1,675 | $1.14 | 44d | 1 | 0.21mi |
| 2531 Pingree St Unit 2 (FL 2) Detroit, MI | 3.0 | 1.0 | 893 | $1,100 | $1.23 | 3d | 1 | 0.28mi |
| 3259 W Philadelphia St Detroit, MI | 3.0 | 1.0 | 1293 | $1,400 | $1.08 | 17d | 1 | 0.35mi |
| 2047 Seward St Detroit, MI | 3.0 | 1.0 | 1421 | $1,523 | $1.07 | 5d | 1 | 0.45mi |
| 3220 Gladstone St Detroit, MI | 3.0 | 1.0 | 1248 | $1,200 | $0.96 | 44d | 1 | 0.49mi |
| 1974 Virginia Park St Detroit, MI | 2.0 | 2.0 | 1200 | $1,995 | $1.66 | 44d | 1 | 0.53mi |
| 2021 Blaine St Detroit, MI | 1.0–2.0 | 1.0 | 684 | $1,200 | $1.75 | 44d | 1 | 0.53mi |
| 2463 Taylor St Detroit, MI | 3.0 | 1.0 | 1350 | $1,100 | $0.81 | 44d | 1 | 0.54mi |
| 3757 Blaine St Detroit, MI | 3.0 | 1.0 | 1169 | $1,480 | $1.27 | 17d | 1 | 0.56mi |
| 4016 Hogarth St Unit 4018 Hogarth Lower Detroit, MI | 2.0 | 1.0 | 1200 | $1,100 | $0.92 | 4d | 1 | 0.60mi |
| 3786 Carter St Unit 2 Detroit, MI | 3.0 | 1.0 | 1400 | $1,100 | $0.79 | 25d | 1 | 0.62mi |
| 6144 16th St Detroit, MI | 3.0 | 1.0 | 1284 | $1,200 | $0.93 | 44d | 1 | 0.63mi |
| 2254 Taylor St Unit Taylor St unit Detroit, MI | 3.0 | 1.0 | 1307 | $1,550 | $1.19 | 4d | 1 | 0.64mi |
| 1710 Virginia Park St Detroit, MI | 2.0 | 2.0 | 1350 | $1,300 | $0.96 | 5d | 1 | 0.66mi |
| 6077 Linwood St Detroit, MI | 2.0 | 1.0 | 1200 | $2,000 | $1.67 | 44d | 1 | 0.68mi |
| 1800 W Bethune St Unit 1228665P Detroit, MI | 2.0 | 1.0 | 904 | $3,135 | $3.47 | 44d | 1 | 0.68mi |
| 1800 W Bethune St Detroit, MI | 2.0 | 1.0 | 656 | $1,645 | $2.51 | 25d | 3 | 0.69mi |
| 1800 W Bethune St Detroit, MI | 2.0 | 1.0 | 800 | $1,850 | $2.31 | 44d | 1 | 0.69mi |
| 4345 W Euclid St Unit 1 Detroit, MI | 3.0 | 1.0 | 1300 | $1,400 | $1.08 | 25d | 1 | 0.72mi |
| 4345 W Euclid St Unit 2 Detroit, MI | 3.0 | 1.0 | 1300 | $1,450 | $1.12 | 25d | 1 | 0.72mi |
| 7640 Woodrow Wilson St Unit 1 Detroit, MI | 3.0 | 1.5 | 1095 | $1,400 | $1.28 | 44d | 1 | 0.77mi |
| 7340 Churchill St Unit 2 Detroit, MI | 2.0 | 1.0 | 1046 | $1,100 | $1.05 | 25d | 1 | 0.77mi |
| 3759 Atkinson St Unit 2 Detroit, MI | 2.0 | 1.0 | 919 | $1,200 | $1.31 | 25d | 1 | 0.80mi |
| 1542 W Euclid St Detroit, MI | 2.0 | 1.0 | 1100 | $1,150 | $1.05 | 5d | 1 | 0.81mi |
| 1534 W Euclid St Detroit, MI | 2.0 | 1.0 | 1200 | $1,150 | $0.96 | 13d | 1 | 0.81mi |
| 1534 W Euclid St Unit 1534 Euclid Detroit, MI | 2.0 | 1.0 | 1200 | $1,150 | $0.96 | 44d | 1 | 0.82mi |
| 1626 Gladstone St Unit 1 Detroit, MI | 2.0 | 1.0 | 800 | $1,300 | $1.62 | 44d | 1 | 0.84mi |
| 1628 Gladstone St Unit 2 Detroit, MI | 2.0 | 1.0 | 800 | $1,050 | $1.31 | 44d | 1 | 0.84mi |
| 3422 Edison St Detroit, MI | 3.0 | 1.0 | 1300 | $1,295 | $1.00 | 17d | 1 | 0.84mi |
| 1400 Seward Ave Unit 305 Detroit, MI | 2.0 | 1.0 | 950 | $1,295 | $1.36 | 3d | 1 | 0.87mi |
| 1400 Seward Ave Detroit, MI | 2.0 | 1.0 | 950 | $1,295 | $1.36 | 5d | 1 | 0.87mi |
| 1400 Seward Ave Unit 305 Detroit, MI | 2.0 | 1.0 | 950 | $1,295 | $1.36 | 5d | 1 | 0.87mi |
| 6183 Hecla St Detroit, MI | 3.0 | 1.0 | 1100 | $1,700 | $1.55 | 25d | 1 | 0.87mi |
| 4566 Seebaldt St Detroit, MI | 2.0 | 1.0 | 1200 | $1,250 | $1.04 | 22d | 1 | 0.94mi |
| 3295 Rochester St Unit 2 Detroit, MI | 2.0 | 1.0 | 800 | $1,000 | $1.25 | 5d | 1 | 0.96mi |
| 3295 Rochester St Unit 2 Detroit, MI | 2.0 | 1.0 | 782 | $850 | $1.09 | 44d | 1 | 0.96mi |
| 8263 Merrill St Detroit, MI | 2.0 | 1.5 | 1092 | $1,600 | $1.47 | 44d | 1 | 0.97mi |
| 4915 Maplewood St Detroit, MI | 3.0 | 1.0 | 1324 | $1,100 | $0.83 | 17d | 1 | 0.97mi |
Listing history 8 events
-
2026-06-21statusdays on market $138,500 Pending 8 DOM
-
2026-06-18days on market $138,500 Active 7 DOM
-
2026-06-17days on market $138,500 Active 6 DOM
-
2026-06-16days on market $138,500 Active 5 DOM
-
2026-06-15days on market $138,500 Active 4 DOM
-
2026-06-13days on market $138,500 Active 2 DOM
-
2026-06-13remarks 699-char remark
-
2026-06-13$138,500 Active 1 DOM
ⓘ Source: listings_history table (triggers on properties + properties_extension) + one-shot
backfill from property_details.listing_events for pre-trigger history.
Tax reassessment forecast MI · Partial reset (capped growth)
- Current annual tax
- $1,708 · $142/mo
- Projected year-2 tax
- $1,921 · $160/mo
- Expected delta
- +$212/yr (+$18/mo · 12.4%)
ⓘ Screening estimate from a state-policy table — verify with the county assessor before closing.
Climate risk First Street
- Flood 4/10 Moderate FEMA zone X (unshaded) · 20% chance over 30 yrs
- Wildfire 1/10 Low
- Heat 3/10 Moderate 7 d/yr ≥97°F today · 15 d/yr by 30 yrs out
- Wind 2/10 Low
- Air quality 4/10 Moderate 4 unhealthy d/yr today · 6 by 30 yrs out
Nearby sold comps map
Loading sold comps map…
Walkable amenities ~0.75 mi
Loading nearby amenities…
Taxation est. · year 1
- Rental income
- $17,361
- − Mortgage interest
- −$7,758
- − Property taxes
- −$1,708
- − Insurance
- −$692
- − Repairs & maintenance
- −$1,389
- − Management
- −$1,389
- − Depreciation
- −$4,029
- Taxable income
- $396
- Est. tax owed @ 24.0%
- −$95
- After-tax cash flow
- $2,504/yr
For passive investors: Depreciation is non-cash, so a rental often shows a tax loss while cash-flowing — sheltering income. Rental losses are passive: they offset passive income freely, and up to $25,000/yr can offset ordinary (W-2) income if you actively participate and your MAGI is under $100k (phasing out to $0 by $150k); unused losses carry forward. On sale, claimed depreciation is recaptured at up to 25%, and gains may owe capital-gains tax (a 1031 exchange can defer both). Figures are a year-1 estimate at your 24.0% rate — not tax advice; consult a CPA.
Schools (NCES district)
- District
- Detroit Public Schools Community District
- NCES district ID
- 2601103
- Math proficiency
- 10% ▼ -2.00%
- Reading proficiency
- 24% ▲ 6.00%
- Median HH income
- $25,815
- Composite
- 13.06/100
- National rank
- #9564
- State rank
- #499 of 540 in MI
Livability — Detroit
- Score
- 73/100
- State rank
- #218
- US rank
- #5427
Category grades
Schools grade is shown separately in the Schools card above.
Census & demographics
- Census place
- Detroit, MI
- County
- Wayne County · 1,562,939 people
- City population
- 572,865
- Metro
- Detroit-Warren-Dearborn, MI
- Population (ZIP)
- 15,227
- Household income
- $45,046
- Rent vs Own
- Severe rent burden
- 646.0
Population outlook (Wayne County) Hauer SSP2
- Today (2025)
- 1,675,273 people
- By 2030
- 1,620,300 · -3.3%
- By 2040
- 1,502,341 · -10.3%
- By 2050
- 1,384,039 · -17.4%
- By 2075
- 1,124,592 · -32.9%
- By 2100
- 881,193 · -47.4%
Race, ethnicity, and origin ACS 2023
- Neighborhood character
- Predominantly Black (81%)
- Race & ethnicity
- Black 81% White 12% Two or more races 5% Hispanic / Latino 3%
- Common ancestry
- Iranian 3% Romanian 1% Slovak 1%
- Foreign-born
- 4% · Canada
- Languages at home
- 94% English-only · Spanish 4% Other Indo-European 1%
Political lean MEDSL · Wayne
- 2024 margin
- Strong D (+29.0) · D 62.7% · R 33.7% · Other 3.6%
- 2008→2024 swing
- -20.5pp toward R · 2008: 49.5pp · 2024: 29.0pp
- All cycles
- 2024: D+29.0 2020: D+38.1 2016: D+37.3 2012: D+46.9 2008: D+49.5
Not yet ingested
- Civics
- —
Market trends
- HPI YoY
- ▼ -139.60%
- Current HPI
- 130.9545
- Rent YoY
- ▲ 5.20%
- Metro
- Detroit-Warren-Dearborn, MI
- State GDP YoY
- ▲ 1.37%
- F500 in state
- 28
Industry mix (Fortune 500 HQ in MI)
| Industry | F500 HQs | Revenue |
|---|---|---|
| Automotive Parts | 3 | $48B |
|
||
| Automotive | 2 | $372B |
|
||
| Chemicals | 1 | $45B |
|
||
| Automotive Retail | 1 | $29B |
|
||
| Healthcare / Medical Devices | 1 | $23B |
|
||
| Automotive Technology | 1 | $20B |
|
||
Price history
+0.0% since first listed3 events — show timeline
- 2026-06-11 Listed $138,500 MiRealSource-MiMLS
- 2026-06-11 Listed $138,500 REALCOMP
- 2026-06-11 Listed $138,500 SW Michigan MLS
Property tax history
+17.0%/yrLatest (2025): $1,708 · +39.4% YoY. Source: county tax records.
Cash-flow waterfall
monthlySold comps — $/sqft
last 12 mo · ≤1 miLoading sold comps…