47 South St · Bridgewater, CT
Flood risk 1/10 · Minimal
- FEMA flood zone
- X
- Chance of flooding over 30 yrs
- 0.0%
- Est. flood insurance / yr
- $473 – $860
Fire risk 4/10 · Minor
- Est. fire insurance / yr
- $829 – $1,539
Heat risk 4/10 · Minor
- Hot days now (above 96°F)
- 7 days/yr
- Hot days in 30 yrs
- 15 days/yr
Wind risk 5/10 · Moderate
- Chance of severe wind over 30 yrs
- 23.0%
Air-quality risk 3/10 · Minor
- Unhealthy air days now
- 2 days/yr
- Unhealthy air days in 30 yrs
- 3 days/yr
Risk factors via First Street. Map © Google.
Why this score? — see what drove the B grade
The composite is a weighted blend of 9 inputs, each scored 0–100. Each bar is that input's sub-score; the figure is the points it added to the 100-point composite (weight × sub-score).
- Cash flow +30.0/30.0
- 1% rule +10.0/10.0
- DSCR +10.0/10.0
- ARV discount +7.5/15.0
- Schools +6.3/10.0
- Rent growth +2.5/5.0
- Livability +2.5/5.0
- Condition / age +2.5/5.0
- Appreciation +0.0/10.0
$850,000
🖨 Deal sheet 📄 Offer letter ✓ Due diligence
Listing remarks
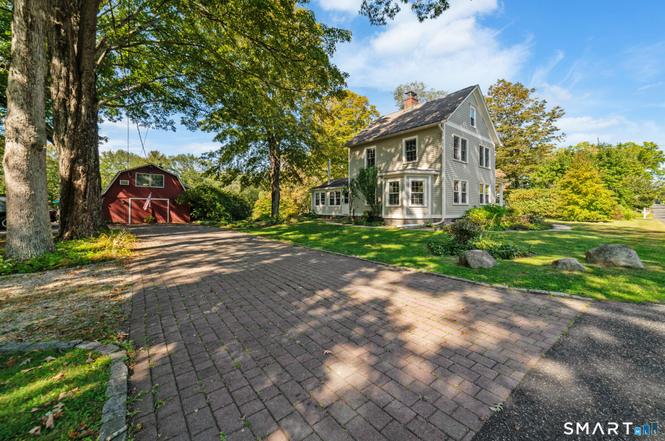
Step back in time and own a piece of history with the distinguished Philo N. Hodge House, a remarkable antique home built in 1833 and proudly added to the National Register of Historic Places in 2024. Rich in character and historic charm, this unique property offers an opportunity to become the next steward of a truly special home. Bring your imagination and vision to this treasured historic property and make it your own. A welcoming foyer greets you upon entry and leads to a spacious formal living room featuring a classic fireplace. The sunroom is complete with a wood-burning stove. Upstairs, you'll find three bedrooms, including one pass-through bedroom that offers flexibility for a nurse
Key facts
- Private wood deck
- 4.47 acre lot
- Built 1833
Tags
Property features AI
Finance
- Financial info: Assessed value listed (public record)
Exterior
- Utilities: Private well water; Septic system; Fuel tank located in basement
- Home design: Single family home
- Construction: Frame construction; Stone foundation; Grey exterior
- Exterior features: Asphalt shingle roof; Clapboard siding; Lot lightly wooded with level areas and some wetlands; Located in a regulated historic district
Interior
- Kitchen: Electric range; Oven/Range; Refrigerator
- Bedrooms: 3 bedrooms
- Bathrooms: 2 full bathrooms
- Heating & cooling: Baseboard heat; Wood/coal stove; Oil-fired heat; 50-gallon electric hot water tank; Generator
- Interior features: Whole-house humidifier; Two fireplaces; In-law apartment with detached access; Finished walk-up attic
- Laundry & utility: Washer and electric dryer; Laundry located on lower level
Neighborhood map
What this means for you Summary
Snapshot
- This is a 3-bed/2.0-bath other listed at $850k.
Deal economics
- At list price, monthly cash flow is $6k ($67k/yr) — positive.
- The deal already cash-flows at list — no discount required.
- Meets the 1% rule at list price ($14k rent vs $850k).
- Cap rate 14.2% vs local median 3.9% in Bridgewater — top-decile yield for the area; either an underpriced asset or a hidden risk that comps aren't pricing in. Stress-test before assuming the spread holds.
Location & tenants
- Location reads: area grade B — affects rentability + tenant quality, not the cash-flow math above.
- Regional School District 12 (rural): math 64% / reading 77% proficiency, ranked #20 of 153 in CT (top 13%) — strong family-tenant draw, lease renewals of 3-5y typical; only 8% free/reduced lunch — higher-income household profile.
- Zoned schools: Booth Free School (math 64% / reading 74%, grade A-, #78 of 553 statewide, top 17%, 73 students, 18% FRL).
- Market conditions: 48 active listings in the ZIP; 3 comparable units currently listed for rent nearby; rentals lingering (median 44d on market — plan ~5-8 weeks vacancy on turnover, expect pricing pressure); 67% of comp listings sitting > 30 days — soft ceiling on asking rent; 154 units permitted in Northwest Hills Planning Region in 2024 (6 in 5+ unit buildings).
Forward outlook
- Local home prices are declining (-3.0%/yr); year-one equity from $6k of loan paydown is wiped out by about $26k of value loss. Plan a longer hold.
- At projected returns (-3.0% appreciation + 3.0% rent growth), your $238k cash investment doubles in ~5 years — after that, you're playing with house money.
Negotiation context
- Only 4 days on market — expect competitive offers; lowballing is unlikely to land.
- 2 sale attempts with the ask held roughly flat each time — persistent listings suggest the price (not the market) is what's stuck; bring a comps-based counter.
Risks & watch-outs
- Watch-outs: built in 1833 — expect roof / HVAC / electrical / plumbing capex.
- Climate carrying-cost: moderate wind risk, 23% chance of damaging wind over 30y — expect insurance premiums to compound above CPI over the hold.
Questions for the listing agent
- Built in 1833 — when were the roof, HVAC, electrical panel, plumbing, and water heater last replaced?
- Is there a deadline driving the sale (1031 exchange, divorce, estate, relocation)? That informs how much negotiation room exists.
- What's the average days-on-market for RENTAL listings here right now (not sales)? A rising rental-DOM trend means longer vacancies and softer asking-rent achievability than the comps imply.
- What's the recent tenant-quality profile in this submarket — average credit score on applications, eviction rate, late-payment / NSF rate, and stable-employment percentage? A property-management company in the area should have these aggregated.
- How much new for-sale + rental construction is in the pipeline within 1–3 miles? Heavy new supply typically softens prices + rents 12–24 months out; constrained supply supports both.
Investment metrics
- 1% rule
- 1.65% ✓
- Cap rate
- 14.17%
- Cash-on-cash
- 28.12%
- DSCR
- 2.25
- GRM
- 5.0
CMA / ARV
No comps found within radius.
Projected returns pro-forma
-3.0% appreciation · 3.0% rent growth · sell at horizon
- IRR
- 22.3%
- Equity multiple
- 1.91×
- Total profit
- $217,421
- Equity at exit
- $126,738
- IRR
- 30.3%
- Equity multiple
- 3.72×
- Total profit
- $646,644
- Equity at exit
- $73,492
Cash invested: $238,000 (down + closing). Projections, not guarantees.
Landlord ↔ Tenant lean methodology
- Overall (STATE)
- 27 Tenant-Leaning
- State Connecticut
- 27 Tenant-Leaning · D+7
- County
- — inherits STATE
- City
- — inherits STATE
ZIP-level market 06783
- Home prices YoY
- -24.7%
- Active inventory
- 48
- Price-to-rent
- 5.0×
Monthly cashflow live
- Estimated rent
- $14,054 medium interval (Pro) →
- Mortgage (P&I)
- −$4,457
- Tax from tax record
- −$714 /mo · $8,572/yr
- Insurance
- −$354
- HOA
- −$0
- Vacancy / Maint / Mgmt
- −$2,951
- Net cashflow
- $5,576
Break-even live
UW: 25.0% down · 7.5% · 30yr · 1.5% tax · 5.0% vac · 8.0% maint · 8.0% mgmt
Financing live
Cash to close
- Down payment
- $212,500
- Closing costs
- $25,500
- Reserves months
- —
- Total cash needed
- —
Loan-product check · same deal, 3 products live
Conventional
25% down · 7.5% · 30yr
- Down + closing
- —
- Monthly P&I
- —
- Monthly cashflow
- —
- DSCR
- —
- Eligible?
- —
Personal DTI + credit; lowest rate.
DSCR
20% down · 8.5% · 30yr
- Down + closing
- —
- Monthly P&I
- —
- Monthly cashflow
- —
- DSCR
- —
- Eligible?
- —
No personal income docs; deal must DSCR.
Hard money
10% down · 12.0% · 12mo
- Down + closing
- —
- Monthly P&I
- —
- Monthly cashflow
- —
- DSCR
- —
- Eligible?
- —
Short-term bridge; refi at stabilization.
Rent comps 3 comps
| Address | Beds | Baths | Sqft | Rent | $/sqft | DOM | Units | Dist |
|---|---|---|---|---|---|---|---|---|
| 5 North St Roxbury, CT | 4.0 | 2.5 | 3089 | $16,500 | $5.34 | 43d | 1 | 0.55mi |
| 24 Old Roxbury Rd Roxbury, CT | 3.0 | 3.5 | 2862 | $15,000 | $5.24 | 23d | 1 | 0.92mi |
| 7 Lower County Rd Roxbury, CT | 3.0 | 2.0 | 2568 | $9,000 | $3.50 | 43d | 1 | 1.09mi |
Listing history 5 events
-
2026-06-19days on market $850,000 Active 4 DOM
-
2026-06-18days on market $850,000 Active 3 DOM
-
2026-06-17days on market $850,000 Active 2 DOM
-
2026-06-16remarks 699-char remark
-
2026-06-16$850,000 Active 1 DOM
ⓘ Source: listings_history table (triggers on properties + properties_extension) + one-shot
backfill from property_details.listing_events for pre-trigger history.
Tax reassessment forecast CT · Partial reset (capped growth)
- Current annual tax
- $8,572 · $714/mo
- Projected year-2 tax
- $13,381 · $1,115/mo
- Expected delta
- +$4,809/yr (+$401/mo · 56.1%)
ⓘ Screening estimate from a state-policy table — verify with the county assessor before closing.
Climate risk First Street
- Flood 1/10 Low FEMA zone X · 0% chance over 30 yrs
- Wildfire 4/10 Moderate
- Heat 4/10 Moderate 7 d/yr ≥96°F today · 15 d/yr by 30 yrs out
- Wind 5/10 Major 23% chance of damaging wind over 30 yrs
- Air quality 3/10 Moderate 2 unhealthy d/yr today · 3 by 30 yrs out
Nearby sold comps map
Loading sold comps map…
Walkable amenities ~0.75 mi
Loading nearby amenities…
Taxation est. · year 1
- Rental income
- $168,643
- − Mortgage interest
- −$47,613
- − Property taxes
- −$8,572
- − Insurance
- −$4,250
- − Repairs & maintenance
- −$13,491
- − Management
- −$13,491
- − Depreciation
- −$24,727
- Taxable income
- $56,498
- Est. tax owed @ 24.0%
- −$13,559
- After-tax cash flow
- $53,357/yr
For passive investors: Depreciation is non-cash, so a rental often shows a tax loss while cash-flowing — sheltering income. Rental losses are passive: they offset passive income freely, and up to $25,000/yr can offset ordinary (W-2) income if you actively participate and your MAGI is under $100k (phasing out to $0 by $150k); unused losses carry forward. On sale, claimed depreciation is recaptured at up to 25%, and gains may owe capital-gains tax (a 1031 exchange can defer both). Figures are a year-1 estimate at your 24.0% rate — not tax advice; consult a CPA.
Schools (NCES district)
- District
- Regional School District 12
- NCES district ID
- 0903530
- Math proficiency
- 64% ▼ -9.00%
- Reading proficiency
- 77% ▬ 0.00%
- Median HH income
- $86,065
- Composite
- 63.18/100
- National rank
- #638
- State rank
- #20 of 153 in CT
Livability — Bridgewater
No livability data for this city. (Only ~50 U.S. cities are tracked.)
Census & demographics
- Population (ZIP)
- 2,184
Population outlook (Northwest Hills County) Hauer SSP2
- By 2040
- 118,998
Race, ethnicity, and origin ACS 2023
- Neighborhood character
- Predominantly White (84%)
- Race & ethnicity
- White 84% Black 7% Hispanic / Latino 5% Two or more races 3% Asian 3%
- Common ancestry
- Slovak 8% Romanian 7% Hispanic 5%
- Foreign-born
- 14% · Canada
- Languages at home
- 82% English-only · French/Haitian/Cajun 6% Other Indo-European 4% Spanish 3%
Political lean MEDSL · Northwest Hills
- 2024 margin
- Toss-up / Even · D 48.6% · R 49.9% · Other 1.6%
- All cycles
- 2024: R+1.3
Not yet ingested
- Civics
- —
Market trends
- HPI YoY
- ▼ -55.80%
- Current HPI
- 170.3789
- Rent YoY
- —
- Metro
- —
- State GDP YoY
- ▲ 1.06%
- F500 in state
- 38
Industry mix (Fortune 500 HQ in CT)
| Industry | F500 HQs | Revenue |
|---|---|---|
| Industrial Machinery | 4 | $38B |
|
||
| Insurance | 3 | $71B |
|
||
| Financial Services | 2 | $25B |
|
||
| Transportation / Logistics | 2 | $18B |
|
||
| Healthcare | 1 | $247B |
|
||
| Telecommunications | 1 | $55B |
|
||
Price history
-12.8% since first listed5 events — show timeline
- 2026-06-15 Listed $850,000 Smart MLS
- 2026-04-02 Listing Removed — Smart MLS
- 2025-11-05 Price Changed $875,000 Smart MLS
- 2025-10-01 Listed $975,000 Smart MLS
- 2025-09-26 Coming Soon — Smart MLS
Property tax history
+2.3%/yrLatest (2023): $8,572 · +5.6% YoY. Source: county tax records.
Cash-flow waterfall
monthlySold comps — $/sqft
last 12 mo · ≤1 miLoading sold comps…