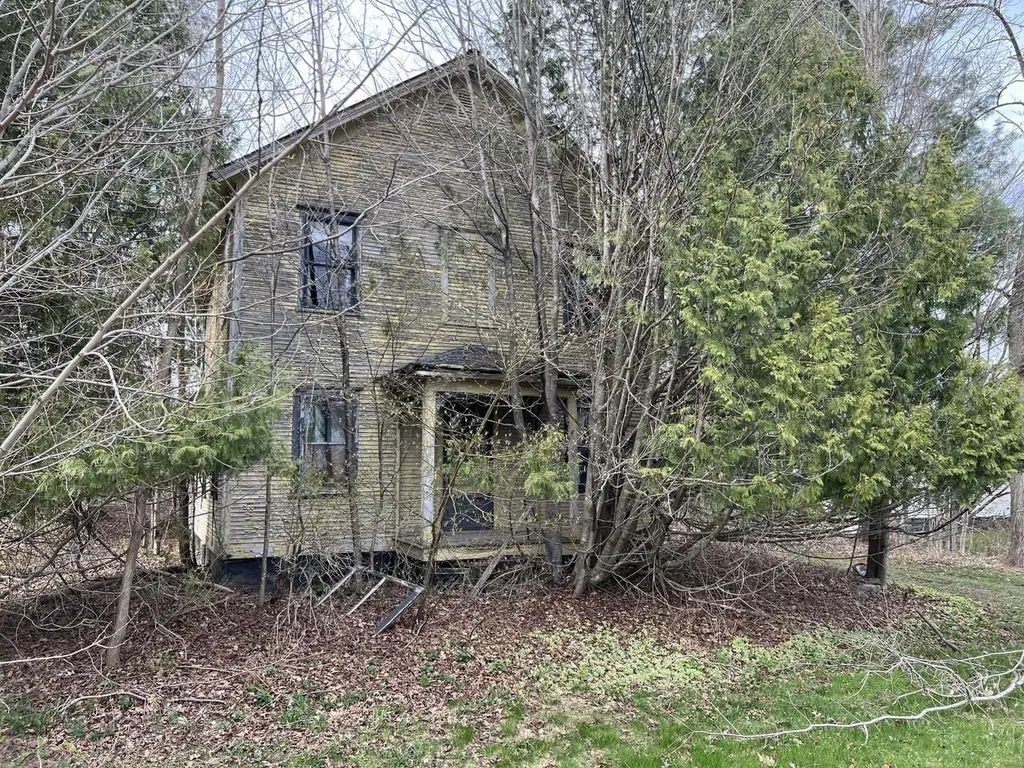
776 Fairfax Rd · Fletcher, VT
Flood risk 1/10 · Minimal
- FEMA flood zone
- X
- Chance of flooding over 30 yrs
- 0.0%
- Est. flood insurance / yr
- $473 – $860
Fire risk 1/10 · Minimal
- Est. fire insurance / yr
- $480 – $892
Heat risk 2/10 · Minimal
- Hot days now (above 92°F)
- 7 days/yr
- Hot days in 30 yrs
- 16 days/yr
Wind risk 2/10 · Minimal
- Chance of severe wind over 30 yrs
- 2.0%
Air-quality risk 2/10 · Minimal
- Unhealthy air days now
- 1 days/yr
- Unhealthy air days in 30 yrs
- 1 days/yr
Risk factors via First Street. Map © Google.
Why this score? — see what drove the B grade
The composite is a weighted blend of 9 inputs, each scored 0–100. Each bar is that input's sub-score; the figure is the points it added to the 100-point composite (weight × sub-score).
- Cash flow +27.1/30.0
- DSCR +9.4/10.0
- 1% rule +7.8/10.0
- ARV discount +7.5/15.0
- Appreciation +6.6/10.0
- Schools +5.0/10.0
- Rent growth +2.5/5.0
- Livability +2.5/5.0
- Condition / age +2.5/5.0
$119,900
🖨 Deal sheet 📄 Offer letter ✓ Due diligence
Listing remarks MLS
Fletcher Village vintage home with amazing potential! Fantastic investment opportunity! In-town . 25-acre lot. 1,440 finished square feet with 4 bedrooms and 2 full bathrooms including a bedroom and full bath on the main level. Attached barn. On-site well and septic - condition unknown. Town offices are located just around the corner. Priced under town assessed value. Sold "AS IS" - contents and all in the house and barn. Limited disclosures - Buyers to perform their own due diligence. CASH offers only. NO PERSONS ARE PERMITTED ON THE PREMISES WITHOUT AN APPOINTMENT AND AGENT. SIGNED HOLD HARMLESS REQUIRED FOR ALL PERSONS ATTENDING SHOWINGS & INSPECTIONS.
Key facts
- Attached barn
- Vintage home
- On-site well
Tags
Neighborhood map
What this means for you Summary
Snapshot
- This is a 4-bed/2.0-bath other listed at $120k.
Deal economics
- At list price, monthly cash flow is $338 ($4k/yr) — positive.
- The deal already cash-flows at list — no discount required.
- Meets the 1% rule at list price ($2k rent vs $120k).
- Recommended offer: $106k (12.0% below list) — sets the bar for market timing.
Location & tenants
- Location reads: area grade B — affects rentability + tenant quality, not the cash-flow math above.
- Market conditions: 18 active listings in the ZIP; 200 units permitted in Franklin County in 2024 (25 in 5+ unit buildings).
Forward outlook
- In year one you build about $5k of equity ($829 loan paydown + $4k appreciation (3.3% local appreciation)).
- Franklin County population projected to shrink 3% by 2050 — rents likely to lag national; underwrite the cash flow, not the appreciation.
- At projected returns (3.3% appreciation + 3.0% rent growth), your $34k cash investment doubles in ~4 years — after that, you're playing with house money.
- By year 7, paydown + projected appreciation supports a ~$30k cash-out refi (75% LTV) — recoverable capital for the next deal without selling this one.
Negotiation context
- It's been on market 122 days — a 12% lower offer ($106k) is reasonable based on typical stale-listing flexibility.
Risks & watch-outs
- Watch-outs: built in 1900 — expect roof / HVAC / electrical / plumbing capex.
Questions for the listing agent
- It's been on market 122 days. Have you received any prior offers? Is the seller open to a 12% concession, seller financing, or rate buy-down credit?
- Built in 1900 — when were the roof, HVAC, electrical panel, plumbing, and water heater last replaced?
- Why hasn't it sold? Are there any deal-killer items the seller is aware of (foundation, flood, title, zoning, code violations)?
- Is there a deadline driving the sale (1031 exchange, divorce, estate, relocation)? That informs how much negotiation room exists.
- What's the average days-on-market for RENTAL listings here right now (not sales)? A rising rental-DOM trend means longer vacancies and softer asking-rent achievability than the comps imply.
- What's the recent tenant-quality profile in this submarket — average credit score on applications, eviction rate, late-payment / NSF rate, and stable-employment percentage? A property-management company in the area should have these aggregated.
- How much new for-sale + rental construction is in the pipeline within 1–3 miles? Heavy new supply typically softens prices + rents 12–24 months out; constrained supply supports both.
Investment metrics
- 1% rule
- 1.28% ✓
- Cap rate
- 9.67%
- Cash-on-cash
- 12.07%
- DSCR
- 1.54
- GRM
- 6.5
CMA / ARV
- ARV (median comp)
- $371,194
- List price
- $119,900
- Delta
- -67.70%
- Verdict
- UNDERPRICED
- Comps
- 6 within 1.0 mi
Projected returns pro-forma
3.28% appreciation · 3.0% rent growth · sell at horizon
- IRR
- 19.5%
- Equity multiple
- 2.13×
- Total profit
- $37,796
- Equity at exit
- $55,818
- IRR
- 20.5%
- Equity multiple
- 4.05×
- Total profit
- $102,302
- Equity at exit
- $87,534
Cash invested: $33,572 (down + closing). Projections, not guarantees.
Landlord ↔ Tenant lean methodology
- Overall (STATE)
- 41 Moderately Tenant-Leaning
- State Vermont
- 41 Moderately Tenant-Leaning · D+15
- County
- — inherits STATE
- City
- — inherits STATE
ZIP-level market 05444
- Home prices YoY
- 1.0%
- Active inventory
- 18
- Price-to-rent
- 6.5×
Monthly cashflow live
- Estimated rent
- $1,537 medium interval (Pro) →
- Mortgage (P&I)
- −$629
- Tax from tax record
- −$198 /mo · $2,374/yr
- Insurance
- −$50
- HOA
- −$0
- Vacancy / Maint / Mgmt
- −$323
- Net cashflow
- $338
Break-even live
UW: 25.0% down · 7.5% · 30yr · 1.5% tax · 5.0% vac · 8.0% maint · 8.0% mgmt
Financing live
Cash to close
- Down payment
- $29,975
- Closing costs
- $3,597
- Reserves months
- —
- Total cash needed
- —
Loan-product check · same deal, 3 products live
Conventional
25% down · 7.5% · 30yr
- Down + closing
- —
- Monthly P&I
- —
- Monthly cashflow
- —
- DSCR
- —
- Eligible?
- —
Personal DTI + credit; lowest rate.
DSCR
20% down · 8.5% · 30yr
- Down + closing
- —
- Monthly P&I
- —
- Monthly cashflow
- —
- DSCR
- —
- Eligible?
- —
No personal income docs; deal must DSCR.
Hard money
10% down · 12.0% · 12mo
- Down + closing
- —
- Monthly P&I
- —
- Monthly cashflow
- —
- DSCR
- —
- Eligible?
- —
Short-term bridge; refi at stabilization.
Listing history 17 events
-
2026-06-18days on market $119,900 Active 122 DOM
-
2026-06-17days on market $119,900 Active 121 DOM
-
2026-06-16days on market $119,900 Active 120 DOM
-
2026-06-15days on market $119,900 Active 119 DOM
-
2026-06-15days on market $119,900 Active 118 DOM
-
2026-06-13days on market $119,900 Active 117 DOM
-
2026-06-12pricedays on market $119,900 Active 116 DOM
-
2026-06-09days on market $139,900 Active 113 DOM
-
2026-06-08days on market $139,900 Active 112 DOM
-
2026-06-08days on market $139,900 Active 111 DOM
-
2026-06-05days on market $139,900 Active 109 DOM
-
2026-06-03days on market $139,900 Active 107 DOM
-
2026-06-02days on market $139,900 Active 106 DOM
-
2026-06-01days on market $139,900 Active 105 DOM
-
2026-05-31days on market $139,900 Active 104 DOM
-
2026-04-22price $139,900 679-char remark
Show marketing remark (679 chars)
Fletcher Village vintage home with amazing potential! Fantastic investment opportunity! In-town . 25-acre lot. 1,440 finished square feet with 4 bedrooms and 2 full bathrooms including a bedroom and full bath on the main level. Attached barn. On-site well and septic - condition unknown. Town offices are located just around the corner. Priced under town assessed value. Sold "AS IS" - contents and all in the house and barn. Limited disclosures - Buyers to perform their own due diligence. CASH offers only. NO PERSONS ARE PERMITTED ON THE PREMISES WITHOUT AN APPOINTMENT AND AGENT. SIGNED HOLD HARMLESS REQUIRED FOR ALL PERSONS ATTENDING SHOWINGS & INSPECTIONS.
-
2026-02-16$155,000 Active 679-char remark
Show marketing remark (679 chars)
Fletcher Village vintage home with amazing potential! Fantastic investment opportunity! In-town . 25-acre lot. 1,440 finished square feet with 4 bedrooms and 2 full bathrooms including a bedroom and full bath on the main level. Attached barn. On-site well and septic - condition unknown. Town offices are located just around the corner. Priced under town assessed value. Sold "AS IS" - contents and all in the house and barn. Limited disclosures - Buyers to perform their own due diligence. CASH offers only. NO PERSONS ARE PERMITTED ON THE PREMISES WITHOUT AN APPOINTMENT AND AGENT. SIGNED HOLD HARMLESS REQUIRED FOR ALL PERSONS ATTENDING SHOWINGS & INSPECTIONS.
ⓘ Source: listings_history table (triggers on properties + properties_extension) + one-shot
backfill from property_details.listing_events for pre-trigger history.
Tax reassessment forecast VT · Partial reset (capped growth)
- Current annual tax
- $2,374 · $198/mo
- Projected year-2 tax
- $2,374 · $198/mo
- Expected delta
- $0/yr ($0/mo · 0.0%)
ⓘ Screening estimate from a state-policy table — verify with the county assessor before closing.
Climate risk First Street
- Flood 1/10 Low FEMA zone X · 0% chance over 30 yrs
- Wildfire 1/10 Low
- Heat 2/10 Low 7 d/yr ≥92°F today · 16 d/yr by 30 yrs out
- Wind 2/10 Low 2% chance of damaging wind over 30 yrs
- Air quality 2/10 Low 1 unhealthy d/yr today · 1 by 30 yrs out
Nearby sold comps map
Loading sold comps map…
Walkable amenities ~0.75 mi
Loading nearby amenities…
Taxation est. · year 1
- Rental income
- $18,445
- − Mortgage interest
- −$6,716
- − Property taxes
- −$2,374
- − Insurance
- −$600
- − Repairs & maintenance
- −$1,476
- − Management
- −$1,476
- − Depreciation
- −$3,488
- Taxable income
- $2,316
- Est. tax owed @ 24.0%
- −$556
- After-tax cash flow
- $3,497/yr
For passive investors: Depreciation is non-cash, so a rental often shows a tax loss while cash-flowing — sheltering income. Rental losses are passive: they offset passive income freely, and up to $25,000/yr can offset ordinary (W-2) income if you actively participate and your MAGI is under $100k (phasing out to $0 by $150k); unused losses carry forward. On sale, claimed depreciation is recaptured at up to 25%, and gains may owe capital-gains tax (a 1031 exchange can defer both). Figures are a year-1 estimate at your 24.0% rate — not tax advice; consult a CPA.
Schools (NCES district)
No district data.
Livability — Fletcher
No livability data for this city. (Only ~50 U.S. cities are tracked.)
Census & demographics
- Population (ZIP)
- 1,711
Population outlook (Franklin County) Hauer SSP2
- Today (2025)
- 50,374 people
- By 2030
- 50,718 · +0.7%
- By 2040
- 50,557 · +0.4%
- By 2050
- 48,832 · -3.1%
- By 2075
- 43,526 · -13.6%
- By 2100
- 33,970 · -32.6%
Race, ethnicity, and origin ACS 2023
- Neighborhood character
- Predominantly White (90%)
- Race & ethnicity
- White 90% Two or more races 5% Hispanic / Latino 4% Black 1%
- Common ancestry
- Lithuanian 12% Slovak 3% Iranian 3%
- Foreign-born
- 4% · Canada
- Languages at home
- 96% English-only · French/Haitian/Cajun 2% Spanish 1%
Political lean MEDSL · Franklin
- 2024 margin
- Toss-up / Even · D 50.0% · R 47.0% · Other 3.0%
- 2008→2024 swing
- -21.8pp toward R · 2008: 24.8pp · 2024: 3.0pp
- All cycles
- 2024: D+3.0 2020: D+9.0 2016: D+3.1 2012: D+23.6 2008: D+24.8
Not yet ingested
- Civics
- —
Market trends
- HPI YoY
- ▲ 3.28%
- Current HPI
- 331.5877
- Rent YoY
- —
- Metro
- —
- State GDP YoY
- —
- F500 in state
- 0
Price history
-9.7% since first listed2 events — show timeline
- 2026-04-22 Price Changed $139,900 PrimeMLS
- 2026-02-16 Listed $155,000 PrimeMLS
Property tax history
-2.8%/yrLatest (2024): $2,374 · +21.9% YoY. Source: county tax records.
Cash-flow waterfall
monthlySold comps — $/sqft
last 12 mo · ≤1 miLoading sold comps…