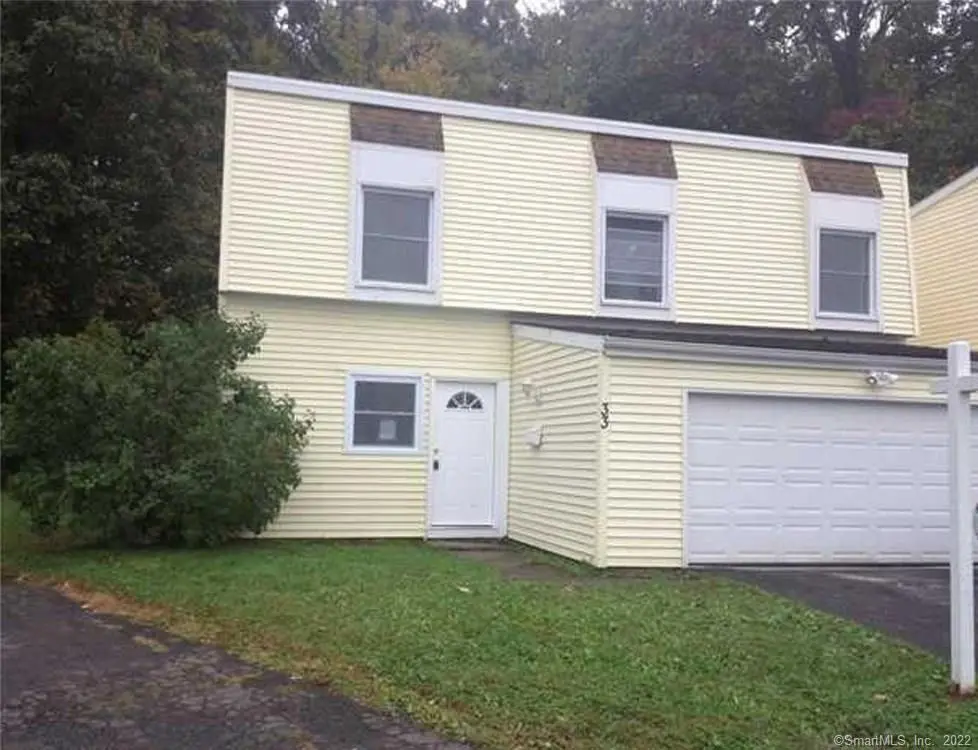
33 Inverness Ln · Middletown, CT
Flood risk 3/10 · Minor
- FEMA flood zone
- X (unshaded)
- Chance of flooding over 30 yrs
- 0.1%
- Est. flood insurance / yr
- $473 – $860
Fire risk 1/10 · Minimal
- Est. fire insurance / yr
- $829 – $1,539
Heat risk 5/10 · Moderate
- Hot days now (above 98°F)
- 7 days/yr
- Hot days in 30 yrs
- 15 days/yr
Wind risk 6/10 · Moderate
- Chance of severe wind over 30 yrs
- 27.0%
Air-quality risk 3/10 · Minor
- Unhealthy air days now
- 2 days/yr
- Unhealthy air days in 30 yrs
- 3 days/yr
Risk factors via First Street. Map © Google.
Why this score? — see what drove the C- grade
The composite is a weighted blend of 9 inputs, each scored 0–100. Each bar is that input's sub-score; the figure is the points it added to the 100-point composite (weight × sub-score).
- Cash flow +22.3/30.0
- DSCR +7.1/10.0
- 1% rule +5.6/10.0
- ARV discount +5.3/15.0
- Livability +4.0/5.0
- Schools +3.0/10.0
- Rent growth +2.6/5.0
- Condition / age +2.5/5.0
- Appreciation +0.0/10.0
$299,609
🖨 Deal sheet 📄 Offer letter ✓ Due diligence
Listing remarks
Welcome to this spacious move in ready four bedroom, two bath home located in the desirable Highland section of Middletown. This well maintained property features an updated kitchen with granite countertops and stainless steel appliances, offering both style and functionality. The first floor includes laminate flooring throughout the main living areas, while the bedrooms feature carpeting for added comfort. A slider in the living room provides access to the backyard and brings in plenty of natural light. With generous room sizes and a convenient location close to shopping, dining, parks, and highways, this home offers a great combination of comfort and convenience. Owner/agent
Key facts
- 2,613 sq ft lot
- 2 garage spots
- Built 1971
Property features AI
Finance
- Financial info: Professionally managed (off-site)
- HOA & community: Homeowners association with annual fee of $500; HOA covers grounds maintenance and property management; Community playground/tot lot
Exterior
- Parking: Attached garage; 2-car garage
- Utilities: Public water connected; Public sewer connected; Electric hot water (30 gallon tank); Thermopane windows
- Home design: Single-family home in a planned unit development; Living area approximately 1328
- Construction: Frame construction; Concrete foundation; Asphalt shingle roof
- Exterior features: Deck; Level lot; Vinyl siding; Yellow exterior color
Interior
- Kitchen: Oven/Range; Microwave; Refrigerator; Dishwasher
- Bedrooms: 4 bedrooms (upper level laundry)
- Bathrooms: 2 full bathrooms
- Heating & cooling: Baseboard heating; Electric heat
- Interior features: Automatic garage door opener; Cable available; Total of 6 rooms; No basement
- Laundry & utility: Laundry on upper level
Neighborhood map
What this means for you Summary
Snapshot
- This is a 4-bed/2.0-bath single-family listed at $300k.
Deal economics
- At list price, monthly cash flow is $491 ($6k/yr) — positive.
- The deal already cash-flows at list — no discount required.
- Meets the 1% rule at list price ($3k rent vs $300k).
- Recommended offer: $295k (1.5% below list) — sets the bar for market timing.
- Cap rate 8.3% vs local median 3.7% in Middletown — top-decile yield for the area; either an underpriced asset or a hidden risk that comps aren't pricing in. Stress-test before assuming the spread holds.
Location & tenants
- Location reads 81/100 on livability (#17 in CT, #1,390 nationally) — a professional / high-income tenant draw. Strengths: crime A+, amenities A+, health & safety A+; Watch: commute F.
- Middletown School District (urban): math 24% / reading 44% proficiency, ranked #113 of 153 in CT (top 74%) — families likely to look elsewhere, expect single-tenant / working-renter base with shorter leases.
- Zoned schools: Moody School (math 57% / reading 67%, grade B, #137 of 553 statewide, top 28%, 214 students, 30% FRL); Middletown High School (math 25% / reading 52%, grade F, #111 of 194 statewide, top 57%, 1,214 students, 49% FRL) — zoned schools at 39% FRL track the district average.
- Zoned-school proficiency averages 50% at this address vs 34% district-wide (+16 pts) — the actual schools serving this property are materially stronger than the Middletown School District average implies; a family-tenant draw the district grade alone would hide.
- Market conditions: Rents flat; 143 active listings in the ZIP; 4 comparable units currently listed for rent nearby; rentals at typical pace (median 20d on market — plan ~3-4 weeks tenant-placement turnaround); solid renter incomes; 278 units permitted in Lower Connecticut River Valley Planning Region in 2024 (89 in 5+ unit buildings).
- At $3,178/mo this rent would consume 48% of the median local household income ($79k/yr) (locally 2196% of renters already pay >50% of income on rent) — very limited rent-growth headroom before tenants either downsize or default.
Forward outlook
- Local home prices are declining (-3.0%/yr); year-one equity from $2k of loan paydown is wiped out by about $9k of value loss. Plan a longer hold.
Negotiation context
- It's been on market 15 days — a 2% lower offer ($295k) is reasonable based on typical stale-listing flexibility.
- 9 sale attempts since 26y ago; this cycle's ask is 50% above the opening price — seller raised mid-cycle; expect resistance to lowballs.
- Current owner paid $45k; list at $300k implies a 566% gain — meaningful room to come down on a strong offer.
Risks & watch-outs
- Climate carrying-cost: major wind risk, 27% chance of damaging wind over 30y; extreme-heat days projected 7→15/yr by 2055 (HVAC capex compounding) — expect insurance premiums to compound above CPI over the hold.
Questions for the listing agent
- Built in 1971 — when were the roof, HVAC, electrical panel, plumbing, and water heater last replaced?
- What does the HOA fee cover, when was the last increase, and are there any pending special assessments or reserve-fund shortfalls?
- Is there a deadline driving the sale (1031 exchange, divorce, estate, relocation)? That informs how much negotiation room exists.
- What's the average days-on-market for RENTAL listings here right now (not sales)? A rising rental-DOM trend means longer vacancies and softer asking-rent achievability than the comps imply.
- What's the recent tenant-quality profile in this submarket — average credit score on applications, eviction rate, late-payment / NSF rate, and stable-employment percentage? A property-management company in the area should have these aggregated.
- How much new for-sale + rental construction is in the pipeline within 1–3 miles? Heavy new supply typically softens prices + rents 12–24 months out; constrained supply supports both.
Investment metrics
- 1% rule
- 1.06% ✓
- Cap rate
- 8.26%
- Cash-on-cash
- 7.02%
- DSCR
- 1.31
- GRM
- 7.9
CMA / ARV
- ARV (on-the-fly)
- $285,520
- Comps found
- 12
Show comp detail 12 sales within ~0.75 mi
| Address | Dist | Beds/Ba | Sqft | Sold | Price | $/sf | Match |
|---|---|---|---|---|---|---|---|
| 7 Inverness Sq | 0.07mi | 3/1.0 (-1) | 1,328 (0%) | 5mo | $245,000 | $184 | 83 |
| 12 Inverness Ln | 0.07mi | 3/1.0 (-1) | 1,328 (0%) | 6mo | $195,609 | $147 | 82 |
| 67 Braeburn Ln | 0.12mi | 3/1.0 (-1) | 1,328 (0%) | 5mo | $245,000 | $184 | 81 |
| 4 Inverness Sq | 0.09mi | 4/1.0 | 1,328 (0%) | 19mo | $220,000 | $166 | 76 |
| 59 Fieldbrook Rd | 0.21mi | 3/1.0 (-1) | 1,352 (+2%) | 6mo | $390,000 | $288 | 74 |
| 6 Stirling Ct | 0.08mi | 3/1.0 (-1) | 1,370 (+3%) | 11mo | $240,000 | $175 | 72 |
| 833 East St | 0.22mi | 4/1.0 | 1,260 (-5%) | 6mo | $353,000 | $280 | 72 |
| 21 Afton Ter | 0.23mi | 3/1.0 (-1) | 1,328 (0%) | 13mo | $286,000 | $215 | 70 |
| 3 Braeburn Ln | 0.17mi | 3/1.0 (-1) | 1,209 (-9%) | 1mo | $190,000 | $157 | 67 |
| 72 Glendale Ave | 0.24mi | 3/1.0 (-1) | 1,462 (+10%) | 4mo | $321,700 | $220 | 60 |
| 90 Briarwood Ln | 0.75mi | 3/2.5 (-1) | 1,512 (+14%) | 7mo | $450,000 | $298 | 29 |
| 574 East St | 0.62mi | 3/2.5 (-1) | 1,525 (+15%) | 16mo | $405,000 | $266 | 26 |
Match score weights: distance 35% · size 25% · config 20% · recency 20%. Top-matched comps best support the ARV.
Projected returns pro-forma
-3.0% appreciation · 0.22% rent growth · sell at horizon
- IRR
- -8.7%
- Equity multiple
- 0.69×
- Total profit
- $-25,915
- Equity at exit
- $44,673
- IRR
- -3.2%
- Equity multiple
- 0.81×
- Total profit
- $-15,806
- Equity at exit
- $25,905
Cash invested: $83,891 (down + closing). Projections, not guarantees.
Landlord ↔ Tenant lean methodology
- Overall (STATE)
- 27 Tenant-Leaning
- State Connecticut
- 27 Tenant-Leaning · D+7
- County
- — inherits STATE
- City
- — inherits STATE
ZIP-level market 06457
- Rents YoY
- 0.2%
- Active inventory
- 143
- Price-to-rent
- 7.9×
Monthly cashflow live
- Estimated rent
- $3,178 medium interval (Pro) →
- Mortgage (P&I)
- −$1,571
- Tax from tax record
- −$281 /mo · $3,377/yr
- Insurance
- −$125
- HOA
- −$42
- Vacancy / Maint / Mgmt
- −$667
- Net cashflow
- $491
Break-even live
UW: 25.0% down · 7.5% · 30yr · 1.5% tax · 5.0% vac · 8.0% maint · 8.0% mgmt
Financing live
Cash to close
- Down payment
- $74,902
- Closing costs
- $8,988
- Reserves months
- —
- Total cash needed
- —
Loan-product check · same deal, 3 products live
Conventional
25% down · 7.5% · 30yr
- Down + closing
- —
- Monthly P&I
- —
- Monthly cashflow
- —
- DSCR
- —
- Eligible?
- —
Personal DTI + credit; lowest rate.
DSCR
20% down · 8.5% · 30yr
- Down + closing
- —
- Monthly P&I
- —
- Monthly cashflow
- —
- DSCR
- —
- Eligible?
- —
No personal income docs; deal must DSCR.
Hard money
10% down · 12.0% · 12mo
- Down + closing
- —
- Monthly P&I
- —
- Monthly cashflow
- —
- DSCR
- —
- Eligible?
- —
Short-term bridge; refi at stabilization.
Rent comps 4 comps
| Address | Beds | Baths | Sqft | Rent | $/sqft | DOM | Units | Dist |
|---|---|---|---|---|---|---|---|---|
| 53 Braeburn Ln Middletown, CT | 4.0 | 2.0 | 1580 | $3,650 | $2.31 | 19d | 1 | 0.16mi |
| 100 Town Rdg Middletown, CT | 1.0–3.0 | 1.0–2.0 | 1017 | $2,878 | $2.83 | 1d | 16 | 0.22mi |
| 5 Town Colony Dr Middletown, CT | 1.0–3.0 | 1.0–2.0 | 1135 | $2,964 | $2.61 | 1d | 15 | 0.33mi |
| 5 Midway Dr #5 Cromwell, CT | 3.0 | 1.5 | 1744 | $2,500 | $1.43 | 43d | 1 | 1.43mi |
HOA detail
- Monthly dues
- $42 · $504/yr
Listing history 37 events
-
2026-06-18days on market $299,609 Active 15 DOM
-
2026-06-17days on market $299,609 Active 14 DOM
-
2026-06-16days on market $299,609 Active 13 DOM
-
2026-06-15days on market $299,609 Active 12 DOM
-
2026-06-13days on market $299,609 Active 10 DOM
-
2026-06-13days on market $299,609 Active 9 DOM
-
2026-06-10days on market $299,609 Active 7 DOM
-
2026-06-09days on market $299,609 Active 6 DOM
-
2026-06-08days on market $299,609 Active 5 DOM
-
2026-06-07days on market $299,609 Active 4 DOM
-
2026-06-03days on market $299,609 Active 3 DOM
-
2026-06-02days on market $299,609 Active 2 DOM
-
2026-06-01statusdays on market $299,609 Active 1 DOM
-
2026-05-31days on market $299,609 Coming Soon 9 DOM
-
2026-05-22historical $299,609
-
2022-02-14historical
-
2022-02-07$199,609 Active
-
2016-12-15historical
-
2016-08-19$149,900
-
2016-02-08historical
-
2015-12-29$154,900
-
2015-07-20historical
-
2015-05-28$154,900
-
2013-03-30historical
-
2012-09-27$159,900
-
2012-06-22soldstatus $45,000
-
2012-06-22soldstatus $45,000
-
2012-05-22$49,900
-
2012-01-10historical
-
2010-07-28$49,900
-
2001-05-25soldstatus $79,500
-
2001-05-25soldstatus $79,500
-
2001-05-25soldstatus $79,500
-
2001-03-14$78,000
-
2000-07-03soldstatus $66,000
-
2000-06-29soldstatus $66,000
-
2000-02-15$64,979
ⓘ Source: listings_history table (triggers on properties + properties_extension) + one-shot
backfill from property_details.listing_events for pre-trigger history.
Tax reassessment forecast CT · Partial reset (capped growth)
- Current annual tax
- $3,377 · $281/mo
- Projected year-2 tax
- $4,894 · $408/mo
- Expected delta
- +$1,517/yr (+$126/mo · 44.9%)
ⓘ Screening estimate from a state-policy table — verify with the county assessor before closing.
Climate risk First Street
- Flood 3/10 Moderate FEMA zone X (unshaded) · 10% chance over 30 yrs
- Wildfire 1/10 Low
- Heat 5/10 Major 7 d/yr ≥98°F today · 15 d/yr by 30 yrs out
- Wind 6/10 Major 27% chance of damaging wind over 30 yrs
- Air quality 3/10 Moderate 2 unhealthy d/yr today · 3 by 30 yrs out
Nearby sold comps map
Loading sold comps map…
Walkable amenities ~0.75 mi
Loading nearby amenities…
Taxation est. · year 1
- Rental income
- $38,132
- − Mortgage interest
- −$16,783
- − Property taxes
- −$3,377
- − Insurance
- −$1,498
- − Repairs & maintenance
- −$3,051
- − Management
- −$3,051
- − HOA
- −$504
- − Depreciation
- −$8,716
- Taxable income
- $1,153
- Est. tax owed @ 24.0%
- −$277
- After-tax cash flow
- $5,614/yr
For passive investors: Depreciation is non-cash, so a rental often shows a tax loss while cash-flowing — sheltering income. Rental losses are passive: they offset passive income freely, and up to $25,000/yr can offset ordinary (W-2) income if you actively participate and your MAGI is under $100k (phasing out to $0 by $150k); unused losses carry forward. On sale, claimed depreciation is recaptured at up to 25%, and gains may owe capital-gains tax (a 1031 exchange can defer both). Figures are a year-1 estimate at your 24.0% rate — not tax advice; consult a CPA.
Schools (NCES district)
- District
- Middletown School District
- NCES district ID
- 0902490
- Math proficiency
- 24% ▼ -15.00%
- Reading proficiency
- 44% ▼ -8.00%
- Median HH income
- $60,733
- Composite
- 30.47/100
- National rank
- #6224
- State rank
- #113 of 153 in CT
Livability — Middletown
- Score
- 81/100
- State rank
- #17
- US rank
- #1390
Category grades
Schools grade is shown separately in the Schools card above.
Census & demographics
- Census place
- Middletown, CT
- County
- Middlesex County · 63,941 people
- City population
- 46,720
- Metro
- Hartford-East Hartford-Middletown, CT
- Population (ZIP)
- 46,720
- Household income
- $79,463
- Rent vs Own
- Severe rent burden
- 2196.0
Population outlook (Lower Connecticut River Valley County) Hauer SSP2
- By 2040
- 188,651
Race, ethnicity, and origin ACS 2023
- Neighborhood character
- Majority White (65%)
- Race & ethnicity
- White 65% Black 13% Hispanic / Latino 12% Two or more races 9% Asian 5%
- Hispanic origin (detail)
- Mexican 1% Puerto Rican 7%
- Common ancestry
- Romanian 9% Lithuanian 5% Slovak 2%
- Foreign-born
- 12% · Canada, China
- Languages at home
- 82% English-only · Spanish 6% Other Indo-European 4% Russian/Polish/Slavic 2%
Political lean MEDSL · Lower Connecticut River Valley
- 2024 margin
- D (+13.4) · D 55.9% · R 42.4% · Other 1.7%
- All cycles
- 2024: D+13.4
Not yet ingested
- Civics
- —
Market trends
- HPI YoY
- ▼ -470.20%
- Current HPI
- 255.1597
- Rent YoY
- ▲ 0.22%
- Metro
- Hartford-East Hartford-Middletown, CT
- State GDP YoY
- ▲ 1.06%
- F500 in state
- 38
Industry mix (Fortune 500 HQ in CT)
| Industry | F500 HQs | Revenue |
|---|---|---|
| Industrial Machinery | 4 | $38B |
|
||
| Insurance | 3 | $71B |
|
||
| Financial Services | 2 | $25B |
|
||
| Transportation / Logistics | 2 | $18B |
|
||
| Healthcare | 1 | $247B |
|
||
| Telecommunications | 1 | $55B |
|
||
Price history
+361.1% since first listed23 events — show timeline
- 2026-05-22 Coming Soon $299,609 Smart MLS
- 2022-02-14 Listing Removed — Smart MLS
- 2022-02-07 Listed $199,609 Smart MLS
- 2016-12-15 Listing Removed — Smart MLS
- 2016-08-19 Listed $149,900 Smart MLS
- 2016-02-08 Listing Removed — Smart MLS
- 2015-12-29 Listed $154,900 Smart MLS
- 2015-07-20 Listing Removed — Smart MLS
- 2015-05-28 Listed $154,900 Smart MLS
- 2013-03-30 Listing Removed — Smart MLS
- 2012-09-27 Listed $159,900 Smart MLS
- 2012-06-22 Sold (Public Records) $45,000 Public Records
- 2012-06-22 Sold (MLS) $45,000 Smart MLS
- 2012-05-22 Listed $49,900 Smart MLS
- 2012-01-10 Listing Removed — Smart MLS
- 2010-07-28 Listed $49,900 Smart MLS
- 2001-05-25 Sold (Public Records) $79,500 Public Records
- 2001-05-25 Sold (Public Records) $79,500 Public Records
- 2001-05-25 Sold (MLS) $79,500 Smart MLS
- 2001-03-14 Listed $78,000 Smart MLS
- 2000-07-03 Sold (Public Records) $66,000 Public Records
- 2000-06-29 Sold (MLS) $66,000 Smart MLS
- 2000-02-15 Listed $64,979 Smart MLS
Property tax history
+1.8%/yrLatest (2022): $3,377 · +0.2% YoY. Source: county tax records.
Cash-flow waterfall
monthlySold comps — $/sqft
last 12 mo · ≤1 miLoading sold comps…