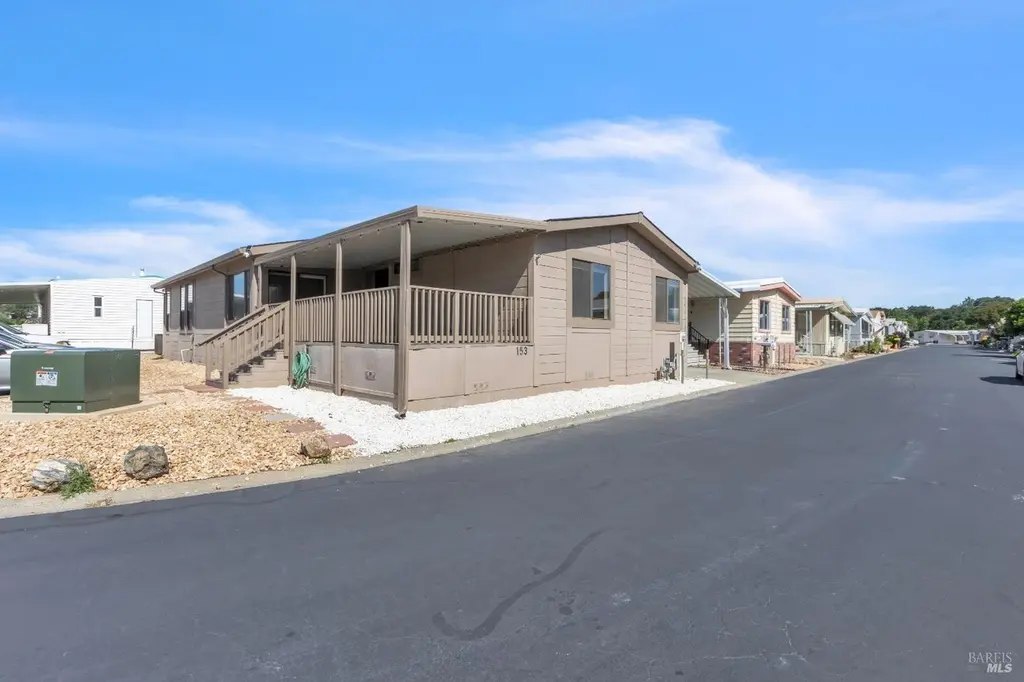
1597 Alamo Dr #153 · Vacaville, CA
Flood risk 1/10 · Minimal
- FEMA flood zone
- X (unshaded)
- Chance of flooding over 30 yrs
- 0.0%
- Est. flood insurance / yr
- $507 – $1,088
Fire risk 7/10 · Major
- Est. fire insurance / yr
- $659 – $1,223
Heat risk 6/10 · Moderate
- Hot days now (above 101°F)
- 7 days/yr
- Hot days in 30 yrs
- 14 days/yr
Wind risk 1/10 · Minimal
- Chance of severe wind over 30 yrs
- —
Air-quality risk 10/10 · Severe
- Unhealthy air days now
- 21 days/yr
- Unhealthy air days in 30 yrs
- 22 days/yr
Risk factors via First Street. Map © Google.
Why this score? — see what drove the C+ grade
The composite is a weighted blend of 9 inputs, each scored 0–100. Each bar is that input's sub-score; the figure is the points it added to the 100-point composite (weight × sub-score).
- Cash flow +29.7/30.0
- DSCR +10.0/10.0
- 1% rule +8.3/10.0
- Schools +4.2/10.0
- Livability +3.9/5.0
- Condition / age +2.5/5.0
- Rent growth +2.4/5.0
- ARV discount +1.7/15.0
- Appreciation +0.0/10.0
$209,900
🖨 Deal sheet 📄 Offer letter ✓ Due diligence
Listing remarks
Welcome home to this spacious and beautifully updated 2-bedroom, 2-bath retreat in a sought-after 55+ community in Vacaville. At 1720 square feet, this home offers the comfort, privacy, and thoughtful upgrades today's buyers are looking for at an exceptional value. The primary suite is a true sanctuary with a massive walk-in closet, barn door entry to the en suite bath, soaking tub, large shower, updated vanity, new flooring, and modern lighting. Just off the bedroom, a sun-filled office and den with a skylight, ceiling fan, and its own heating and cooling, perfect for a home office, hobby space, or reading retreat with French doors leading to the living room. The remodeled kitchen features
Key facts
- Quartz countertops
- Stone-floor shower
- Walk-in closet
Tags
Property features AI
Finance
- Financial info: Monthly land lease: $832
- HOA & community: No association; Senior community
Exterior
- Parking: Covered parking for 2 vehicles
- Utilities: Public sewer
- Home design: Manufactured home (in park), triple wide; Updated/remodeled condition; Located in a senior community; Land lease property
- Construction: Composition roof; Manufacturer: Silvercrest IND (Starcrest model)
- Exterior features: Covered patio; Carport awning; Patio awning
Interior
- Kitchen: Dishwasher; Free-standing gas range
- Bedrooms: 2 bedrooms
- Flooring: Carpet; Laminate
- Bathrooms: 2 full bathrooms with tub and shower stall(s)
- Heating & cooling: Central heating; Central air; Ceiling fans
- Interior features: Accessible elevator installed; Pantry closet; Cathedral/vaulted living room; Dining and living room combined
- Laundry & utility: Inside laundry area with electric hookups (washer/dryer hookups only)
Neighborhood map
What this means for you Summary
Snapshot
- This is a 2-bed/2.0-bath manufactured listed at $210k.
Deal economics
- At list price, monthly cash flow is $763 ($9k/yr) — positive.
- The deal already cash-flows at list — no discount required.
- Meets the 1% rule at list price ($3k rent vs $210k).
- Recommended offer: $204k (3.0% below list) — sets the bar for market timing.
- Cap rate 10.7% vs local median 3.0% in Vacaville — top-decile yield for the area; either an underpriced asset or a hidden risk that comps aren't pricing in. Stress-test before assuming the spread holds.
Location & tenants
- Location reads 77/100 on livability (#88 in CA, #3,156 nationally) — a middle-class / working-renter tenant base. Strengths: amenities A+, employment A+, housing A+; Watch: schools C-, cost of living F.
- Vacaville Unified (suburban): math 37% / reading 52% proficiency, ranked #522 of 1,400 in CA (top 37%) — families likely to look elsewhere, expect single-tenant / working-renter base with shorter leases.
- Market conditions: Rents soft (-0.6%/yr); 263 active listings in the ZIP; 12 comparable units currently listed for rent nearby; rentals at typical pace (median 23d on market — plan ~3-4 weeks tenant-placement turnaround); 42% of comp listings sitting > 30 days — soft ceiling on asking rent; solid renter incomes; 1,472 units permitted in Solano County in 2024 (131 in 5+ unit buildings).
- This rent runs 31% of the median local income ($110k/yr) — at the standard rent-burdened threshold; future hikes will face affordability resistance.
Forward outlook
- Local home prices are declining (-3.0%/yr); year-one equity from $1k of loan paydown is wiped out by about $6k of value loss. Plan a longer hold.
- Solano County population projected at +15% by 2050 — modest demand growth; plan on rents tracking national, not racing it.
Negotiation context
- It's been on market 36 days — a 3% lower offer ($204k) is reasonable based on typical stale-listing flexibility.
- 2 sale attempts with the ask held roughly flat each time — persistent listings suggest the price (not the market) is what's stuck; bring a comps-based counter.
Risks & watch-outs
- Climate carrying-cost: major wildfire risk; extreme-heat days projected 7→14/yr by 2055 (HVAC capex compounding) — expect insurance premiums to compound above CPI over the hold.
Questions for the listing agent
- It's been on market 36 days. Have you received any prior offers? Is the seller open to a 3% concession, seller financing, or rate buy-down credit?
- Is there a deadline driving the sale (1031 exchange, divorce, estate, relocation)? That informs how much negotiation room exists.
- What's the average days-on-market for RENTAL listings here right now (not sales)? A rising rental-DOM trend means longer vacancies and softer asking-rent achievability than the comps imply.
- What's the recent tenant-quality profile in this submarket — average credit score on applications, eviction rate, late-payment / NSF rate, and stable-employment percentage? A property-management company in the area should have these aggregated.
- How much new for-sale + rental construction is in the pipeline within 1–3 miles? Heavy new supply typically softens prices + rents 12–24 months out; constrained supply supports both.
Investment metrics
- 1% rule
- 1.33% ✓
- Cap rate
- 10.65%
- Cash-on-cash
- 15.58%
- DSCR
- 1.69
- GRM
- 6.2
CMA / ARV
- ARV (median comp)
- $186,000
- List price
- $209,900
- Delta
- 12.85%
- Verdict
- OVERPRICED
- Comps
- 11 within 1.0 mi
Show comp detail 4 sales within ~0.75 mi
| Address | Dist | Beds/Ba | Sqft | Sold | Price | $/sf | Match |
|---|---|---|---|---|---|---|---|
| 1597 Alamo Dr #175 | 0.03mi | 3/2.0 (+1) | 1,552 (-10%) | 4mo | $165,500 | $107 | 74 |
| 1597 Alamo Dr #186 | 0.03mi | 3/2.0 (+1) | 1,674 (-3%) | 22mo | $299,900 | $179 | 70 |
| 1597 Alamo Dr #195 | 0.03mi | 2/2.0 | 1,498 (-13%) | 18mo | $160,000 | $107 | 62 |
| 1597 Alamo Dr #194 | 0.14mi | 3/2.0 (+1) | 1,500 (-13%) | 12mo | $166,000 | $111 | 57 |
Match score weights: distance 35% · size 25% · config 20% · recency 20%. Top-matched comps best support the ARV.
Projected returns pro-forma
-3.0% appreciation · 0.0% rent growth · sell at horizon
- IRR
- 2.9%
- Equity multiple
- 1.11×
- Total profit
- $6,403
- Equity at exit
- $31,297
- IRR
- 9.4%
- Equity multiple
- 1.62×
- Total profit
- $36,576
- Equity at exit
- $18,148
Cash invested: $58,772 (down + closing). Projections, not guarantees.
Landlord ↔ Tenant lean methodology
- Overall (STATE)
- 18 Strongly Tenant-Friendly
- State California
- 18 Strongly Tenant-Friendly · D+13
- County
- — inherits STATE
- City
- — inherits STATE
ZIP-level market 95687
- Rents YoY
- -0.6%
- Active inventory
- 263
- Price-to-rent
- 6.2×
Monthly cashflow live
- Estimated rent
- $2,802 high interval (Pro) →
- Mortgage (P&I)
- −$1,101
- Tax est. 1.5%
- −$262 /mo · $3,148/yr
- Insurance
- −$87
- HOA
- −$0
- Vacancy / Maint / Mgmt
- −$588
- Net cashflow
- $763
Break-even live
UW: 25.0% down · 7.5% · 30yr · 1.5% tax · 5.0% vac · 8.0% maint · 8.0% mgmt
Financing live
Cash to close
- Down payment
- $52,475
- Closing costs
- $6,297
- Reserves months
- —
- Total cash needed
- —
Loan-product check · same deal, 3 products live
Conventional
25% down · 7.5% · 30yr
- Down + closing
- —
- Monthly P&I
- —
- Monthly cashflow
- —
- DSCR
- —
- Eligible?
- —
Personal DTI + credit; lowest rate.
DSCR
20% down · 8.5% · 30yr
- Down + closing
- —
- Monthly P&I
- —
- Monthly cashflow
- —
- DSCR
- —
- Eligible?
- —
No personal income docs; deal must DSCR.
Hard money
10% down · 12.0% · 12mo
- Down + closing
- —
- Monthly P&I
- —
- Monthly cashflow
- —
- DSCR
- —
- Eligible?
- —
Short-term bridge; refi at stabilization.
Rent comps 12 comps
| Address | Beds | Baths | Sqft | Rent | $/sqft | DOM | Units | Dist |
|---|---|---|---|---|---|---|---|---|
| 1797 Brookwood Dr Vacaville, CA | 3.0 | 2.0 | 1258 | $2,800 | $2.23 | 13d | 1 | 0.23mi |
| 343 Moon River Pl Vacaville, CA | 1.0–3.0 | 1.0–2.5 | 893 | $2,720 | $3.05 | 13d | 22 | 0.60mi |
| 945 Davis St Vacaville, CA | 3.0 | 2.0 | 1248 | $2,800 | $2.24 | 13d | 1 | 0.67mi |
| 600 Rialto Dr Vacaville, CA | 3.0 | 2.0 | 1600 | $2,750 | $1.72 | 43d | 1 | 0.89mi |
| 361 Gabiano Ct Vacaville, CA | 3.0 | 2.5 | 1229 | $3,000 | $2.44 | 43d | 1 | 0.93mi |
| 148 Peabody Rd Vacaville, CA | 1.0–3.0 | 1.0–3.0 | 1046 | $2,998 | $2.86 | 2d | 15 | 1.03mi |
| 212 Stonyford Dr Vacaville, CA | 3.0 | 2.0 | 1296 | $3,000 | $2.31 | 43d | 1 | 1.04mi |
| 520 McKnight Ln Vacaville, CA | 3.0 | 2.0 | 1129 | $2,895 | $2.56 | 43d | 1 | 1.14mi |
| 398 Aaron Cir Vacaville, CA | 3.0 | 3.0 | 1700 | $3,295 | $1.94 | 23d | 1 | 1.17mi |
| 642 Silvertop Way Vacaville, CA | 3.0 | 2.0 | 1692 | $2,995 | $1.77 | 23d | 1 | 1.22mi |
| 432 Zachary Dr Vacaville, CA | 3.0 | 2.0 | 1100 | $2,850 | $2.59 | 43d | 1 | 1.38mi |
| 1000 Allison Dr Vacaville, CA | 1.0–2.0 | 1.0–2.0 | 990 | $3,100 | $3.13 | 13d | 15 | 1.43mi |
Listing history 19 events
-
2026-06-18price $209,900 Active 36 DOM
-
2026-06-18days on market $215,000 Active 36 DOM
-
2026-06-17days on market $215,000 Active 35 DOM
-
2026-06-16days on market $215,000 Active 34 DOM
-
2026-06-15days on market $215,000 Active 33 DOM
-
2026-06-14days on market $215,000 Active 31 DOM
-
2026-06-13statusdays on market $215,000 Active 30 DOM
-
2026-06-10days on market $215,000 Contingent (Show) 28 DOM
-
2026-06-09days on market $215,000 Contingent (Show) 27 DOM
-
2026-06-09status $215,000 Contingent (Show) 26 DOM
-
2026-06-08days on market $215,000 Active 26 DOM
-
2026-06-07days on market $215,000 Active 25 DOM
-
2026-06-05days on market $215,000 Active 22 DOM
-
2026-06-03days on market $215,000 Active 21 DOM
-
2026-06-02days on market $215,000 Active 20 DOM
-
2026-06-01days on market $215,000 Active 19 DOM
-
2026-05-31days on market $215,000 Active 18 DOM
-
2026-05-30days on market $215,000 Active 17 DOM
-
2026-05-13$215,000 Active 1245-char remark
ⓘ Source: listings_history table (triggers on properties + properties_extension) + one-shot
backfill from property_details.listing_events for pre-trigger history.
Climate risk First Street
- Flood 1/10 Low FEMA zone X (unshaded) · 0% chance over 30 yrs
- Wildfire 7/10 Severe
- Heat 6/10 Major 7 d/yr ≥101°F today · 14 d/yr by 30 yrs out
- Wind 1/10 Low
- Air quality 10/10 Extreme 21 unhealthy d/yr today · 22 by 30 yrs out
Nearby sold comps map
Loading sold comps map…
Walkable amenities ~0.75 mi
Loading nearby amenities…
Taxation est. · year 1
- Rental income
- $33,621
- − Mortgage interest
- −$11,758
- − Property taxes
- −$3,148
- − Insurance
- −$1,050
- − Repairs & maintenance
- −$2,690
- − Management
- −$2,690
- − Depreciation
- −$6,106
- Taxable income
- $6,180
- Est. tax owed @ 24.0%
- −$1,483
- After-tax cash flow
- $7,671/yr
For passive investors: Depreciation is non-cash, so a rental often shows a tax loss while cash-flowing — sheltering income. Rental losses are passive: they offset passive income freely, and up to $25,000/yr can offset ordinary (W-2) income if you actively participate and your MAGI is under $100k (phasing out to $0 by $150k); unused losses carry forward. On sale, claimed depreciation is recaptured at up to 25%, and gains may owe capital-gains tax (a 1031 exchange can defer both). Figures are a year-1 estimate at your 24.0% rate — not tax advice; consult a CPA.
Schools (NCES district)
- District
- Vacaville Unified
- NCES district ID
- 0640590
- Math proficiency
- 37% ▼ -1.00%
- Reading proficiency
- 52% ▲ 2.00%
- Median HH income
- $71,383
- Composite
- 42.48/100
- National rank
- #6877
- State rank
- #522 of 1400 in CA
Livability — Vacaville
- Score
- 77/100
- State rank
- #88
- US rank
- #3156
Category grades
Schools grade is shown separately in the Schools card above.
Census & demographics
- Census place
- Vacaville, CA
- County
- Solano County · 433,239 people
- City population
- 109,591
- Metro
- Vallejo, CA
- Population (ZIP)
- 69,390
- Household income
- $109,566
- Rent vs Own
- Severe rent burden
- 1761.0
Population outlook (Solano County) Hauer SSP2
- Today (2025)
- 478,685 people
- By 2030
- 497,974 · +4.0%
- By 2040
- 528,515 · +10.4%
- By 2050
- 549,115 · +14.7%
- By 2075
- 587,229 · +22.7%
- By 2100
- 571,378 · +19.4%
Race, ethnicity, and origin ACS 2023
- Neighborhood character
- Highly diverse neighborhood (Simpson 0.71)
- Race & ethnicity
- White 44% Hispanic / Latino 26% Two or more races 13% Black 10% Asian 10% Native American 1%
- Hispanic origin (detail)
- Mexican 18% Puerto Rican 2%
- Common ancestry
- Italian 13% Lithuanian 2% Portuguese 1%
- Foreign-born
- 12% · Canada, China
- Languages at home
- 80% English-only · Spanish 12% Tagalog/Filipino 3% Other Indo-European 2%
Political lean MEDSL · Solano
- 2024 margin
- Strong D (+23.0) · D 60.0% · R 37.1% · Other 2.9%
- 2008→2024 swing
- -5.6pp toward R · 2008: 28.6pp · 2024: 23.0pp
- All cycles
- 2024: D+23.0 2020: D+30.3 2016: D+30.5 2012: D+28.1 2008: D+28.6
Not yet ingested
- Civics
- —
Market trends
- HPI YoY
- ▼ -299.59%
- Current HPI
- 268.0777
- Rent YoY
- ▼ -0.55%
- Metro
- Vallejo, CA
- State GDP YoY
- ▲ 3.21%
- F500 in state
- 116
Industry mix (Fortune 500 HQ in CA)
| Industry | F500 HQs | Revenue |
|---|---|---|
| Technology | 27 | $1,492B |
|
||
| Financial Services | 3 | $174B |
|
||
| Retail | 3 | $44B |
|
||
| Insurance | 3 | $26B |
|
||
| Media / Entertainment | 2 | $115B |
|
||
| Pharmaceuticals / Biotech | 2 | $62B |
|
||
Price history
3 events — show timeline
- 2026-06-10 Relisted — BAREIS
- 2026-06-08 Contingent — BAREIS
- 2026-05-13 Listed $215,000 BAREIS
Cash-flow waterfall
monthlySold comps — $/sqft
last 12 mo · ≤1 miLoading sold comps…