1223 Old Ida Rd St · Tom Bean, TX
Flood risk No data
- FEMA flood zone
- —
- Chance of flooding over 30 yrs
- —
- Est. flood insurance / yr
- —
Fire risk No data
- Est. fire insurance / yr
- —
Heat risk No data
- Hot days now (above threshold)
- —
- Hot days in 30 yrs
- —
Wind risk No data
- Chance of severe wind over 30 yrs
- —
Air-quality risk No data
- Unhealthy air days now
- —
- Unhealthy air days in 30 yrs
- —
Risk factors via First Street. Map © Google.
Why this score? — see what drove the D grade
The composite is a weighted blend of 9 inputs, each scored 0–100. Each bar is that input's sub-score; the figure is the points it added to the 100-point composite (weight × sub-score).
- Cash flow +13.3/30.0
- ARV discount +10.9/15.0
- DSCR +4.0/10.0
- Schools +4.0/10.0
- Livability +3.4/5.0
- 1% rule +2.6/10.0
- Condition / age +2.5/5.0
- Rent growth +1.8/5.0
- Appreciation +0.0/10.0
$244,900
🖨 Deal sheet (PDF) 📄 Offer letter ✓ Due diligence
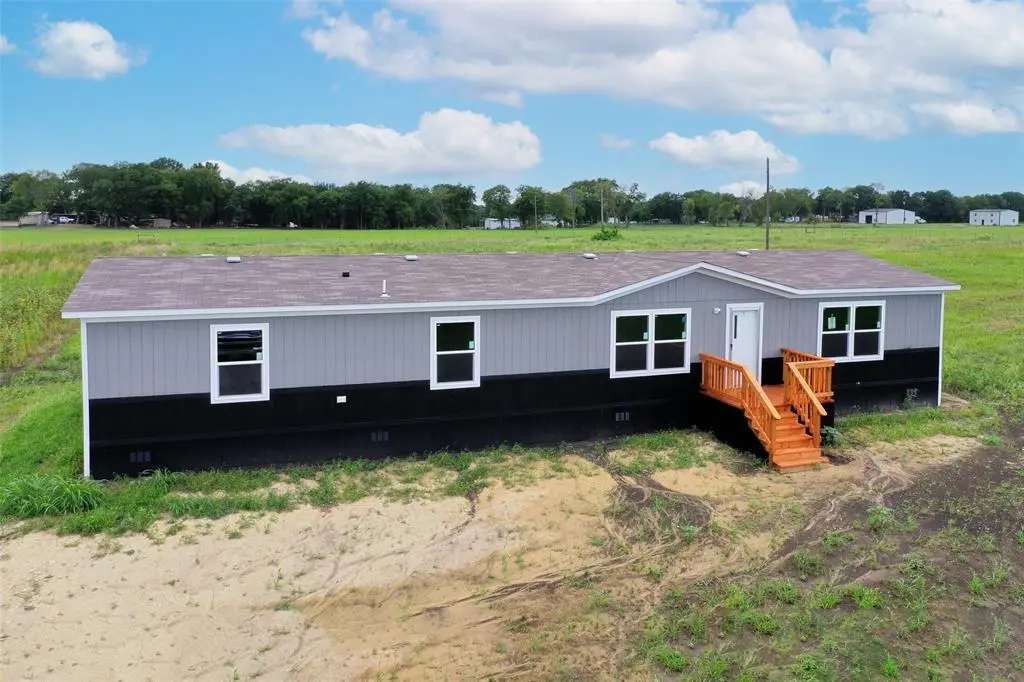
Listing remarks
Wide open spaces just a short drive from booming Sherman's amenities, this expansive BRAND NEW country home boasts 4 bedrooms, 2 full baths and beautiful back deck. Kitchen offers island for meal prep and casual dining, with open concept living, kitchen and dining areas. Large master bedroom has plenty of natural light and a huge walk-in closet. Home offers plenty of space with large closets, two living spaces and a huge beautiful lot.
Key facts
- Huge walk-in closet
- Two living spaces
- Open concept living
Tags
Property features AI
Finance
- Other: Property listed by builder (special listing condition: Builder)
- Financial info: Second mortgage: none; Loan type listed as: Treat As Clear
- HOA & community: No association
Exterior
- Parking: Driveway (no garage or carport)
- Utilities: Aerobic septic system; No municipal utility district
- Home design: Single-family residence; Residential property; New construction completed in 2025; One story
- Construction: Vinyl siding; Siding exterior; Composition roof; Concrete perimeter and pillar/post/pier foundation
- Exterior features: Covered deck; Covered porch(es); Acreage lot (approximately 1 acre)
Interior
- Kitchen: Dishwasher; Electric range; Refrigerator; Pantry (kitchen storage)
- Bedrooms: 4 bedrooms; Primary bedroom on main level with ensuite bath, linen closet and walk-in closet
- Flooring: Laminate flooring
- Bathrooms: 2 full bathrooms
- Heating & cooling: Central heating; Attic fan; Electric cooling
- Interior features: Open floorplan; Decorative lighting; Pantry; Two living areas; One dining area; One-level home
- Laundry & utility: No smart-home features listed
Neighborhood map
What this means for you Summary
Snapshot
- This is a 4-bed/2.0-bath land listed at $245k.
Deal economics
- At list price, monthly cash flow is $0 ($4/yr) — positive.
- The deal already cash-flows at list — no discount required.
- To meet the 1% rule (rent ≥ 1% of price), the offer needs to be $186k (24.0% below list).
- Recommended offer: $186k (24.0% below list) — sets the bar for 1% rule.
Location & tenants
- Location reads 68/100 on livability (#496 in TX) — a middle-class / working-renter tenant base. Strengths: crime A+, cost of living A+, housing A+; Watch: amenities F, commute F, health & safety F.
- Tom Bean ISD (rural): math 46% / reading 46% proficiency, ranked #230 of 826 in TX (top 28%) — families likely to look elsewhere, expect single-tenant / working-renter base with shorter leases.
- Zoned schools: Tom Bean El (math 62% / reading 52%, grade C+, #505 of 4,322 statewide, top 13%, 319 students, 49% FRL); Tom Bean Middle (math 37% / reading 42%, grade F, #660 of 1,662 statewide, top 41%, 136 students, 46% FRL); Tom Bean H S (math 27% / reading 47%, grade F, #897 of 1,632 statewide, top 57%, 211 students, 39% FRL).
- Market conditions: Rents soft (-2.7%/yr); 479 active listings in the ZIP; 2,272 units permitted in Grayson County in 2024 (750 in 5+ unit buildings).
- This rent runs 40% of the median local income ($56k/yr) — at the standard rent-burdened threshold; future hikes will face affordability resistance.
Forward outlook
- Local home prices are declining (-3.0%/yr); year-one equity from $2k of loan paydown is wiped out by about $7k of value loss. Plan a longer hold.
- Grayson County population projected at +12% by 2050 — modest demand growth; plan on rents tracking national, not racing it.
Negotiation context
- It's been on market 48 days — a 3% lower offer ($238k) is reasonable based on typical stale-listing flexibility.
- 2 sale attempts with the ask held roughly flat each time — persistent listings suggest the price (not the market) is what's stuck; bring a comps-based counter.
Questions for the listing agent
- It's been on market 48 days. Have you received any prior offers? Is the seller open to a 24% concession, seller financing, or rate buy-down credit?
- Is there a deadline driving the sale (1031 exchange, divorce, estate, relocation)? That informs how much negotiation room exists.
- The area grade is low — what's the realistic commute time and amenity access for the typical tenant pool here? Any planned neighborhood developments (good or bad) we should know about?
- What's the average days-on-market for RENTAL listings here right now (not sales)? A rising rental-DOM trend means longer vacancies and softer asking-rent achievability than the comps imply.
- What's the recent tenant-quality profile in this submarket — average credit score on applications, eviction rate, late-payment / NSF rate, and stable-employment percentage? A property-management company in the area should have these aggregated.
- How much new for-sale + rental construction is in the pipeline within 1–3 miles? Heavy new supply typically softens prices + rents 12–24 months out; constrained supply supports both.
Investment metrics
- 1% rule
- 0.76% ✗
- Cap rate
- 6.29%
- Cash-on-cash
- 0.01%
- DSCR
- 1.00
- GRM
- 11.0
CMA / ARV
- ARV (median comp)
- $264,995
- List price
- $244,900
- Delta
- -7.58%
- Verdict
- FAIR
- Comps
- 7 within 1.0 mi
Projected returns pro-forma
-3.0% appreciation · 0.0% rent growth · sell at horizon
- IRR
- -19.3%
- Equity multiple
- 0.34×
- Total profit
- $-45,228
- Equity at exit
- $36,515
- IRR
- -18.7%
- Equity multiple
- 0.11×
- Total profit
- $-60,881
- Equity at exit
- $21,174
Cash invested: $68,572 (down + closing). Projections, not guarantees.
Landlord ↔ Tenant lean methodology
- Overall (STATE)
- 87 Strongly Landlord-Friendly
- State Texas
- 87 Strongly Landlord-Friendly · R+5
- County
- — inherits STATE
- City
- — inherits STATE
ZIP-level market 75090
- Home prices YoY
- -20.0%
- Rents YoY
- -2.7%
- Active inventory
- 479
- Price-to-rent
- 11.0×
Monthly cashflow live
- Estimated rent
- $1,861 medium interval (Pro) →
- Mortgage (P&I)
- −$1,284
- Tax from tax record
- −$84 /mo · $1,006/yr
- Insurance
- −$102
- HOA
- −$0
- Vacancy / Maint / Mgmt
- −$391
- Net cashflow
- $0
Break-even live
Sensitivity live
| Price | -10% $139 | -5% $70 | +0% $0 | +5% $-69 | +10% $-138 |
|---|---|---|---|---|---|
| Rent | -10% $-147 | -5% $-73 | +0% $0 | +5% $74 | +10% $147 |
| Rate | -1.0pp $124 | -0.5pp $63 | base $0 | +0.5pp $-63 | +1.0pp $-128 |
UW: 25.0% down · 7.5% · 30yr · 1.5% tax · 5.0% vac · 8.0% maint · 8.0% mgmt
Financing live
Cash to close
- Down payment
- $61,225
- Closing costs
- $7,347
- Reserves months
- —
- Total cash needed
- —
Loan-product check · same deal, 3 products live
Conventional
25% down · 7.5% · 30yr
- Down + closing
- —
- Monthly P&I
- —
- Monthly cashflow
- —
- DSCR
- —
- Eligible?
- —
Personal DTI + credit; lowest rate.
DSCR
20% down · 8.5% · 30yr
- Down + closing
- —
- Monthly P&I
- —
- Monthly cashflow
- —
- DSCR
- —
- Eligible?
- —
No personal income docs; deal must DSCR.
Hard money
10% down · 12.0% · 12mo
- Down + closing
- —
- Monthly P&I
- —
- Monthly cashflow
- —
- DSCR
- —
- Eligible?
- —
Short-term bridge; refi at stabilization.
Listing history 23 events
-
2026-06-21days on market $244,900 Active 48 DOM
-
2026-06-19days on market $244,900 Active 46 DOM
-
2026-06-18days on market $244,900 Active 45 DOM
-
2026-06-17days on market $244,900 Active 44 DOM
-
2026-06-16days on market $244,900 Active 43 DOM
-
2026-06-15days on market $244,900 Active 42 DOM
-
2026-06-14days on market $244,900 Active 40 DOM
-
2026-06-13days on market $244,900 Active 39 DOM
-
2026-06-10days on market $244,900 Active 37 DOM
-
2026-06-09days on market $244,900 Active 36 DOM
-
2026-06-08days on market $244,900 Active 35 DOM
-
2026-06-07pricedays on market $244,900 Active 34 DOM
-
2026-06-05days on market $249,900 Active 31 DOM
-
2026-06-03days on market $249,900 Active 30 DOM
-
2026-06-02days on market $249,900 Active 29 DOM
-
2026-06-01days on market $249,900 Active 28 DOM
-
2026-05-31days on market $249,900 Active 27 DOM
-
2026-05-30days on market $249,900 Active 26 DOM
-
2026-05-04$249,900 Active 439-char remark
-
2026-04-30historical
-
2025-10-10price $254,999
-
2025-09-20price $264,999
-
2025-07-24$269,999 Active
ⓘ Source: listings_history table (triggers on properties + properties_extension) + one-shot
backfill from property_details.listing_events for pre-trigger history.
Tax reassessment forecast TX · Resets to sale price
- Current annual tax
- $1,006 · $84/mo
- Projected year-2 tax
- $4,482 · $373/mo
- Expected delta
- +$3,475/yr (+$290/mo · 345.3%)
ⓘ Screening estimate from a state-policy table — verify with the county assessor before closing.
Nearby sold comps map
Loading sold comps map…
Walkable amenities ~0.75 mi
Loading nearby amenities…
Taxation est. · year 1
- Rental income
- $22,337
- − Mortgage interest
- −$13,718
- − Property taxes
- −$1,006
- − Insurance
- −$1,224
- − Repairs & maintenance
- −$1,787
- − Management
- −$1,787
- − Depreciation
- −$7,124
- Taxable loss
- −$4,311
- Est. tax savings @ 24.0%
- +$1,035
- After-tax cash flow
- $1,038/yr
For passive investors: Depreciation is non-cash, so a rental often shows a tax loss while cash-flowing — sheltering income. Rental losses are passive: they offset passive income freely, and up to $25,000/yr can offset ordinary (W-2) income if you actively participate and your MAGI is under $100k (phasing out to $0 by $150k); unused losses carry forward. On sale, claimed depreciation is recaptured at up to 25%, and gains may owe capital-gains tax (a 1031 exchange can defer both). Figures are a year-1 estimate at your 24.0% rate — not tax advice; consult a CPA.
Schools (NCES district)
- District
- Tom Bean ISD
- NCES district ID
- 4842930
- Math proficiency
- 46% ▼ -4.00%
- Reading proficiency
- 46% ▬ 0.00%
- Median HH income
- $57,734
- Composite
- 40.21/100
- National rank
- #3782
- State rank
- #230 of 826 in TX
Livability — Tom Bean
- Score
- 68/100
- State rank
- #496
- US rank
- #9913
Category grades
Schools grade is shown separately in the Schools card above.
Census & demographics
- County
- Grayson County · 108,053 people
- City population
- 716
- Metro
- Sherman-Denison, TX
- Population (ZIP)
- 26,594
- Household income
- $55,543
- Rent vs Own
- Severe rent burden
- 840.0
Population outlook (Grayson County) Hauer SSP2
- Today (2025)
- 134,540 people
- By 2030
- 138,653 · +3.1%
- By 2040
- 145,958 · +8.5%
- By 2050
- 151,218 · +12.4%
- By 2075
- 161,802 · +20.3%
- By 2100
- 159,036 · +18.2%
Race, ethnicity, and origin ACS 2023
- Neighborhood character
- Diverse neighborhood (Simpson 0.64)
- Race & ethnicity
- White 49% Hispanic / Latino 32% Two or more races 17% Black 11%
- Hispanic origin (detail)
- Mexican 26%
- Common ancestry
- Slovak 2% Romanian 2% Lithuanian 1%
- Foreign-born
- 15% · Canada
- Languages at home
- 73% English-only · Spanish 24% German/W. Germanic 1% Other Indo-European 1%
Political lean MEDSL · Grayson
- 2024 margin
- Solid R (+54.3) · D 22.5% · R 76.7%
- 2008→2024 swing
- -16.4pp toward R · 2008: -37.9pp · 2024: -54.3pp
- All cycles
- 2024: R+54.3 2020: R+49.9 2016: R+53.1 2012: R+48.0 2008: R+37.9
Not yet ingested
- Civics
- —
Market trends
- HPI YoY
- ▼ -69.00%
- Current HPI
- 276.5739
- Rent YoY
- ▼ -2.70%
- Metro
- Sherman-Denison, TX
- State GDP YoY
- ▲ 3.95%
- F500 in state
- 110
Industry mix (Fortune 500 HQ in TX)
| Industry | F500 HQs | Revenue |
|---|---|---|
| Energy | 16 | $1,198B |
|
||
| Technology | 5 | $198B |
|
||
| Engineering / Construction | 4 | $72B |
|
||
| Energy Services | 3 | $60B |
|
||
| Utilities | 3 | $41B |
|
||
| Healthcare | 2 | $330B |
|
||
Price history
-9.3% since first listed6 events — show timeline
- 2026-06-06 Price Changed $244,900 NTREIS
- 2026-05-04 Listed $249,900 NTREIS
- 2026-04-30 Listing Removed — NTREIS
- 2025-10-10 Price Changed $254,999 NTREIS
- 2025-09-20 Price Changed $264,999 NTREIS
- 2025-07-24 Listed $269,999 NTREIS
Cash-flow waterfall
monthlySold comps — $/sqft
last 12 mo · ≤1 miLoading sold comps…