 🌊 Lakefront
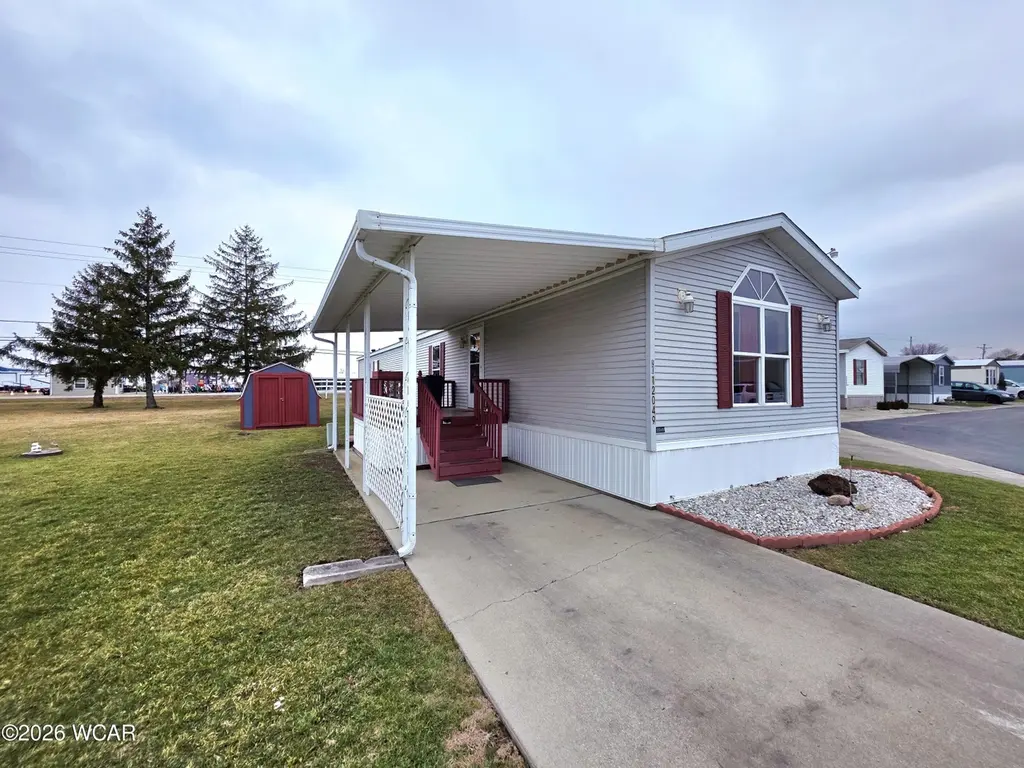
12049 Holly Dr #20 · Lakeview, OH
Flood risk 1/10 · Minimal
- FEMA flood zone
- X (unshaded)
- Chance of flooding over 30 yrs
- 0.0%
- Est. flood insurance / yr
- $507 – $1,088
Fire risk 1/10 · Minimal
- Est. fire insurance / yr
- $713 – $1,323
Heat risk 3/10 · Minor
- Hot days now (above 100°F)
- 7 days/yr
- Hot days in 30 yrs
- 18 days/yr
Wind risk 2/10 · Minimal
- Chance of severe wind over 30 yrs
- —
Air-quality risk 2/10 · Minimal
- Unhealthy air days now
- 1 days/yr
- Unhealthy air days in 30 yrs
- 2 days/yr
Risk factors via First Street. Map © Google.
Why this score? — see what drove the B grade
The composite is a weighted blend of 9 inputs, each scored 0–100. Each bar is that input's sub-score; the figure is the points it added to the 100-point composite (weight × sub-score).
- Cash flow +30.0/30.0
- 1% rule +10.0/10.0
- DSCR +10.0/10.0
- ARV discount +7.5/15.0
- Schools +5.3/10.0
- Livability +3.2/5.0
- Condition / age +2.8/5.0
- Rent growth +2.5/5.0
- Appreciation +0.0/10.0
$82,999
🖨 Deal sheet 📄 Offer letter ✓ Due diligence
Listing remarks MLS
Lake Life Starts Here - Holiday Shores Park at Indian Lake Welcome to easy living in Holiday Shores Park near Indian Lake! Priced at $82,999, this well-maintained 2 bedroom, 2 full bath mobile home offers comfort, convenience, and a lifestyle you'll love -- especially during the vibrant summer season. Property Features: 2 spacious bedrooms 2 full bathrooms All appliances included Large concrete driveway with plenty of parking Storage shed for extra space Nice open grass lot Covered deck -- perfect for relaxing mornings or evening gatherings Located in the heart of Holiday Shores Park at Indian Lake, you'll enjoy being close to the lake that comes alive in the summer with boating, water activities, restaurants, and local bars. Whether you're looking for a full-time residence or a weekend retreat, this home offers affordable access to lake-area living without the lakefront price. Don't miss your chance to own a slice of the Indian Lake lifestyle -- schedule your showing today!
Key facts
- Covered deck
- Storage shed
- Open grass lot
Tags
Neighborhood map
What this means for you Summary
Snapshot
- This is a 2-bed/2.0-bath manufactured listed at $83k. Condition is rated average.
Deal economics
- At list price, monthly cash flow is $532 ($6k/yr) — positive.
- The deal already cash-flows at list — no discount required.
- Meets the 1% rule at list price ($1k rent vs $83k).
- Recommended offer: $76k (9.0% below list) — sets the bar for market timing.
- Cap rate 14.0% vs local median 5.8% in Lakeview — top-decile yield for the area; either an underpriced asset or a hidden risk that comps aren't pricing in. Stress-test before assuming the spread holds.
Location & tenants
- Location reads 63/100 on livability (#836 in OH) — a middle-class / working-renter tenant base. Strengths: crime A+, cost of living A+, housing A+; Watch: schools F, amenities F, commute F.
- Indian Lake Local (rural): math 59% / reading 66% proficiency, ranked #261 of 656 in OH (top 40%) — acceptable for families but not a draw, mixed tenant base, ~2y average lease.
- Market conditions: 112 active listings in the ZIP; 1 comparable units currently listed for rent nearby; 121 units permitted in Logan County in 2024 (0 in 5+ unit buildings).
Forward outlook
- Local home prices are declining (-3.0%/yr); year-one equity from $574 of loan paydown is wiped out by about $2k of value loss. Plan a longer hold.
- Logan County population projected at -15% by 2050 — secular population decline; favor cash flow + early exit over multi-decade hold.
- At projected returns (-3.0% appreciation + 3.0% rent growth), your $23k cash investment doubles in ~5 years — after that, you're playing with house money.
Negotiation context
- It's been on market 115 days — a 9% lower offer ($76k) is reasonable based on typical stale-listing flexibility.
Questions for the listing agent
- It's been on market 115 days. Have you received any prior offers? Is the seller open to a 9% concession, seller financing, or rate buy-down credit?
- Why hasn't it sold? Are there any deal-killer items the seller is aware of (foundation, flood, title, zoning, code violations)?
- Is there a deadline driving the sale (1031 exchange, divorce, estate, relocation)? That informs how much negotiation room exists.
- Schools are F-rated, which usually means shorter tenancies and higher turnover. Who's the typical renter profile here, and what's been the actual vacancy rate?
- This sits on a lake — are riparian / water-frontage rights deeded with the parcel? Any dock permits, shoreline easements, or HOA water-use restrictions?
- What's the documented flood / surge / shoreline-erosion history here (FEMA AND non-FEMA — e.g., storm surge, creek backup, septic-field saturation)?
- Any water-quality or seasonal algae-bloom issues that affect tenant satisfaction or short-term-rental demand?
- What's the average days-on-market for RENTAL listings here right now (not sales)? A rising rental-DOM trend means longer vacancies and softer asking-rent achievability than the comps imply.
- What's the recent tenant-quality profile in this submarket — average credit score on applications, eviction rate, late-payment / NSF rate, and stable-employment percentage? A property-management company in the area should have these aggregated.
- How much new for-sale + rental construction is in the pipeline within 1–3 miles? Heavy new supply typically softens prices + rents 12–24 months out; constrained supply supports both.
Investment metrics
- 1% rule
- 1.69% ✓
- Cap rate
- 13.99%
- Cash-on-cash
- 27.49%
- DSCR
- 2.22
- GRM
- 4.9
CMA / ARV
- ARV (median comp)
- $39,210
- List price
- $82,999
- Delta
- 111.68%
- Verdict
- OVERPRICED
- Comps
- 2 within 1.0 mi
Show comp detail 2 sales within ~0.75 mi
| Address | Dist | Beds/Ba | Sqft | Sold | Price | $/sf | Match |
|---|---|---|---|---|---|---|---|
| 11773 Sunview Ave | 0.23mi | 2/2.0 | 1,324 (+3%) | 6mo | $65,000 | $49 | 78 |
| 12102 Shannon Dr #89 | 0.08mi | 3/2.0 (+1) | 1,100 (-14%) | 5mo | $25,000 | $23 | 63 |
Match score weights: distance 35% · size 25% · config 20% · recency 20%. Top-matched comps best support the ARV.
Projected returns pro-forma
-3.0% appreciation · 3.0% rent growth · sell at horizon
- IRR
- 21.5%
- Equity multiple
- 1.88×
- Total profit
- $20,481
- Equity at exit
- $12,375
- IRR
- 29.7%
- Equity multiple
- 3.65×
- Total profit
- $61,585
- Equity at exit
- $7,176
Cash invested: $23,240 (down + closing). Projections, not guarantees.
Landlord ↔ Tenant lean methodology
- Overall (STATE)
- 73 Landlord-Friendly
- State Ohio
- 73 Landlord-Friendly · R+6
- County
- — inherits STATE
- City
- — inherits STATE
ZIP-level market 43331
- Home prices YoY
- -30.0%
- Active inventory
- 112
- Price-to-rent
- 4.9×
Monthly cashflow live
- Estimated rent
- $1,400 medium interval (Pro) →
- Mortgage (P&I)
- −$435
- Tax est. 1.5%
- −$104 /mo · $1,245/yr
- Insurance
- −$35
- HOA
- −$0
- Vacancy / Maint / Mgmt
- −$294
- Net cashflow
- $532
Break-even live
UW: 25.0% down · 7.5% · 30yr · 1.5% tax · 5.0% vac · 8.0% maint · 8.0% mgmt
Financing live
Cash to close
- Down payment
- $20,750
- Closing costs
- $2,490
- Reserves months
- —
- Total cash needed
- —
Loan-product check · same deal, 3 products live
Conventional
25% down · 7.5% · 30yr
- Down + closing
- —
- Monthly P&I
- —
- Monthly cashflow
- —
- DSCR
- —
- Eligible?
- —
Personal DTI + credit; lowest rate.
DSCR
20% down · 8.5% · 30yr
- Down + closing
- —
- Monthly P&I
- —
- Monthly cashflow
- —
- DSCR
- —
- Eligible?
- —
No personal income docs; deal must DSCR.
Hard money
10% down · 12.0% · 12mo
- Down + closing
- —
- Monthly P&I
- —
- Monthly cashflow
- —
- DSCR
- —
- Eligible?
- —
Short-term bridge; refi at stabilization.
Rent comps 1 comps
| Address | Beds | Baths | Sqft | Rent | $/sqft | DOM | Units | Dist |
|---|---|---|---|---|---|---|---|---|
| 11900 Duff Rd Lakeview, OH | 3.0 | 2.0 | 1344 | $1,400 | $1.04 | 1d | 1 | 1.19mi |
Listing history 15 events
-
2026-06-18days on market $82,999 Active 115 DOM
-
2026-06-17days on market $82,999 Active 114 DOM
-
2026-06-16days on market $82,999 Active 113 DOM
-
2026-06-15days on market $82,999 Active 112 DOM
-
2026-06-13days on market $82,999 Active 110 DOM
-
2026-06-12days on market $82,999 Active 109 DOM
-
2026-06-09days on market $82,999 Active 106 DOM
-
2026-06-08days on market $82,999 Active 105 DOM
-
2026-06-08days on market $82,999 Active 104 DOM
-
2026-06-07days on market $82,999 Active 103 DOM
-
2026-06-04days on market $82,999 Active 100 DOM
-
2026-06-02days on market $82,999 Active 99 DOM
-
2026-06-01days on market $82,999 Active 98 DOM
-
2026-05-31days on market $82,999 Active 97 DOM
-
2026-02-23$82,999 Active 999-char remark
Show marketing remark (999 chars)
Lake Life Starts Here - Holiday Shores Park at Indian Lake Welcome to easy living in Holiday Shores Park near Indian Lake! Priced at $82,999, this well-maintained 2 bedroom, 2 full bath mobile home offers comfort, convenience, and a lifestyle you'll love -- especially during the vibrant summer season. Property Features: 2 spacious bedrooms 2 full bathrooms All appliances included Large concrete driveway with plenty of parking Storage shed for extra space Nice open grass lot Covered deck -- perfect for relaxing mornings or evening gatherings Located in the heart of Holiday Shores Park at Indian Lake, you'll enjoy being close to the lake that comes alive in the summer with boating, water activities, restaurants, and local bars. Whether you're looking for a full-time residence or a weekend retreat, this home offers affordable access to lake-area living without the lakefront price. Don't miss your chance to own a slice of the Indian Lake lifestyle -- schedule your showing today!
ⓘ Source: listings_history table (triggers on properties + properties_extension) + one-shot
backfill from property_details.listing_events for pre-trigger history.
Climate risk First Street
- Flood 1/10 Low FEMA zone X (unshaded) · 0% chance over 30 yrs
- Wildfire 1/10 Low
- Heat 3/10 Moderate 7 d/yr ≥100°F today · 18 d/yr by 30 yrs out
- Wind 2/10 Low
- Air quality 2/10 Low 1 unhealthy d/yr today · 2 by 30 yrs out
Nearby sold comps map
Loading sold comps map…
Walkable amenities ~0.75 mi
Loading nearby amenities…
Taxation est. · year 1
- Rental income
- $16,800
- − Mortgage interest
- −$4,649
- − Property taxes
- −$1,245
- − Insurance
- −$415
- − Repairs & maintenance
- −$1,344
- − Management
- −$1,344
- − Depreciation
- −$2,415
- Taxable income
- $5,388
- Est. tax owed @ 24.0%
- −$1,293
- After-tax cash flow
- $5,096/yr
For passive investors: Depreciation is non-cash, so a rental often shows a tax loss while cash-flowing — sheltering income. Rental losses are passive: they offset passive income freely, and up to $25,000/yr can offset ordinary (W-2) income if you actively participate and your MAGI is under $100k (phasing out to $0 by $150k); unused losses carry forward. On sale, claimed depreciation is recaptured at up to 25%, and gains may owe capital-gains tax (a 1031 exchange can defer both). Figures are a year-1 estimate at your 24.0% rate — not tax advice; consult a CPA.
Condition & rehab AI · 12 photos
This mobile home is in average condition with cosmetic updates needed to enhance its resale value.
Repairs flagged
- Minor kitchen cabinets — slight wear
- Minor bathroom fixtures — standard fixtures
Value-add opportunities
- Resale paint interior walls — enhances curb appeal
- Resale replace carpeted flooring — improves living space
- Resale install new kitchen cabinets — modernizes kitchen
- Resale install new bathroom fixtures — enhances bathroom functionality
Renovation cost estimate screening
| Repair item | Severity | Est. cost |
|---|---|---|
| kitchen cabinets · slight wear | Minor | $500–3,000 |
| bathroom fixtures · standard fixtures | Minor | $500–3,000 |
| Total estimated repair cost · 2 items | $1,000–6,000 |
Value-add ROI direction
- Resale paint interior walls — enhances curb appeal ↑
- Resale replace carpeted flooring — improves living space ↑
- Resale install new kitchen cabinets — modernizes kitchen ↑
- Resale install new bathroom fixtures — enhances bathroom functionality ↑
ⓘ Cost ranges are severity-bucket heuristics (US national rule-of-thumb). Get contractor quotes + a written scope before underwriting a rehab budget.
Schools (NCES district)
- District
- Indian Lake Local
- NCES district ID
- 3904808
- Math proficiency
- 59% ▼ -14.00%
- Reading proficiency
- 66% ▼ -4.00%
- Median HH income
- $44,496
- Composite
- 52.6/100
- National rank
- #1559
- State rank
- #261 of 656 in OH
Livability — Lakeview
- Score
- 63/100
- State rank
- #836
- US rank
- #15632
Category grades
Schools grade is shown separately in the Schools card above.
Census & demographics
- County
- Logan · 47,256 people
- Population (ZIP)
- 4,012
- Household income
- $60,159
- Rent vs Own
- Severe rent burden
- 16.1
Population outlook (Logan County) Hauer SSP2
- Today (2025)
- 44,240 people
- By 2030
- 43,166 · -2.4%
- By 2040
- 40,495 · -8.5%
- By 2050
- 37,511 · -15.2%
- By 2075
- 30,453 · -31.2%
- By 2100
- 23,081 · -47.8%
Race, ethnicity, and origin ACS 2023
- Neighborhood character
- Predominantly White (94%)
- Race & ethnicity
- White 94% Hispanic / Latino 4% Two or more races 2% Black 1%
- Common ancestry
- Lithuanian 2% Slovak 2% Iranian 1%
- Foreign-born
- 2% · Canada
- Languages at home
- 96% English-only · Spanish 4%
Political lean MEDSL · Logan
- 2024 margin
- Solid R (+56.2) · D 21.5% · R 77.7%
- 2008→2024 swing
- -29.6pp toward R · 2008: -26.6pp · 2024: -56.2pp
- All cycles
- 2024: R+56.2 2020: R+55.2 2016: R+52.6 2012: R+31.8 2008: R+26.6
Not yet ingested
- Civics
- —
Market trends
- HPI YoY
- ▼ -109.75%
- Current HPI
- 256.2406
- Rent YoY
- —
- Metro
- —
- State GDP YoY
- ▲ 1.98%
- F500 in state
- 48
Industry mix (Fortune 500 HQ in OH)
| Industry | F500 HQs | Revenue |
|---|---|---|
| Insurance | 3 | $145B |
|
||
| Industrial Machinery | 3 | $49B |
|
||
| Financial Services | 3 | $24B |
|
||
| Consumer Goods | 2 | $93B |
|
||
| Aerospace / Defense | 2 | $47B |
|
||
| Utilities | 2 | $33B |
|
||
Price history
1 event — show timeline
- 2026-02-23 Listed $82,999 WCARE
Cash-flow waterfall
monthlySold comps — $/sqft
last 12 mo · ≤1 miLoading sold comps…