871 W Washington St · Winchester, IN
Flood risk 9/10 · Severe
- FEMA flood zone
- A
- Chance of flooding over 30 yrs
- 0.99%
- Est. flood insurance / yr
- $1,009 – $1,996
Fire risk 1/10 · Minimal
- Est. fire insurance / yr
- $717 – $1,331
Heat risk 3/10 · Minor
- Hot days now (above 100°F)
- 7 days/yr
- Hot days in 30 yrs
- 18 days/yr
Wind risk 2/10 · Minimal
- Chance of severe wind over 30 yrs
- 1.0%
Air-quality risk 3/10 · Minor
- Unhealthy air days now
- 2 days/yr
- Unhealthy air days in 30 yrs
- 4 days/yr
Risk factors via First Street. Map © Google.
Why this score? — see what drove the C- grade
The composite is a weighted blend of 9 inputs, each scored 0–100. Each bar is that input's sub-score; the figure is the points it added to the 100-point composite (weight × sub-score).
- Cash flow +15.0/30.0
- Appreciation +10.0/10.0
- ARV discount +7.5/15.0
- 1% rule +5.0/10.0
- DSCR +5.0/10.0
- Livability +3.4/5.0
- Schools +2.9/10.0
- Rent growth +2.5/5.0
- Condition / age +2.5/5.0
$1
🖨 Deal sheet 📄 Offer letter ✓ Due diligence
Listing remarks
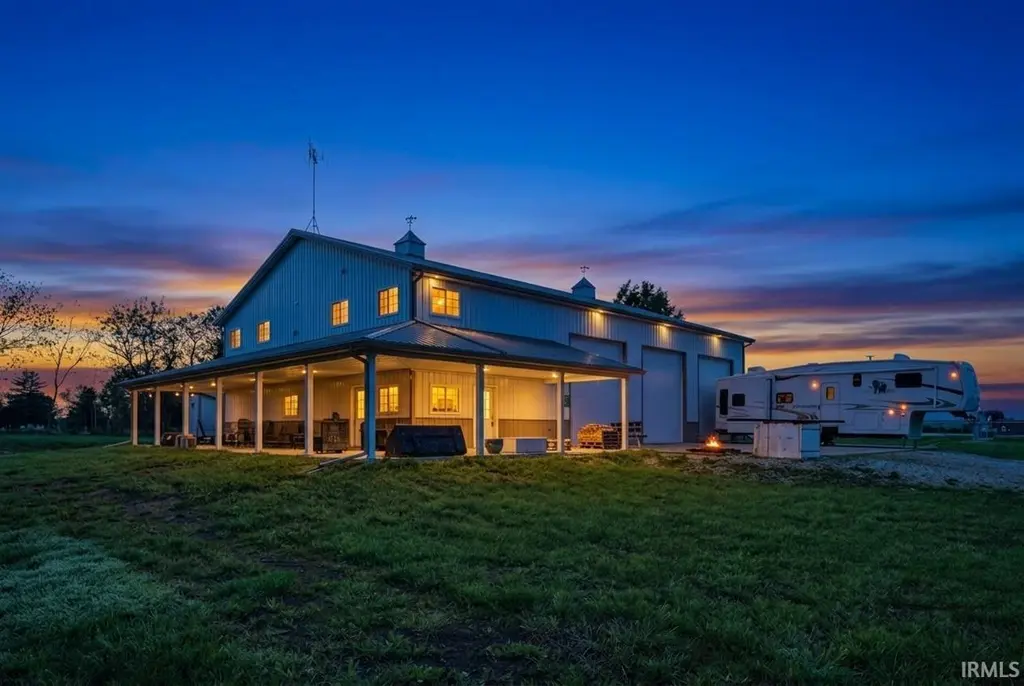
Here is a rare opportunity to secure a versatile barndominium on the desirable west edge of Winchester — a property that truly delivers the best of both worlds. Built in 2021, this 48' × 70' structure combines comfortable residential living with an exceptional heated shop under one roof, all situated on approximately four acres within the city limits of Winchester, Randolph County, Indiana. The living quarters offer 980+/- square feet of thoughtfully appointed space, while the adjoining shop spans over 2,800 heated square feet — ideal for the serious hobbyist, tradesperson, or entrepreneur seeking a professional-grade workspace just steps from home. Three oversized 14-foot
Key facts
- Barndominium
- Heated shop
- City water
Tags
Property features AI
Finance
- Other: Property is listed with Flesher Brothers Auctioneering and Real Estate Inc
- Financial info: No investor or income/expense details provided
- HOA & community: No HOA information provided
Exterior
- Parking: Attached garage with 3 parking spaces
- Security: No security details provided
- Utilities: Public water; Public sewer
- Home design: Single-family site-built residence; Single-story
- Construction: Aluminum siding; Slab foundation
- Exterior features: Irregular lot; Approximately 4 acres
Interior
- Kitchen: No kitchen appliance details provided
- Bedrooms: 3 total rooms (bedroom count not specified)
- Flooring: No flooring details provided
- Bathrooms: 1 full bathroom (main level)
- Heating & cooling: Central air; Natural gas forced air heating
- Interior features: Central air conditioning; Natural gas forced air heating; Upper-level laundry
- Laundry & utility: Laundry located on the upper level
Neighborhood map
What this means for you Summary
Snapshot
- This is a 1-bed/1.0-bath single-family listed at $1.
Deal economics
- At list price, monthly cash flow is $567 ($7k/yr) — positive.
- The deal already cash-flows at list — no discount required.
- Meets the 1% rule at list price ($876 rent vs $1).
- Cap rate 830901.0% vs local median 5.1% in Winchester — top-decile yield for the area; either an underpriced asset or a hidden risk that comps aren't pricing in. Stress-test before assuming the spread holds.
Location & tenants
- Location reads 67/100 on livability (#240 in IN) — a middle-class / working-renter tenant base. Strengths: cost of living A+, housing A+, crime B; Watch: health & safety D, amenities F, commute F.
- Randolph Central School Corporation (town): math 32% / reading 37% proficiency, ranked #201 of 301 in IN (top 67%) — families likely to look elsewhere, expect single-tenant / working-renter base with shorter leases.
- Zoned schools: Willard Elementary School (math 38% / reading 33%, grade F, #584 of 994 statewide, top 59%, 235 students, 62% FRL); Lee L Driver Middle School (math 27% / reading 33%, grade F, #208 of 330 statewide, top 64%, 291 students, 56% FRL); Winchester Community High School (math 17% / reading 47%, grade F, #295 of 369 statewide, top 82%, 414 students, 47% FRL).
- Market conditions: 52 active listings in the ZIP; 19 units permitted in Randolph County in 2024 (0 in 5+ unit buildings).
Forward outlook
- Randolph County population projected at -26% by 2050 — secular population decline; favor cash flow + early exit over multi-decade hold.
- At projected returns (10.0% appreciation + 3.0% rent growth), your $0 cash investment doubles in ~1 year — after that, you're playing with house money.
Negotiation context
- It's been on market 35 days — a 3% lower offer ($0) is reasonable based on typical stale-listing flexibility.
Risks & watch-outs
- Watch-outs: flood insurance adds $125/mo.
- Climate carrying-cost: in FEMA flood zone A (mandatory federal flood insurance) — expect insurance premiums to compound above CPI over the hold.
Questions for the listing agent
- It's been on market 35 days. Have you received any prior offers? Is the seller open to a 5% concession, seller financing, or rate buy-down credit?
- What's the actual annual flood-insurance premium (NFIP or private), and is the property in a SFHA with mandatory coverage?
- Is there a deadline driving the sale (1031 exchange, divorce, estate, relocation)? That informs how much negotiation room exists.
- Schools are D-rated, which usually means shorter tenancies and higher turnover. Who's the typical renter profile here, and what's been the actual vacancy rate?
- What's the average days-on-market for RENTAL listings here right now (not sales)? A rising rental-DOM trend means longer vacancies and softer asking-rent achievability than the comps imply.
- What's the recent tenant-quality profile in this submarket — average credit score on applications, eviction rate, late-payment / NSF rate, and stable-employment percentage? A property-management company in the area should have these aggregated.
- How much new for-sale + rental construction is in the pipeline within 1–3 miles? Heavy new supply typically softens prices + rents 12–24 months out; constrained supply supports both.
Investment metrics
- 1% rule
- 87648.00% ✓
- Cap rate
- 830901.04%
- Cash-on-cash
- 2967481.24%
- DSCR
- 132037.22
- GRM
- 0.0
CMA / ARV
- ARV (median comp)
- $95,360
- List price
- $1
- Delta
- -100.00%
- Verdict
- UNDERPRICED
- Comps
- 20 within 1.0 mi
Show comp detail 8 sales within ~0.75 mi
| Address | Dist | Beds/Ba | Sqft | Sold | Price | $/sf | Match |
|---|---|---|---|---|---|---|---|
| 315 W Orange St | 0.56mi | 2/1.0 (+1) | 948 (-3%) | 1mo | $85,000 | $90 | 63 |
| 607 W Newton St | 0.36mi | 2/1.0 (+1) | 1,025 (+5%) | 12mo | $133,400 | $130 | 60 |
| 425 Western Ave | 0.43mi | 2/1.0 (+1) | 1,008 (+3%) | 17mo | $85,000 | $84 | 56 |
| 230 W South St | 0.47mi | 2/1.0 (+1) | 1,076 (+10%) | 3mo | $63,500 | $59 | 54 |
| 216 S West St | 0.44mi | 2/1.0 (+1) | 1,096 (+12%) | 10mo | $141,000 | $129 | 47 |
| 758 S Beeson Dr | 0.73mi | 2/1.0 (+1) | 1,008 (+3%) | 17mo | $49,250 | $49 | 42 |
| 542 S Wall St | 0.54mi | 2/1.0 (+1) | 834 (-15%) | 12mo | $15,000 | $18 | 35 |
| 719 N West St | 0.73mi | 2/1.0 (+1) | 1,116 (+14%) | 9mo | $73,000 | $65 | 31 |
Match score weights: distance 35% · size 25% · config 20% · recency 20%. Top-matched comps best support the ARV.
Projected returns pro-forma
10.0% appreciation · 3.0% rent growth · sell at horizon
- IRR
- —
- Equity multiple
- 129344.72×
- Total profit
- $36,216
- Equity at exit
- $1
- IRR
- —
- Equity multiple
- 280077.05×
- Total profit
- $78,421
- Equity at exit
- $2
Cash invested: $0 (down + closing). Projections, not guarantees.
Landlord ↔ Tenant lean methodology
- Overall (STATE)
- 90 Strongly Landlord-Friendly
- State Indiana
- 90 Strongly Landlord-Friendly · R+11
- County
- — inherits STATE
- City
- — inherits STATE
ZIP-level market 47394
- Home prices YoY
- 6.8%
- Active inventory
- 52
Monthly cashflow live
- Estimated rent
- $876 medium interval (Pro) →
- Mortgage (P&I)
- −$0
- Tax est. 1.5%
- −$0 /mo · $0/yr
- Insurance
- −$0
- Flood insurance flood zone
- −$125 /mo · $1,502/yr
- HOA
- −$0
- Vacancy / Maint / Mgmt
- −$184
- Net cashflow
- $567
Break-even live
UW: 25.0% down · 7.5% · 30yr · 1.5% tax · 5.0% vac · 8.0% maint · 8.0% mgmt
Financing live
Cash to close
- Down payment
- $0
- Closing costs
- $0
- Reserves months
- —
- Total cash needed
- —
Loan-product check · same deal, 3 products live
Conventional
25% down · 7.5% · 30yr
- Down + closing
- —
- Monthly P&I
- —
- Monthly cashflow
- —
- DSCR
- —
- Eligible?
- —
Personal DTI + credit; lowest rate.
DSCR
20% down · 8.5% · 30yr
- Down + closing
- —
- Monthly P&I
- —
- Monthly cashflow
- —
- DSCR
- —
- Eligible?
- —
No personal income docs; deal must DSCR.
Hard money
10% down · 12.0% · 12mo
- Down + closing
- —
- Monthly P&I
- —
- Monthly cashflow
- —
- DSCR
- —
- Eligible?
- —
Short-term bridge; refi at stabilization.
Listing history 15 events
-
2026-06-18days on market $1 Active 35 DOM
-
2026-06-17days on market $1 Active 34 DOM
-
2026-06-16days on market $1 Active 33 DOM
-
2026-06-15days on market $1 Active 32 DOM
-
2026-06-13days on market $1 Active 30 DOM
-
2026-06-12days on market $1 Active 29 DOM
-
2026-06-09days on market $1 Active 26 DOM
-
2026-06-08days on market $1 Active 25 DOM
-
2026-06-07days on market $1 Active 24 DOM
-
2026-06-04days on market $1 Active 20 DOM
-
2026-06-02days on market $1 Active 19 DOM
-
2026-06-01days on market $1 Active 18 DOM
-
2026-05-31days on market $1 Active 17 DOM
-
2026-05-31days on market $1 Active 16 DOM
-
2026-05-14$1 Active 2044-char remark
ⓘ Source: listings_history table (triggers on properties + properties_extension) + one-shot
backfill from property_details.listing_events for pre-trigger history.
Climate risk First Street
- Flood 9/10 Extreme FEMA zone A · 99% chance over 30 yrs
- Wildfire 1/10 Low
- Heat 3/10 Moderate 7 d/yr ≥100°F today · 18 d/yr by 30 yrs out
- Wind 2/10 Low 100% chance of damaging wind over 30 yrs
- Air quality 3/10 Moderate 2 unhealthy d/yr today · 4 by 30 yrs out
Nearby sold comps map
Loading sold comps map…
Walkable amenities ~0.75 mi
Loading nearby amenities…
Taxation est. · year 1
- Rental income
- $10,518
- − Mortgage interest
- −$0
- − Property taxes
- −$0
- − Insurance
- −$1,503
- − Repairs & maintenance
- −$841
- − Management
- −$841
- − Depreciation
- −$0
- Taxable income
- $7,332
- Est. tax owed @ 24.0%
- −$1,760
- After-tax cash flow
- $5,047/yr
For passive investors: Depreciation is non-cash, so a rental often shows a tax loss while cash-flowing — sheltering income. Rental losses are passive: they offset passive income freely, and up to $25,000/yr can offset ordinary (W-2) income if you actively participate and your MAGI is under $100k (phasing out to $0 by $150k); unused losses carry forward. On sale, claimed depreciation is recaptured at up to 25%, and gains may owe capital-gains tax (a 1031 exchange can defer both). Figures are a year-1 estimate at your 24.0% rate — not tax advice; consult a CPA.
Schools (NCES district)
- District
- Randolph Central School Corporation
- NCES district ID
- 1801770
- Math proficiency
- 32% ▼ -7.00%
- Reading proficiency
- 37% ▼ -4.00%
- Median HH income
- $41,627
- Composite
- 29.12/100
- National rank
- #6589
- State rank
- #201 of 301 in IN
Livability — Winchester
- Score
- 67/100
- State rank
- #240
- US rank
- #10313
Category grades
Schools grade is shown separately in the Schools card above.
Census & demographics
- Census place
- Winchester, IN
- City population
- 8,137
- Population (ZIP)
- 8,137
Population outlook (Randolph County) Hauer SSP2
- Today (2025)
- 22,998 people
- By 2030
- 21,815 · -5.1%
- By 2040
- 19,360 · -15.8%
- By 2050
- 17,010 · -26.0%
- By 2075
- 12,491 · -45.7%
- By 2100
- 8,986 · -60.9%
Race, ethnicity, and origin ACS 2023
- Neighborhood character
- Predominantly White (96%)
- Race & ethnicity
- White 96% Two or more races 2% Hispanic / Latino 1%
- Common ancestry
- Lithuanian 2% Italian 2% Slovak 2%
- Foreign-born
- 1%
- Languages at home
- 99% English-only · Spanish 1% Other Asian/Pacific 1%
Political lean MEDSL · Randolph
- 2024 margin
- Solid R (+53.7) · D 22.3% · R 75.9% · Other 1.8%
- 2008→2024 swing
- -44.9pp toward R · 2008: -8.8pp · 2024: -53.7pp
- All cycles
- 2024: R+53.7 2020: R+52.4 2016: R+48.5 2012: R+24.1 2008: R+8.8
Not yet ingested
- Civics
- —
Market trends
- HPI YoY
- ▲ 14.76%
- Current HPI
- 233.216
- Rent YoY
- —
- Metro
- —
- State GDP YoY
- ▲ 2.90%
- F500 in state
- 18
Industry mix (Fortune 500 HQ in IN)
| Industry | F500 HQs | Revenue |
|---|---|---|
| Industrial Machinery | 2 | $37B |
|
||
| Healthcare | 1 | $177B |
|
||
| Pharmaceuticals | 1 | $45B |
|
||
| Metals / Steel | 1 | $18B |
|
||
| Agriculture | 1 | $17B |
|
||
| Packaging | 1 | $12B |
|
||
Cash-flow waterfall
monthlySold comps — $/sqft
last 12 mo · ≤1 miLoading sold comps…