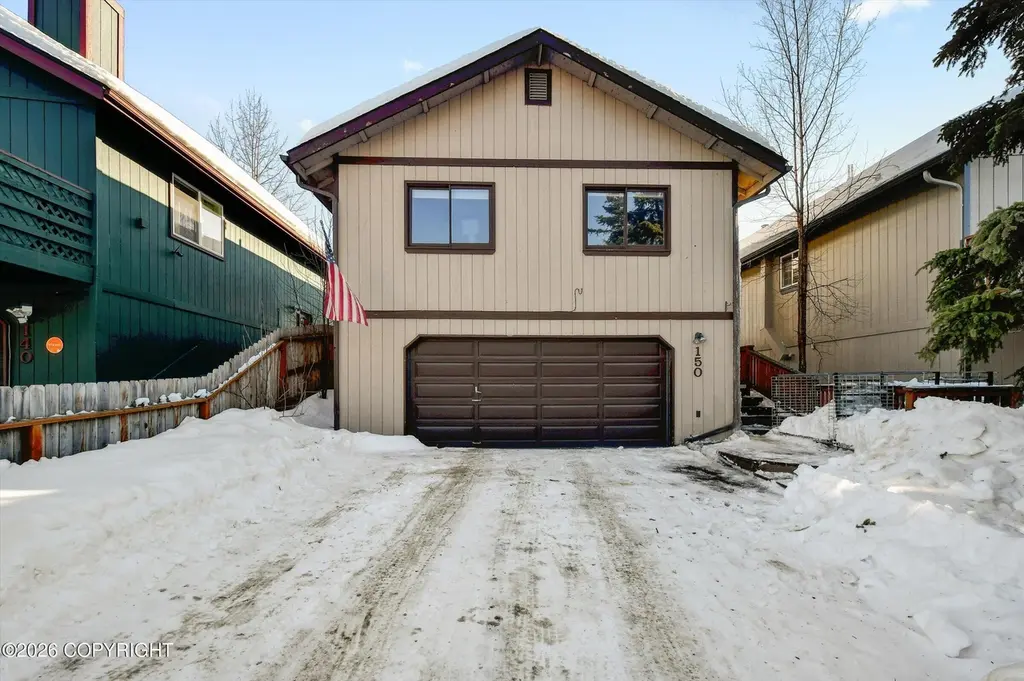
150 Sorcerer Ct · Anchorage, AK
Flood risk 1/10 · Minimal
- FEMA flood zone
- X (unshaded)
- Chance of flooding over 30 yrs
- 0.0%
- Est. flood insurance / yr
- $473 – $860
Fire risk No data
- Est. fire insurance / yr
- —
Heat risk No data
- Hot days now (above threshold)
- —
- Hot days in 30 yrs
- —
Wind risk No data
- Chance of severe wind over 30 yrs
- —
Air-quality risk 1/10 · Minimal
- Unhealthy air days now
- —
- Unhealthy air days in 30 yrs
- —
Risk factors via First Street. Map © Google.
Why this score? — see what drove the D grade
The composite is a weighted blend of 9 inputs, each scored 0–100. Each bar is that input's sub-score; the figure is the points it added to the 100-point composite (weight × sub-score).
- ARV discount +11.2/15.0
- Appreciation +8.1/10.0
- Cash flow +7.7/30.0
- Livability +3.9/5.0
- Schools +3.7/10.0
- 1% rule +2.6/10.0
- Rent growth +2.5/5.0
- Condition / age +2.5/5.0
- DSCR +1.8/10.0
$319,900
🖨 Deal sheet 📄 Offer letter ✓ Due diligence
Listing remarks
Great opportunity to build equity and make this home your own. Featuring 4 bedrooms, 2 bathrooms, and a fenced yard, this property offers solid bones and strong potential. The living area is filled with natural light, and the deck is perfectly positioned to enjoy the sun. Ready for cosmetic updates and your personal touch. Tenant occupied through May 31.
Key facts
- 3,400 sq ft lot
- 2 garage spots
- Built 1986
Neighborhood map
What this means for you Summary
Snapshot
- This is a 4-bed/2.0-bath single-family listed at $320k.
Deal economics
- At list price, monthly cash flow is $-365 ($-4k/yr) — negative.
- To cash-flow at today's rent, offer at most $255k (20.1% below list).
- To meet the 1% rule (rent ≥ 1% of price), the offer needs to be $244k (23.8% below list).
- Recommended offer: $244k (23.8% below list) — sets the bar for 1% rule.
- Cap rate 4.9% vs local median 3.8% in Anchorage — meaningfully above typical; check what's discounted (condition, days-on-market, listing class) to confirm the premium yield is real.
Location & tenants
- Location reads 78/100 on livability (#6 in AK, #2,553 nationally) — a middle-class / working-renter tenant base. Strengths: amenities A+, commute A+, employment A+; Watch: crime F, cost of living F.
- Anchorage School District (urban): math 37% / reading 43% proficiency, ranked #6 of 21 in AK (top 29%) — families likely to look elsewhere, expect single-tenant / working-renter base with shorter leases.
- Zoned schools: Taku Elementary (math 22% / reading 27%, grade F, #122 of 156 statewide, top 81%, 286 students, 72% FRL); Hanshew Middle School (math 24% / reading 37%, grade F, #27 of 36 statewide, top 74%, 691 students, 42% FRL); Service High School (math 40% / reading 41%, grade F, #21 of 61 statewide, top 33%, 1,544 students, 28% FRL).
- Market conditions: 49 active listings in the ZIP; 4 comparable units currently listed for rent nearby; rentals lingering (median 44d on market — plan ~5-8 weeks vacancy on turnover, expect pricing pressure); 50% of comp listings sitting > 30 days — soft ceiling on asking rent; solid renter incomes; 306 units permitted in Anchorage Municipality in 2024 (90 in 5+ unit buildings).
- This rent runs 31% of the median local income ($94k/yr) — at the standard rent-burdened threshold; future hikes will face affordability resistance.
Forward outlook
- In year one you build about $22k of equity ($2k loan paydown + $20k appreciation (6.2% local appreciation)).
- Anchorage County population projected at +12% by 2050 — modest demand growth; plan on rents tracking national, not racing it.
- By year 2, paydown + projected appreciation supports a ~$35k cash-out refi (75% LTV) — recoverable capital for the next deal without selling this one.
Negotiation context
- Only 3 days on market — expect competitive offers; lowballing is unlikely to land.
- 4 sale attempts since 15y ago with the ask held roughly flat each time — persistent listings suggest the price (not the market) is what's stuck; bring a comps-based counter.
Questions for the listing agent
- What do current leases actually rent for vs. the listed asking? Can we see a recent rent roll and the last 12 months of T-12 income?
- Is there a deadline driving the sale (1031 exchange, divorce, estate, relocation)? That informs how much negotiation room exists.
- Schools are B-rated — typically a magnet for longer-tenancy family renters. What's the average tenant stay here, and is there a school-zone premium baked into asking?
- Crime grade is F in this area — have there been break-ins, vandalism, or insurance claims at this property in the last 3 years? What carrier currently insures it and at what premium?
- The area grade is low — what's the realistic commute time and amenity access for the typical tenant pool here? Any planned neighborhood developments (good or bad) we should know about?
- What's the average days-on-market for RENTAL listings here right now (not sales)? A rising rental-DOM trend means longer vacancies and softer asking-rent achievability than the comps imply.
- What's the recent tenant-quality profile in this submarket — average credit score on applications, eviction rate, late-payment / NSF rate, and stable-employment percentage? A property-management company in the area should have these aggregated.
- How much new for-sale + rental construction is in the pipeline within 1–3 miles? Heavy new supply typically softens prices + rents 12–24 months out; constrained supply supports both.
Investment metrics
- 1% rule
- 0.76% ✗
- Cap rate
- 4.92%
- Cash-on-cash
- -4.89%
- DSCR
- 0.78
- GRM
- 10.9
CMA / ARV
- ARV (on-the-fly)
- $348,432
- Comps found
- 12
Show comp detail 12 sales within ~0.75 mi
| Address | Dist | Beds/Ba | Sqft | Sold | Price | $/sf | Match |
|---|---|---|---|---|---|---|---|
| 150 Sorcerer Ct | 0.00mi | 4/2.0 | 1,464 (0%) | 0mo | $319,900 | $219 | 100 |
| 8224 Rainy Pl | 0.12mi | 3/1.5 (-1) | 1,400 (-4%) | 18mo | $105,000 | $75 | 65 |
| 8017 Fairwood Cir | 0.56mi | 3/2.5 (-1) | 1,444 (-1%) | 12mo | $364,200 | $252 | 54 |
| 904 Jayme Ct | 0.57mi | 3/1.5 (-1) | 1,566 (+7%) | 1mo | $235,000 | $150 | 54 |
| 7835 Highlander Dr | 0.31mi | 3/2.5 (-1) | 1,645 (+12%) | 6mo | $369,000 | $224 | 52 |
| 7800 Rovenna St | 0.70mi | 3/2.5 (-1) | 1,344 (-8%) | 0mo | $350,000 | $260 | 47 |
| 931 Jayme Ct | 0.60mi | 3/2.0 (-1) | 1,534 (+5%) | 15mo | $305,000 | $199 | 46 |
| 7810 Linda Ln | 0.58mi | 3/2.0 (-1) | 1,574 (+8%) | 13mo | $375,000 | $238 | 45 |
| 819 W 76th Ave | 0.58mi | 4/2.0 | 1,644 (+12%) | 10mo | $434,900 | $265 | 44 |
| 1028 W 80th Ave | 0.62mi | 3/1.5 (-1) | 1,267 (-14%) | 4mo | $310,000 | $245 | 38 |
| 7600 Evander Dr | 0.41mi | 3/2.0 (-1) | 1,664 (+14%) | 20mo | $348,000 | $209 | 36 |
| 7760 Lars Cir | 0.75mi | 3/2.5 (-1) | 1,344 (-8%) | 12mo | $338,000 | $251 | 35 |
Match score weights: distance 35% · size 25% · config 20% · recency 20%. Top-matched comps best support the ARV.
Projected returns pro-forma
6.2% appreciation · 3.0% rent growth · sell at horizon
- IRR
- 11.9%
- Equity multiple
- 1.81×
- Total profit
- $72,931
- Equity at exit
- $205,050
- IRR
- 12.7%
- Equity multiple
- 3.59×
- Total profit
- $231,930
- Equity at exit
- $375,304
Cash invested: $89,572 (down + closing). Projections, not guarantees.
Landlord ↔ Tenant lean methodology
- Overall (STATE)
- 80 Strongly Landlord-Friendly
- State Alaska
- 80 Strongly Landlord-Friendly · R+8
- County
- — inherits STATE
- City
- — inherits STATE
ZIP-level market 99518
- Home prices YoY
- 2.1%
- Active inventory
- 49
- Price-to-rent
- 10.9×
Monthly cashflow live
- Estimated rent
- $2,436 medium interval (Pro) →
- Mortgage (P&I)
- −$1,678
- Tax from tax record
- −$478 /mo · $5,740/yr
- Insurance
- −$133
- HOA
- −$0
- Vacancy / Maint / Mgmt
- −$512
- Net cashflow
- $-365
Break-even live
UW: 25.0% down · 7.5% · 30yr · 1.5% tax · 5.0% vac · 8.0% maint · 8.0% mgmt
Financing live
Cash to close
- Down payment
- $79,975
- Closing costs
- $9,597
- Reserves months
- —
- Total cash needed
- —
Loan-product check · same deal, 3 products live
Conventional
25% down · 7.5% · 30yr
- Down + closing
- —
- Monthly P&I
- —
- Monthly cashflow
- —
- DSCR
- —
- Eligible?
- —
Personal DTI + credit; lowest rate.
DSCR
20% down · 8.5% · 30yr
- Down + closing
- —
- Monthly P&I
- —
- Monthly cashflow
- —
- DSCR
- —
- Eligible?
- —
No personal income docs; deal must DSCR.
Hard money
10% down · 12.0% · 12mo
- Down + closing
- —
- Monthly P&I
- —
- Monthly cashflow
- —
- DSCR
- —
- Eligible?
- —
Short-term bridge; refi at stabilization.
Rent comps 4 comps
| Address | Beds | Baths | Sqft | Rent | $/sqft | DOM | Units | Dist |
|---|---|---|---|---|---|---|---|---|
| 1008 W 80th Ave Anchorage, AK | 3.0 | 1.5 | 1267 | $2,400 | $1.89 | 43d | 1 | 0.60mi |
| 6388 Fairweather Dr Anchorage, AK | 3.0 | 2.0 | 1372 | $2,500 | $1.82 | 43d | 1 | 1.07mi |
| 9905 William Jones Cir Anchorage, AK | 2.0–3.0 | 1.5–2.0 | 1171 | $2,595 | $2.22 | 13d | 10 | 1.28mi |
| 5911 Denali St Unit B2 Anchorage, AK | 3.0 | 1.5 | 1100 | $1,700 | $1.55 | 23d | 1 | 1.41mi |
Listing history 11 events
-
2026-04-10status Pending
-
2026-04-06$319,900 Active
-
2015-04-29soldstatus
-
2015-03-13$279,000
-
2011-12-16soldstatus
-
2011-11-04$240,000
-
2011-09-03$244,000
-
2005-12-02soldstatus
-
2004-05-20soldstatus
-
2004-04-19soldstatus
-
1990-06-05soldstatus
ⓘ Source: listings_history table (triggers on properties + properties_extension) + one-shot
backfill from property_details.listing_events for pre-trigger history.
Tax reassessment forecast AK · Partial reset (capped growth)
- Current annual tax
- $5,740 · $478/mo
- Projected year-2 tax
- $5,740 · $478/mo
- Expected delta
- $0/yr ($0/mo · 0.0%)
ⓘ Screening estimate from a state-policy table — verify with the county assessor before closing.
Climate risk First Street
- Flood 1/10 Low FEMA zone X (unshaded) · 0% chance over 30 yrs
- Air quality 1/10 Low
Nearby sold comps map
Loading sold comps map…
Walkable amenities ~0.75 mi
Loading nearby amenities…
Taxation est. · year 1
- Rental income
- $29,233
- − Mortgage interest
- −$17,919
- − Property taxes
- −$5,740
- − Insurance
- −$1,600
- − Repairs & maintenance
- −$2,339
- − Management
- −$2,339
- − Depreciation
- −$9,306
- Taxable loss
- −$10,009
- Est. tax savings @ 24.0%
- +$2,402
- After-tax cash flow
- $-1,974/yr
For passive investors: Depreciation is non-cash, so a rental often shows a tax loss while cash-flowing — sheltering income. Rental losses are passive: they offset passive income freely, and up to $25,000/yr can offset ordinary (W-2) income if you actively participate and your MAGI is under $100k (phasing out to $0 by $150k); unused losses carry forward. On sale, claimed depreciation is recaptured at up to 25%, and gains may owe capital-gains tax (a 1031 exchange can defer both). Figures are a year-1 estimate at your 24.0% rate — not tax advice; consult a CPA.
Schools (NCES district)
- District
- Anchorage School District
- NCES district ID
- 0200180
- Math proficiency
- 37% ▼ -2.00%
- Reading proficiency
- 43% ▲ 1.00%
- Median HH income
- $76,447
- Composite
- 37.0/100
- National rank
- #4523
- State rank
- #6 of 21 in AK
Livability — Anchorage
- Score
- 78/100
- State rank
- #6
- US rank
- #2553
Category grades
Schools grade is shown separately in the Schools card above.
Census & demographics
- Census place
- Anchorage, AK
- County
- Anchorage Borough · 246,594 people
- City population
- 218,117
- Metro
- Anchorage, AK
- Population (ZIP)
- 9,764
- Household income
- $93,995
- Rent vs Own
- Severe rent burden
- 385.0
Population outlook (Anchorage County) Hauer SSP2
- Today (2025)
- 314,993 people
- By 2030
- 321,771 · +2.2%
- By 2040
- 335,493 · +6.5%
- By 2050
- 352,799 · +12.0%
- By 2075
- 414,771 · +31.7%
- By 2100
- 474,485 · +50.6%
Race, ethnicity, and origin ACS 2023
- Neighborhood character
- Diverse neighborhood (Simpson 0.67)
- Race & ethnicity
- White 56% Two or more races 17% Hispanic / Latino 12% Black 7% Native American 5% Asian 4%
- Hispanic origin (detail)
- Mexican 6% Puerto Rican 1%
- Common ancestry
- Portuguese 4% Lithuanian 2% Romanian 2%
- Foreign-born
- 6% · Canada, South Korea, China
- Languages at home
- 91% English-only · Spanish 5% Tagalog/Filipino 2% Korean 1%
Political lean MEDSL · Anchorage
- 2024 margin
- D (+12.7) · D 56.3% · R 43.7%
- 2016→2024 swing
- +27.9pp toward D · 2016: -15.2pp · 2024: 12.7pp
- All cycles
- 2024: D+12.7 2016: R+15.2
Not yet ingested
- Civics
- —
Market trends
- HPI YoY
- ▲ 6.20%
- Current HPI
- 294.8217
- Rent YoY
- —
- Metro
- Anchorage, AK
- State GDP YoY
- —
- F500 in state
- 0
Price history
+31.1% since first listed11 events — show timeline
- 2026-04-10 Pending — AKMLS
- 2026-04-06 Listed $319,900 AKMLS
- 2015-04-29 Sold (Public Records) — Public Records
- 2015-03-13 Listed $279,000 AKMLS
- 2011-12-16 Sold (Public Records) — Public Records
- 2011-11-04 Listed $240,000 AKMLS
- 2011-09-03 Listed $244,000 AKMLS
- 2005-12-02 Sold (Public Records) — Public Records
- 2004-05-20 Sold (Public Records) — Public Records
- 2004-04-19 Sold (Public Records) — Public Records
- 1990-06-05 Sold (Public Records) — Public Records
Property tax history
+5.1%/yrLatest (2025): $5,740 · +4.7% YoY. Source: county tax records.
Cash-flow waterfall
monthlySold comps — $/sqft
last 12 mo · ≤1 miLoading sold comps…