 Triplex
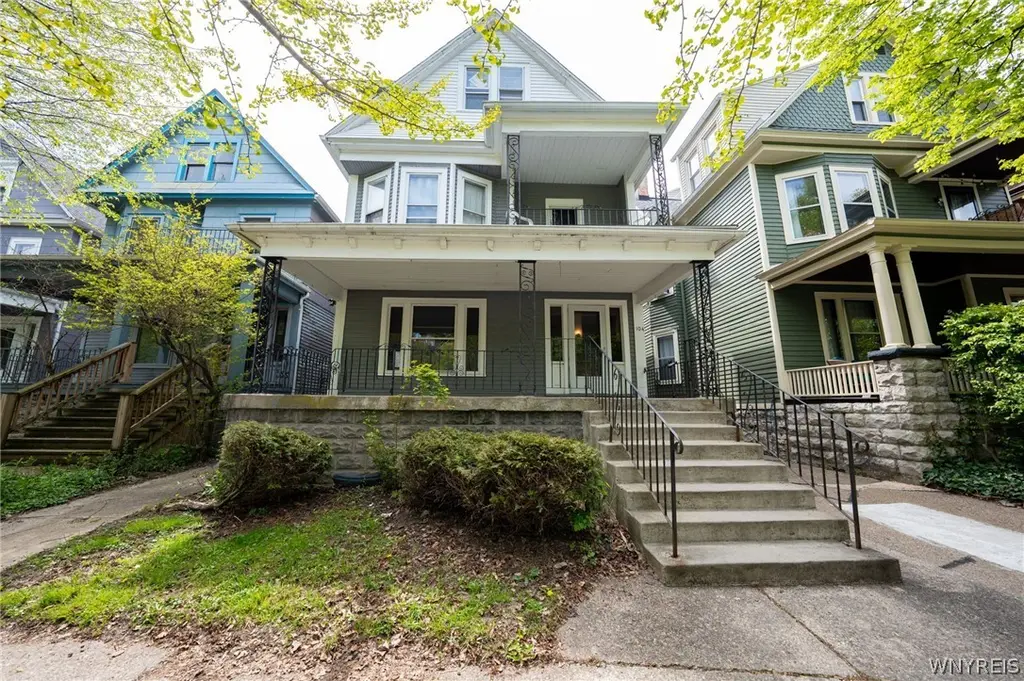
104 Claremont Ave · Buffalo, NY
Flood risk 1/10 · Minimal
- FEMA flood zone
- X (unshaded)
- Chance of flooding over 30 yrs
- 0.0%
- Est. flood insurance / yr
- $473 – $860
Fire risk 1/10 · Minimal
- Est. fire insurance / yr
- $691 – $1,283
Heat risk 3/10 · Minor
- Hot days now (above 91°F)
- 7 days/yr
- Hot days in 30 yrs
- 15 days/yr
Wind risk 1/10 · Minimal
- Chance of severe wind over 30 yrs
- —
Air-quality risk 4/10 · Minor
- Unhealthy air days now
- 4 days/yr
- Unhealthy air days in 30 yrs
- 9 days/yr
Risk factors via First Street. Map © Google.
Why this score? — see what drove the B- grade
The composite is a weighted blend of 9 inputs, each scored 0–100. Each bar is that input's sub-score; the figure is the points it added to the 100-point composite (weight × sub-score).
- Cash flow +26.0/30.0
- ARV discount +12.2/15.0
- DSCR +8.7/10.0
- 1% rule +5.7/10.0
- Livability +3.9/5.0
- Rent growth +3.7/5.0
- Schools +3.3/10.0
- Condition / age +2.5/5.0
- Appreciation +0.0/10.0
$475,000
🖨 Deal sheet 📄 Offer letter ✓ Due diligence
Multi-family units
County records classify this as Multi-Family (2-4 Unit). Listing-text estimate: 3 units. confirmed
Listing remarks
This Owner-occupied 3-unit in the heart of Buffalo’s vibrant West Side presents an exceptional opportunity to own a professionally managed multi-unit property. Meticulously maintained throughout ownership, this property reflects true pride of ownership with thoughtful recent updates throughout, while preserving the timeless character and architectural charm Buffalo homes are known for. Lower unit was owner-occupied for years and has recently undergone extensive updates following the owner’s departure, including a bathroom remodel and beautifully updated kitchen with brand new appliances completely untouched and ready for its next owner or tenant. The third unit has also been ful
Key facts
- Fully renovated
- Recent updates
- Brand new appliances
Tags
Property features AI
Finance
- Other: Three total units with separate gas and electric meters for each unit
- Financial info: Owner pays water; water included in rent; Operating expenses include manager, professional management, and water/sewer
Exterior
- Parking: No driveway; on-street parking
- Utilities: Public water connected; Sewer connected
- Home design: Two-story building; Resale property; Cedar and wood siding exterior
- Construction: Cedar and wood siding construction
- Exterior features: Rectangular residential lot with 30 x 135 dimensions; City street frontage
Interior
- Flooring: Hardwood; Luxury vinyl; Tile; Varies
- Bathrooms: Three full bathrooms
- Heating & cooling: Gas baseboard heating
- Interior features: Hardwood, luxury vinyl, tile and varied flooring throughout; Full basement
- Laundry & utility: Gas water heater
Neighborhood map
What this means for you Summary
Snapshot
- This is a 3 × 3-bed/1.0-bath units multifamily listed at $475k.
Deal economics
- At list price, monthly cash flow is $1k ($14k/yr) — positive. Per door: $392/mo.
- The deal already cash-flows at list — no discount required.
- Meets the 1% rule at list price ($5k rent vs $475k).
Location & tenants
- Location reads 77/100 on livability (#195 in NY, #3,011 nationally) — a middle-class / working-renter tenant base. Strengths: commute A+, housing A+, health & safety A+; Watch: crime F, employment D-.
- Buffalo City School District (urban): math 41% / reading 40% proficiency, ranked #535 of 590 in NY (top 91%) — families likely to look elsewhere, expect single-tenant / working-renter base with shorter leases; 75% free/reduced lunch — lower-income household profile, screen leases tightly.
- Market conditions: Rents rising fast (+4.7%/yr); 63 active listings in the ZIP; solid renter incomes; 1,244 units permitted in Erie County in 2024 (563 in 5+ unit buildings).
- At $5,064/mo this rent would consume 74% of the median local household income ($82k/yr) (locally 978% of renters already pay >50% of income on rent) — very limited rent-growth headroom before tenants either downsize or default.
Forward outlook
- Local home prices are declining (-3.0%/yr); year-one equity from $3k of loan paydown is wiped out by about $14k of value loss. Plan a longer hold.
- At projected returns (-3.0% appreciation + 4.7% rent growth), your $133k cash investment doubles in ~9 years — after that, you're playing with house money.
Negotiation context
- Only 11 days on market — expect competitive offers; lowballing is unlikely to land.
- Current owner paid $350k; 36% above their basis — modest negotiation headroom, anchor on the comps not their cost.
Risks & watch-outs
- Watch-outs: built in 1900 — expect roof / HVAC / electrical / plumbing capex.
Questions for the listing agent
- Can we see the unit-by-unit rent roll, current vacancy, and any below-market leases? What's the average tenancy length?
- What capital expenditures (roof, boiler, parking lot, exteriors) have been made in the last 5 years, and what's planned in the next 2?
- Built in 1900 — when were the roof, HVAC, electrical panel, plumbing, and water heater last replaced?
- Is there a deadline driving the sale (1031 exchange, divorce, estate, relocation)? That informs how much negotiation room exists.
- Crime grade is F in this area — have there been break-ins, vandalism, or insurance claims at this property in the last 3 years? What carrier currently insures it and at what premium?
- What's the average days-on-market for RENTAL listings here right now (not sales)? A rising rental-DOM trend means longer vacancies and softer asking-rent achievability than the comps imply.
- What's the recent tenant-quality profile in this submarket — average credit score on applications, eviction rate, late-payment / NSF rate, and stable-employment percentage? A property-management company in the area should have these aggregated.
- How much new apartment / multifamily construction is in the pipeline within 1–3 miles? Heavy new supply (>2% of stock underway) typically softens rents 12–24 months out; light construction supports rent growth.
Investment metrics
- 1% rule
- 1.07% ✓
- Cap rate
- 9.26%
- Cash-on-cash
- 10.61%
- DSCR
- 1.47
- GRM
- 7.8
CMA / ARV
- ARV (on-the-fly)
- $530,176
- Comps found
- 9
Show comp detail 9 sales within ~0.75 mi
| Address | Dist | Beds/Ba | Sqft | Sold | Price | $/sf | Match |
|---|---|---|---|---|---|---|---|
| 417 W Delavan Ave | 0.30mi | 6/3.0 (-1) | 3,566 (+2%) | 5mo | $451,000 | $126 | 73 |
| 388 Lafayette Ave | 0.38mi | 8/3.0 (+1) | 3,539 (+2%) | 9mo | $520,000 | $147 | 67 |
| 54 Granger Pl | 0.26mi | 6/3.0 (-1) | 3,650 (+5%) | 12mo | $570,000 | $156 | 65 |
| 637 W Delavan Ave Unit S | 0.31mi | 6/2.0 (-1) | 3,020 (-13%) | 1mo | $460,000 | $152 | 54 |
| 452 Potomac Ave | 0.15mi | 6/2.0 (-1) | 2,976 (-15%) | 11mo | $450,000 | $151 | 51 |
| 530 W Ferry St Unit N | 0.65mi | 7/3.5 | 3,803 (+9%) | 4mo | $749,000 | $197 | 49 |
| 738 Auburn Ave | 0.55mi | 7/3.0 | 3,174 (-9%) | 12mo | $575,000 | $181 | 49 |
| 610 Ashland Ave | 0.25mi | 6/2.0 (-1) | 3,050 (-13%) | 16mo | $450,000 | $148 | 45 |
| 428 Norwood Ave | 0.59mi | 7/3.0 | 3,114 (-11%) | 18mo | $658,250 | $211 | 40 |
Match score weights: distance 35% · size 25% · config 20% · recency 20%. Top-matched comps best support the ARV.
Projected returns pro-forma
-3.0% appreciation · 4.69% rent growth · sell at horizon
- IRR
- 1.3%
- Equity multiple
- 1.05×
- Total profit
- $6,466
- Equity at exit
- $70,824
- IRR
- 12.3%
- Equity multiple
- 2.04×
- Total profit
- $138,416
- Equity at exit
- $41,069
Cash invested: $133,000 (down + closing). Projections, not guarantees.
Landlord ↔ Tenant lean methodology
- Overall (STATE)
- 15 Strongly Tenant-Friendly
- State New York
- 15 Strongly Tenant-Friendly · D+10
- County
- — inherits STATE
- City
- — inherits STATE
ZIP-level market 14222
- Home prices YoY
- -31.4%
- Rents YoY
- 4.7%
- Active inventory
- 63
- Price-to-rent
- 23.4×
Monthly cashflow live
- Estimated rent
- $5,064 high interval (Pro) →
- Mortgage (P&I)
- −$2,491
- Tax from tax record
- −$136 /mo · $1,631/yr
- Insurance
- −$198
- HOA
- −$0
- Vacancy / Maint / Mgmt
- −$1,063
- Net cashflow
- $1,176
Break-even live
3-unit breakdown (identical units grouped — click to expand)
| Units | Beds | Baths | Est. rent |
|---|---|---|---|
| 3× units | 3 | 1 | $5,064 |
| #1 | 3 | 1 | $1,688 |
| #2 | 3 | 1 | $1,688 |
| #3 | 3 | 1 | $1,688 |
| Total (3 units) | $5,064 | ||
UW: 25.0% down · 7.5% · 30yr · 1.5% tax · 5.0% vac · 8.0% maint · 8.0% mgmt
Financing live
Cash to close
- Down payment
- $118,750
- Closing costs
- $14,250
- Reserves months
- —
- Total cash needed
- —
Loan-product check · same deal, 3 products live
Conventional
25% down · 7.5% · 30yr
- Down + closing
- —
- Monthly P&I
- —
- Monthly cashflow
- —
- DSCR
- —
- Eligible?
- —
Personal DTI + credit; lowest rate.
DSCR
20% down · 8.5% · 30yr
- Down + closing
- —
- Monthly P&I
- —
- Monthly cashflow
- —
- DSCR
- —
- Eligible?
- —
No personal income docs; deal must DSCR.
Hard money
10% down · 12.0% · 12mo
- Down + closing
- —
- Monthly P&I
- —
- Monthly cashflow
- —
- DSCR
- —
- Eligible?
- —
Short-term bridge; refi at stabilization.
Listing history 2 events
-
2026-05-18$475,000 Active
-
2017-10-23soldstatus $350,000
ⓘ Source: listings_history table (triggers on properties + properties_extension) + one-shot
backfill from property_details.listing_events for pre-trigger history.
Tax reassessment forecast NY · Partial reset (capped growth)
- Current annual tax
- $1,631 · $136/mo
- Projected year-2 tax
- $4,829 · $402/mo
- Expected delta
- +$3,198/yr (+$267/mo · 196.1%)
ⓘ Screening estimate from a state-policy table — verify with the county assessor before closing.
Climate risk First Street
- Flood 1/10 Low FEMA zone X (unshaded) · 0% chance over 30 yrs
- Wildfire 1/10 Low
- Heat 3/10 Moderate 7 d/yr ≥91°F today · 15 d/yr by 30 yrs out
- Wind 1/10 Low
- Air quality 4/10 Moderate 4 unhealthy d/yr today · 9 by 30 yrs out
Nearby sold comps map
Loading sold comps map…
Walkable amenities ~0.75 mi
Loading nearby amenities…
Taxation est. · year 1
- Rental income
- $60,768
- − Mortgage interest
- −$26,607
- − Property taxes
- −$1,631
- − Insurance
- −$2,375
- − Repairs & maintenance
- −$4,861
- − Management
- −$4,861
- − Depreciation
- −$13,818
- Taxable income
- $6,614
- Est. tax owed @ 24.0%
- −$1,587
- After-tax cash flow
- $12,522/yr
For passive investors: Depreciation is non-cash, so a rental often shows a tax loss while cash-flowing — sheltering income. Rental losses are passive: they offset passive income freely, and up to $25,000/yr can offset ordinary (W-2) income if you actively participate and your MAGI is under $100k (phasing out to $0 by $150k); unused losses carry forward. On sale, claimed depreciation is recaptured at up to 25%, and gains may owe capital-gains tax (a 1031 exchange can defer both). Figures are a year-1 estimate at your 24.0% rate — not tax advice; consult a CPA.
Schools (NCES district)
- District
- Buffalo City School District
- NCES district ID
- 3605850
- Math proficiency
- 41% ▲ 11.00%
- Reading proficiency
- 40% ▲ 7.00%
- Median HH income
- $31,665
- Composite
- 33.17/100
- National rank
- #5544
- State rank
- #535 of 590 in NY
Livability — Buffalo
- Score
- 77/100
- State rank
- #195
- US rank
- #3011
Category grades
Schools grade is shown separately in the Schools card above.
Census & demographics
- Census place
- Buffalo, NY
- County
- Erie County · 714,559 people
- City population
- 440,021
- Metro
- Buffalo-Cheektowaga, NY
- Population (ZIP)
- 15,311
- Household income
- $81,652
- Rent vs Own
- Severe rent burden
- 978.0
Population outlook (Erie County) Hauer SSP2
- Today (2025)
- 933,037 people
- By 2030
- 935,181 · +0.2%
- By 2040
- 928,531 · -0.5%
- By 2050
- 905,725 · -2.9%
- By 2075
- 834,037 · -10.6%
- By 2100
- 708,033 · -24.1%
Race, ethnicity, and origin ACS 2023
- Neighborhood character
- Predominantly White (74%)
- Race & ethnicity
- White 74% Black 11% Hispanic / Latino 8% Two or more races 7% Asian 2%
- Hispanic origin (detail)
- Mexican 1% Puerto Rican 3%
- Common ancestry
- Romanian 13% Lithuanian 2% Slovak 2%
- Foreign-born
- 7% · Canada, Vietnam, Jamaica
- Languages at home
- 89% English-only · Spanish 3% German/W. Germanic 2% French/Haitian/Cajun 1%
Political lean MEDSL · Erie
- 2024 margin
- Lean D (+9.7) · D 54.8% · R 45.2%
- 2008→2024 swing
- -7.9pp toward R · 2008: 17.5pp · 2024: 9.7pp
- All cycles
- 2024: D+9.7 2020: D+14.7 2016: D+4.8 2012: D+15.6 2008: D+17.5
Not yet ingested
- Civics
- —
Market trends
- HPI YoY
- ▼ -205.10%
- Current HPI
- 448.3711
- Rent YoY
- ▲ 4.69%
- Metro
- Buffalo-Cheektowaga, NY
- State GDP YoY
- ▲ 2.60%
- F500 in state
- 92
Industry mix (Fortune 500 HQ in NY)
| Industry | F500 HQs | Revenue |
|---|---|---|
| Financial Services | 10 | $950B |
|
||
| Consumer Goods | 9 | $162B |
|
||
| Insurance | 4 | $225B |
|
||
| Telecommunications | 2 | $144B |
|
||
| Pharmaceuticals | 2 | $112B |
|
||
| Media / Entertainment | 2 | $69B |
|
||
Price history
+35.7% since first listed2 events — show timeline
- 2026-05-18 Listed $475,000 WNYREIS
- 2017-10-23 Sold (Public Records) $350,000 Public Records
Property tax history
+5.9%/yrLatest (2025): $1,631 · +0.0% YoY. Source: county tax records.
Cash-flow waterfall
monthlySold comps — $/sqft
last 12 mo · ≤1 miLoading sold comps…