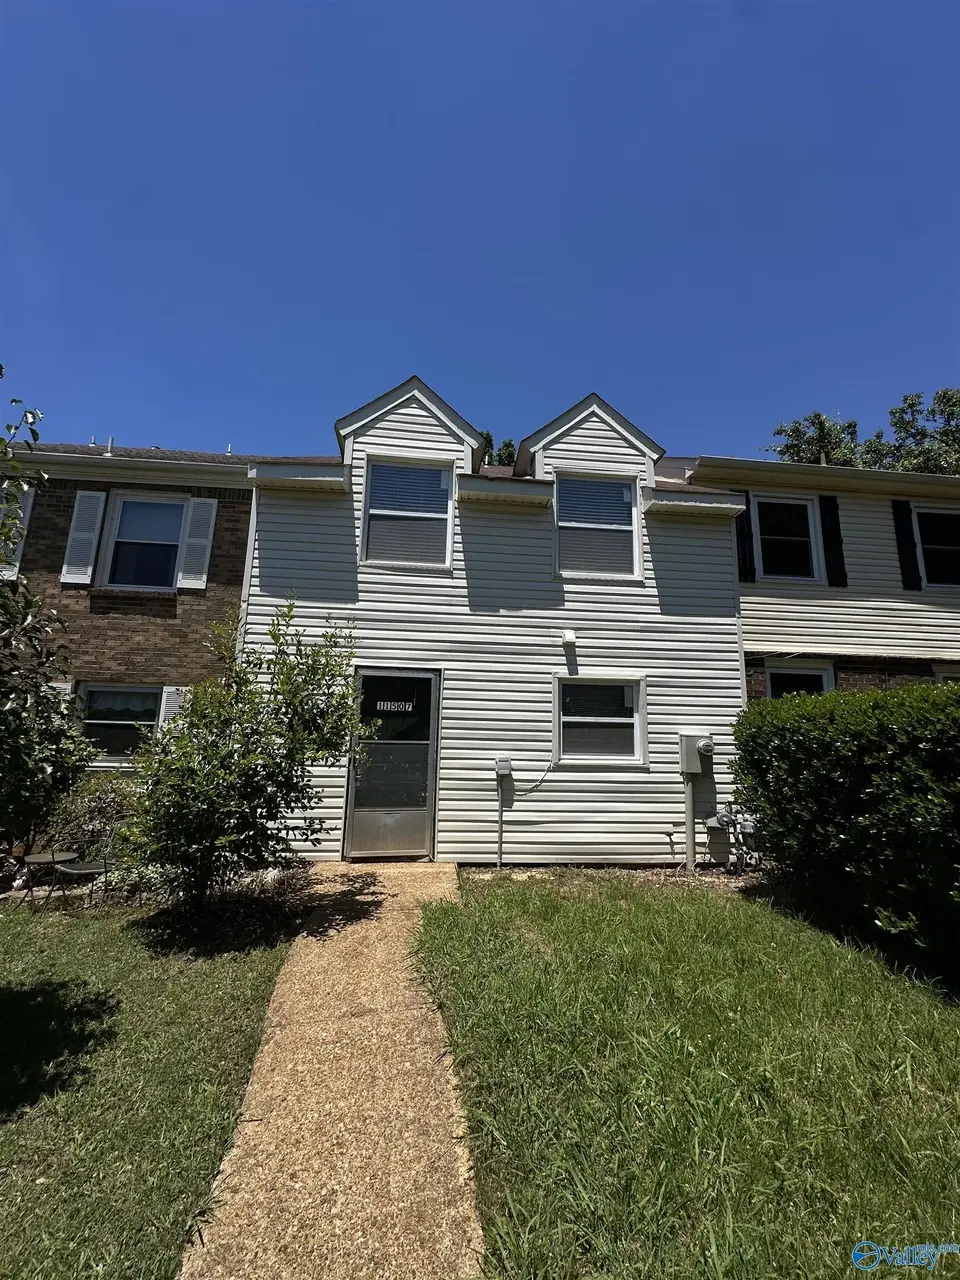
11507 Jade Ln · Huntsville, AL
Flood risk 1/10 · Minimal
- FEMA flood zone
- X (unshaded)
- Chance of flooding over 30 yrs
- 0.0%
- Est. flood insurance / yr
- $507 – $1,088
Fire risk 3/10 · Minor
- Est. fire insurance / yr
- $916 – $1,700
Heat risk 6/10 · Moderate
- Hot days now (above 105°F)
- 7 days/yr
- Hot days in 30 yrs
- 21 days/yr
Wind risk 4/10 · Minor
- Chance of severe wind over 30 yrs
- 19.0%
Air-quality risk 2/10 · Minimal
- Unhealthy air days now
- 1 days/yr
- Unhealthy air days in 30 yrs
- 2 days/yr
Risk factors via First Street. Map © Google.
Why this score? — see what drove the D grade
The composite is a weighted blend of 9 inputs, each scored 0–100. Each bar is that input's sub-score; the figure is the points it added to the 100-point composite (weight × sub-score).
- Cash flow +14.1/30.0
- ARV discount +10.1/15.0
- DSCR +4.3/10.0
- Livability +4.1/5.0
- Rent growth +3.4/5.0
- 1% rule +2.9/10.0
- Schools +2.9/10.0
- Condition / age +2.5/5.0
- Appreciation +0.0/10.0
$188,800
🖨 Deal sheet (PDF) 📄 Offer letter ✓ Due diligence
Listing remarks MLS
Attractively priced town home in SE Huntsville. Has 2 bedrooms, master with walk-in closet. Bath has separate dressing area with a vanity. Kitchen is eat-in. Private patio in rear between 2 car parking area.
Key facts
- Laminate flooring
- Living room
- Dining area
Tags
Property features AI
Finance
- Other: Living area approximately 1,275 square feet; Located in Huntsville, AL (directions available from 231 South: L on Kohler Rd SE, R on Jade Ln SE, home is on the left)
- HOA & community: Homeowners association with an annual fee of $100; Subdivision: Elm Tree Trace Townhomes
Exterior
- Parking: Concrete driveway
- Utilities: Public sewer
- Home design: Townhouse; Two levels; Built in 1982
- Construction: Vinyl siding; Slab foundation
- Exterior features: Public water
Interior
- Kitchen: Range; Dishwasher; Refrigerator
- Bathrooms: One full bathroom; One half bathroom
- Heating & cooling: Central electric heating; Central electric cooling
- Interior features: Five total rooms
- Laundry & utility: Washer; Dryer
Neighborhood map
What this means for you Summary
Snapshot
- This is a 2-bed/0.5-bath townhouse listed at $189k.
Deal economics
- At list price, monthly cash flow is $29 ($344/yr) — positive.
- The deal already cash-flows at list — no discount required.
- To meet the 1% rule (rent ≥ 1% of price), the offer needs to be $149k (21.3% below list).
- Recommended offer: $149k (21.3% below list) — sets the bar for 1% rule.
- Cap rate 6.5% vs local median 3.8% in Huntsville — top-decile yield for the area; either an underpriced asset or a hidden risk that comps aren't pricing in. Stress-test before assuming the spread holds.
Location & tenants
- Location reads 82/100 on livability (#3 in AL, #1,082 nationally) — a professional / high-income tenant draw. Strengths: commute A+, cost of living A+, housing A+; Watch: crime F.
- Huntsville City (urban): math 21% / reading 46% proficiency, ranked #48 of 129 in AL (top 37%) — families likely to look elsewhere, expect single-tenant / working-renter base with shorter leases.
- Zoned schools: Mountain Gap Elementary School (math 27% / reading 62%, grade F, #171 of 627 statewide, top 31%, 324 students, 40% FRL); Mountain Gap Middle School (math 27% / reading 63%, grade D, #38 of 257 statewide, top 14%, 419 students, 44% FRL); Virgil Grissom High School (math 34% / reading 40%, grade F, #39 of 305 statewide, top 13%, 1,974 students, 43% FRL) — zoned schools at 42% FRL track the district average.
- Market conditions: Rents rising (+3.7%/yr); 283 active listings in the ZIP; 22 comparable units currently listed for rent nearby; rentals at typical pace (median 26d on market — plan ~3-4 weeks tenant-placement turnaround); solid renter incomes; 4,709 units permitted in Madison County in 2024 (1,186 in 5+ unit buildings).
- This rent is only 18% of the median local income ($101k/yr) — well below the 30% rent-burden line; pricing power to push rent on renewal without tenant pushback.
Forward outlook
- Local home prices are declining (-3.0%/yr); year-one equity from $1k of loan paydown is wiped out by about $6k of value loss. Plan a longer hold.
- Madison County population projected at +18% by 2050 — long-run rental-demand tailwind backs the buy-and-hold thesis.
Negotiation context
- It's been on market 16 days — a 2% lower offer ($186k) is reasonable based on typical stale-listing flexibility.
- 3 sale attempts since 13y ago with the ask held roughly flat each time — persistent listings suggest the price (not the market) is what's stuck; bring a comps-based counter.
- Current owner paid $160k; 18% above their basis — modest negotiation headroom, anchor on the comps not their cost.
Risks & watch-outs
- Climate carrying-cost: extreme-heat days projected 7→21/yr by 2055 (HVAC capex compounding) — expect insurance premiums to compound above CPI over the hold.
Questions for the listing agent
- What does the HOA fee cover, when was the last increase, and are there any pending special assessments or reserve-fund shortfalls?
- Is there a deadline driving the sale (1031 exchange, divorce, estate, relocation)? That informs how much negotiation room exists.
- Crime grade is F in this area — have there been break-ins, vandalism, or insurance claims at this property in the last 3 years? What carrier currently insures it and at what premium?
- The area grade is low — what's the realistic commute time and amenity access for the typical tenant pool here? Any planned neighborhood developments (good or bad) we should know about?
- What's the average days-on-market for RENTAL listings here right now (not sales)? A rising rental-DOM trend means longer vacancies and softer asking-rent achievability than the comps imply.
- What's the recent tenant-quality profile in this submarket — average credit score on applications, eviction rate, late-payment / NSF rate, and stable-employment percentage? A property-management company in the area should have these aggregated.
- How much new for-sale + rental construction is in the pipeline within 1–3 miles? Heavy new supply typically softens prices + rents 12–24 months out; constrained supply supports both.
Investment metrics
- 1% rule
- 0.79% ✗
- Cap rate
- 6.48%
- Cash-on-cash
- 0.65%
- DSCR
- 1.03
- GRM
- 10.6
CMA / ARV
- ARV (on-the-fly)
- $200,200
- Comps found
- 12
Show comp detail 12 sales within ~0.75 mi
| Address | Dist | Beds/Ba | Sqft | Sold | Price | $/sf | Match |
|---|---|---|---|---|---|---|---|
| 11562 Jade Ln SE | 0.04mi | 2/2.5 | 1,350 (-4%) | 3mo | $198,500 | $147 | 82 |
| 11502 Jade Ln SE | 0.03mi | 2/1.5 | 1,275 (-9%) | 1mo | $196,700 | $154 | 79 |
| 11521 Jade Ln SE | 0.09mi | 2/1.5 | 1,300 (-7%) | 17mo | $170,000 | $131 | 66 |
| 11568 Jade Ln SE | 0.07mi | 2/2.5 | 1,300 (-7%) | 16mo | $180,000 | $138 | 64 |
| 11112 Memorial Parkway South Unit N3 | 0.29mi | 2/2.5 | 1,298 (-7%) | 4mo | $179,000 | $138 | 63 |
| 11112 Memorial Parkway South SW Unit P1 | 0.29mi | 2/2.5 | 1,278 (-9%) | 3mo | $190,000 | $149 | 62 |
| 2028 English Dr SW #3 | 0.20mi | 2/3.0 | 1,248 (-11%) | 9mo | $178,000 | $143 | 55 |
| 11112 Memorial Parkway South Unit M2 | 0.26mi | 2/2.5 | 1,278 (-9%) | 13mo | $165,000 | $129 | 55 |
| 11112 Memorial Parkway South Unit N1 | 0.25mi | 2/2.5 | 1,267 (-10%) | 18mo | $167,000 | $132 | 49 |
| 11112 Memorial Pkwy S Unit K3 | 0.29mi | 2/2.5 | 1,208 (-14%) | 19mo | $135,000 | $112 | 40 |
| 11112 S Memorial Parkway South Unit 5L | 0.62mi | 2/2.5 | 1,242 (-11%) | 8mo | $189,000 | $152 | 38 |
| 11112 SE Memorial Parkway South Unit I- 4 | 0.62mi | 2/2.5 | 1,254 (-10%) | 12mo | $190,000 | $152 | 35 |
Match score weights: distance 35% · size 25% · config 20% · recency 20%. Top-matched comps best support the ARV.
Projected returns pro-forma
-3.0% appreciation · 3.72% rent growth · sell at horizon
- IRR
- -14.6%
- Equity multiple
- 0.47×
- Total profit
- $-27,757
- Equity at exit
- $28,151
- IRR
- -5.0%
- Equity multiple
- 0.67×
- Total profit
- $-17,607
- Equity at exit
- $16,324
Cash invested: $52,864 (down + closing). Projections, not guarantees.
Landlord ↔ Tenant lean methodology
- Overall (STATE)
- 90 Strongly Landlord-Friendly
- State Alabama
- 90 Strongly Landlord-Friendly · R+15
- County
- — inherits STATE
- City
- — inherits STATE
ZIP-level market 35803
- Home prices YoY
- -22.9%
- Rents YoY
- 3.7%
- Active inventory
- 283
- Price-to-rent
- 10.6×
Monthly cashflow live
- Estimated rent
- $1,486 high interval (Pro) →
- Mortgage (P&I)
- −$990
- Tax from tax record
- −$69 /mo · $824/yr
- Insurance
- −$79
- HOA
- −$8
- Vacancy / Maint / Mgmt
- −$312
- Net cashflow
- $29
Break-even live
Sensitivity live
| Price | -10% $136 | -5% $82 | +0% $29 | +5% $-25 | +10% $-78 |
|---|---|---|---|---|---|
| Rent | -10% $-89 | -5% $-30 | +0% $29 | +5% $87 | +10% $146 |
| Rate | -1.0pp $124 | -0.5pp $77 | base $29 | +0.5pp $-20 | +1.0pp $-70 |
UW: 25.0% down · 7.5% · 30yr · 1.5% tax · 5.0% vac · 8.0% maint · 8.0% mgmt
Financing live
Cash to close
- Down payment
- $47,200
- Closing costs
- $5,664
- Reserves months
- —
- Total cash needed
- —
Loan-product check · same deal, 3 products live
Conventional
25% down · 7.5% · 30yr
- Down + closing
- —
- Monthly P&I
- —
- Monthly cashflow
- —
- DSCR
- —
- Eligible?
- —
Personal DTI + credit; lowest rate.
DSCR
20% down · 8.5% · 30yr
- Down + closing
- —
- Monthly P&I
- —
- Monthly cashflow
- —
- DSCR
- —
- Eligible?
- —
No personal income docs; deal must DSCR.
Hard money
10% down · 12.0% · 12mo
- Down + closing
- —
- Monthly P&I
- —
- Monthly cashflow
- —
- DSCR
- —
- Eligible?
- —
Short-term bridge; refi at stabilization.
Rent comps 22 comps
| Address | Beds | Baths | Sqft | Rent | $/sqft | DOM | Units | Dist |
|---|---|---|---|---|---|---|---|---|
| 11112 Memorial Pkwy SW Huntsville, AL | 2.0 | 2.5–3.0 | 1224 | $1,300 | $1.06 | 45d | 2 | 0.29mi |
| 11112 Memorial Pkwy SW #1 Huntsville, AL | 2.0 | 2.5 | 1250 | $1,600 | $1.28 | 25d | 1 | 0.29mi |
| 12107 Greenleaf Dr SE Huntsville, AL | 3.0 | 2.0 | 1600 | $1,500 | $0.94 | 15d | 1 | 0.35mi |
| 2108 English Dr SW Huntsville, AL | 3.0 | 1.5 | 1200 | $1,295 | $1.08 | 25d | 1 | 0.37mi |
| 11406 Crestfield Dr SE Huntsville, AL | 3.0 | 1.5 | 1809 | $1,750 | $0.97 | 25d | 1 | 0.46mi |
| 11575 Memorial Pkwy SE Huntsville, AL | 1.0–3.0 | 1.0–2.0 | 949 | $999 | $1.05 | 15d | 6 | 0.59mi |
| 10311 Parliament Dr SW Huntsville, AL | 3.0 | 2.0 | 1483 | $1,790 | $1.21 | 25d | 1 | 0.62mi |
| 11209 Maplecrest Dr SE Huntsville, AL | 3.0 | 2.0 | 1530 | $1,700 | $1.11 | 15d | 1 | 0.69mi |
| 1935 Meadowbrook Dr SW Huntsville, AL | 1.0–2.0 | 1.0–2.0 | 850 | $1,129 | $1.33 | 15d | 9 | 0.69mi |
| 11021 Strong Dr SE Huntsville, AL | 3.0 | 1.5 | 1549 | $1,650 | $1.07 | 25d | 1 | 0.89mi |
| 12340 Chicamauga Trl SE Unit C Huntsville, AL | 2.0 | 1.5 | 1024 | $1,100 | $1.07 | 45d | 1 | 1.00mi |
| 617 Wellingburg Rd SE Huntsville, AL | 3.0 | 2.0 | 1650 | $1,998 | $1.21 | 25d | 1 | 1.05mi |
| 100 Memorial Village Dr Huntsville, AL | 1.0–3.0 | 1.0–2.0 | 973 | $1,812 | $1.86 | 15d | 20 | 1.15mi |
| 912 Mountain Gap Rd SE Huntsville, AL | 3.0 | 2.0 | 1500 | $1,700 | $1.13 | 45d | 1 | 1.20mi |
| 2712 Wynterhall Rd SE Huntsville, AL | 3.0 | 2.5 | 1620 | $1,600 | $0.99 | 45d | 1 | 1.24mi |
| 10007 Camille Dr SE Huntsville, AL | 3.0 | 2.5 | 1702 | $1,781 | $1.05 | 25d | 1 | 1.24mi |
| 2606 Wynterhall Rd SE Unit C Huntsville, AL | 2.0 | 2.0 | 1300 | $995 | $0.77 | 45d | 1 | 1.29mi |
| 2609 Wynterhall Rd SE Unit D Huntsville, AL | 2.0 | 2.0 | 1000 | $1,000 | $1.00 | 15d | 1 | 1.31mi |
| 850 Haysland Rd SW Huntsville, AL | 1.0–3.0 | 1.0–2.0 | 1187 | $1,840 | $1.55 | 15d | 21 | 1.36mi |
| 2710 Lantern Walk SE Apt B Huntsville, AL | 2.0 | 2.0 | 905 | $895 | $0.99 | 15d | 1 | 1.41mi |
| 2700 Lantern Walk SE Apt A Huntsville, AL | 2.0 | 2.0 | 1000 | $1,200 | $1.20 | 45d | 1 | 1.46mi |
| 12104 Carriage Ct SE Unit A Huntsville, AL | 2.0 | 2.0 | 900 | $895 | $0.99 | 15d | 1 | 1.48mi |
HOA detail
- Monthly dues
- $8 · $96/yr
Listing history 12 events
-
2026-06-22days on market $188,800 Active 16 DOM
-
2026-06-18days on market $188,800 Active 13 DOM
-
2026-06-18price $188,800 Active 12 DOM
-
2026-06-17days on market $195,000 Active 12 DOM
-
2026-06-16days on market $195,000 Active 11 DOM
-
2026-06-15days on market $195,000 Active 10 DOM
-
2026-06-14days on market $195,000 Active 8 DOM
-
2026-06-10days on market $195,000 Active 5 DOM
-
2026-06-09days on market $195,000 Active 4 DOM
-
2026-06-08days on market $195,000 Active 3 DOM
-
2026-06-07remarks 316-char remark
-
2026-06-07$195,000 Active 2 DOM
ⓘ Source: listings_history table (triggers on properties + properties_extension) + one-shot
backfill from property_details.listing_events for pre-trigger history.
Tax reassessment forecast AL · Resets to sale price
- Current annual tax
- $824 · $69/mo
- Projected year-2 tax
- $824 · $69/mo
- Expected delta
- $0/yr ($0/mo · 0.0%)
ⓘ Screening estimate from a state-policy table — verify with the county assessor before closing.
Climate risk First Street
- Flood 1/10 Low FEMA zone X (unshaded) · 0% chance over 30 yrs
- Wildfire 3/10 Moderate
- Heat 6/10 Major 7 d/yr ≥105°F today · 21 d/yr by 30 yrs out
- Wind 4/10 Moderate 19% chance of damaging wind over 30 yrs
- Air quality 2/10 Low 1 unhealthy d/yr today · 2 by 30 yrs out
Nearby sold comps map
Loading sold comps map…
Walkable amenities ~0.75 mi
Loading nearby amenities…
Taxation est. · year 1
- Rental income
- $17,835
- − Mortgage interest
- −$10,576
- − Property taxes
- −$824
- − Insurance
- −$944
- − Repairs & maintenance
- −$1,427
- − Management
- −$1,427
- − HOA
- −$96
- − Depreciation
- −$5,492
- Taxable loss
- −$2,951
- Est. tax savings @ 24.0%
- +$708
- After-tax cash flow
- $1,053/yr
For passive investors: Depreciation is non-cash, so a rental often shows a tax loss while cash-flowing — sheltering income. Rental losses are passive: they offset passive income freely, and up to $25,000/yr can offset ordinary (W-2) income if you actively participate and your MAGI is under $100k (phasing out to $0 by $150k); unused losses carry forward. On sale, claimed depreciation is recaptured at up to 25%, and gains may owe capital-gains tax (a 1031 exchange can defer both). Figures are a year-1 estimate at your 24.0% rate — not tax advice; consult a CPA.
Schools (NCES district)
- District
- Huntsville City
- NCES district ID
- 0101800
- Math proficiency
- 21% ▼ -23.00%
- Reading proficiency
- 46% ▬ 0.00%
- Median HH income
- $48,264
- Composite
- 28.84/100
- National rank
- #6647
- State rank
- #48 of 129 in AL
Livability — Huntsville
- Score
- 82/100
- State rank
- #3
- US rank
- #1082
Category grades
Schools grade is shown separately in the Schools card above.
Census & demographics
- Census place
- Huntsville, AL
- County
- Madison County · 380,832 people
- City population
- 220,435
- Metro
- Huntsville, AL
- Population (ZIP)
- 29,197
- Household income
- $100,846
- Rent vs Own
- Severe rent burden
- 411.0
Population outlook (Madison County) Hauer SSP2
- Today (2025)
- 392,086 people
- By 2030
- 409,788 · +4.5%
- By 2040
- 440,557 · +12.4%
- By 2050
- 460,990 · +17.6%
- By 2075
- 502,872 · +28.3%
- By 2100
- 513,623 · +31.0%
Race, ethnicity, and origin ACS 2023
- Neighborhood character
- Predominantly White (82%)
- Race & ethnicity
- White 82% Hispanic / Latino 7% Two or more races 7% Black 4% Asian 3%
- Hispanic origin (detail)
- Mexican 4% Puerto Rican 1%
- Common ancestry
- Slovak 3% Italian 2% Lithuanian 2%
- Foreign-born
- 6% · Canada, China, South Korea
- Languages at home
- 92% English-only · Spanish 3% Chinese 2% German/W. Germanic 1%
Political lean MEDSL · Madison
- 2024 margin
- Lean R (+9.0) · D 44.7% · R 53.7% · Other 1.6%
- 2008→2024 swing
- +6.0pp toward D · 2008: -14.9pp · 2024: -9.0pp
- All cycles
- 2024: R+9.0 2020: R+8.0 2016: R+16.8 2012: R+18.7 2008: R+14.9
Not yet ingested
- Civics
- —
Market trends
- HPI YoY
- ▼ -110.53%
- Current HPI
- 372.1842
- Rent YoY
- ▲ 3.72%
- Metro
- Huntsville, AL
- State GDP YoY
- ▲ 2.94%
- F500 in state
- 4
Industry mix (Fortune 500 HQ in AL)
| Industry | F500 HQs | Revenue |
|---|---|---|
| Financial Services | 1 | $8B |
|
||
| Healthcare | 1 | $5B |
|
||
Price history
+457.1% since first listed7 events — show timeline
- 2026-06-05 Listed $195,000 VMLS
- 2022-07-21 Sold (Public Records) $160,000 Public Records
- 2022-05-05 Listed $139,900 VMLS
- 2013-08-19 Sold (Public Records) $57,000 Public Records
- 2013-08-16 Sold (MLS) $57,000 VMLS
- 2013-04-02 Listed $62,900 VMLS
- 2013-02-28 Sold (Public Records) $35,000 Public Records
Property tax history
-2.6%/yrLatest (2024): $824 · +3.0% YoY. Source: county tax records.
Cash-flow waterfall
monthlySold comps — $/sqft
last 12 mo · ≤1 miLoading sold comps…