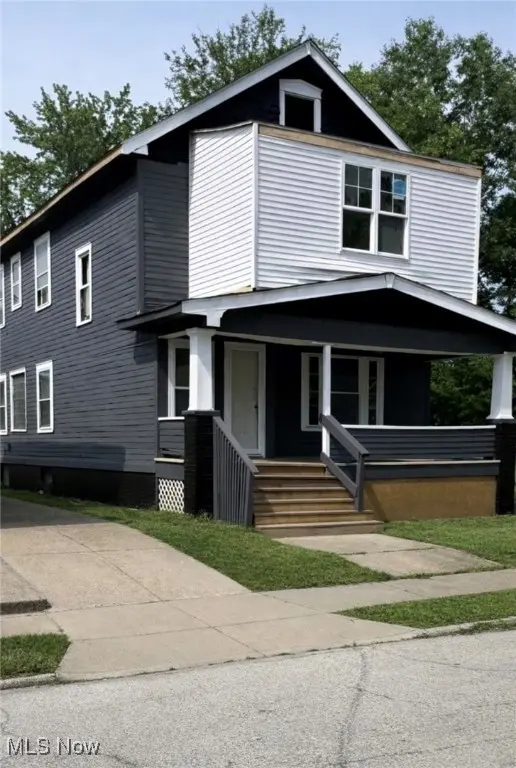
 Duplex
13819 Northfield Ave · East Cleveland, OH
Flood risk 6/10 · Moderate
- FEMA flood zone
- X (unshaded)
- Chance of flooding over 30 yrs
- 0.68%
- Est. flood insurance / yr
- $473 – $860
Fire risk 1/10 · Minimal
- Est. fire insurance / yr
- $713 – $1,323
Heat risk 3/10 · Minor
- Hot days now (above 95°F)
- 7 days/yr
- Hot days in 30 yrs
- 17 days/yr
Wind risk 1/10 · Minimal
- Chance of severe wind over 30 yrs
- —
Air-quality risk 3/10 · Minor
- Unhealthy air days now
- 3 days/yr
- Unhealthy air days in 30 yrs
- 5 days/yr
Risk factors via First Street. Map © Google.
Why this score? — see what drove the B grade
The composite is a weighted blend of 9 inputs, each scored 0–100. Each bar is that input's sub-score; the figure is the points it added to the 100-point composite (weight × sub-score).
- Cash flow +30.0/30.0
- ARV discount +11.9/15.0
- 1% rule +10.0/10.0
- DSCR +10.0/10.0
- Rent growth +3.8/5.0
- Livability +3.3/5.0
- Condition / age +2.5/5.0
- Schools +0.7/10.0
- Appreciation +0.0/10.0
$50,000
🖨 Deal sheet 📄 Offer letter ✓ Due diligence
Multi-family units
County records classify this as Multi-Family (2-4 Unit). Listing-text estimate: 2 units. confirmed
Listing remarks MLS
Duplex with great bones and exciting potential! Ready for a full renovation. Sound structure but requires a complete rehab throughout, including interior finishes, kitchens, baths, and mechanical updates. Ideal for investors or renovators looking for an opportunity to add value and create strong rental income or a beautifully refreshed multi-family residence for resale. Roof replaced and porches refreshed in 2025. Blind offers will not be accepted. No utilities will be active for inspections. Buyer to handle POS. No Creative Financing Available & No Wholesalers Please. More Photos to Come!
Key facts
- Interior finishes
- Complete rehab
- Full renovation
Tags
Neighborhood map
What this means for you Summary
Snapshot
- This is a 2 × 2-bed/1.0-bath units multifamily listed at $50k.
Deal economics
- At list price, monthly cash flow is $1k ($16k/yr) — positive. Per door: $657/mo.
- The deal already cash-flows at list — no discount required.
- Meets the 1% rule at list price ($2k rent vs $50k).
- Recommended offer: $44k (12.0% below list) — sets the bar for market timing.
- Cap rate 37.8% vs local median 17.4% in East Cleveland — top-decile yield for the area; either an underpriced asset or a hidden risk that comps aren't pricing in. Stress-test before assuming the spread holds.
Location & tenants
- Location reads 66/100 on livability (#650 in OH) — a middle-class / working-renter tenant base. Strengths: commute A+, cost of living A+, health & safety A+; Watch: schools F, crime F, employment F.
- East Cleveland City School District (suburban): math 4% / reading 17% proficiency, ranked #652 of 656 in OH (top 99%) — low school quality limits family demand, transient renter base, plan for 1-2y turnover; 92% free/reduced lunch — lower-income household profile, screen leases tightly.
- Market conditions: Rents rising fast (+5.2%/yr); 99 active listings in the ZIP; 19 comparable units currently listed for rent nearby; rentals at typical pace (median 16d on market — plan ~3-4 weeks tenant-placement turnaround); lower-income renter base — watch delinquency; 1,441 units permitted in Cuyahoga County in 2024 (700 in 5+ unit buildings).
- At $2,077/mo this rent would consume 87% of the median local household income ($29k/yr) (locally 1702% of renters already pay >50% of income on rent) — very limited rent-growth headroom before tenants either downsize or default.
Forward outlook
- Local home prices are declining (-3.0%/yr); year-one equity from $346 of loan paydown is wiped out by about $2k of value loss. Plan a longer hold.
- Cuyahoga County population projected to shrink 8% by 2050 — rents likely to lag national; underwrite the cash flow, not the appreciation.
- At projected returns (-3.0% appreciation + 5.2% rent growth), your $14k cash investment doubles in ~1 year — after that, you're playing with house money.
Negotiation context
- It's been on market 177 days — a 12% lower offer ($44k) is reasonable based on typical stale-listing flexibility.
- 2 sale attempts; this cycle's ask has dropped $10k (17%) from the opening price — seller is motivated, your offer sets the floor, not the list.
Risks & watch-outs
- Watch-outs: built in 1914 — expect roof / HVAC / electrical / plumbing capex.
- Climate carrying-cost: major flood risk — expect insurance premiums to compound above CPI over the hold.
Questions for the listing agent
- It's been on market 177 days. Have you received any prior offers? Is the seller open to a 12% concession, seller financing, or rate buy-down credit?
- Can we see the unit-by-unit rent roll, current vacancy, and any below-market leases? What's the average tenancy length?
- What capital expenditures (roof, boiler, parking lot, exteriors) have been made in the last 5 years, and what's planned in the next 2?
- Built in 1914 — when were the roof, HVAC, electrical panel, plumbing, and water heater last replaced?
- Why hasn't it sold? Are there any deal-killer items the seller is aware of (foundation, flood, title, zoning, code violations)?
- Is there a deadline driving the sale (1031 exchange, divorce, estate, relocation)? That informs how much negotiation room exists.
- Schools are F-rated, which usually means shorter tenancies and higher turnover. Who's the typical renter profile here, and what's been the actual vacancy rate?
- Crime grade is F in this area — have there been break-ins, vandalism, or insurance claims at this property in the last 3 years? What carrier currently insures it and at what premium?
- What's the average days-on-market for RENTAL listings here right now (not sales)? A rising rental-DOM trend means longer vacancies and softer asking-rent achievability than the comps imply.
- What's the recent tenant-quality profile in this submarket — average credit score on applications, eviction rate, late-payment / NSF rate, and stable-employment percentage? A property-management company in the area should have these aggregated.
- How much new apartment / multifamily construction is in the pipeline within 1–3 miles? Heavy new supply (>2% of stock underway) typically softens rents 12–24 months out; light construction supports rent growth.
Investment metrics
- 1% rule
- 4.15% ✓
- Cap rate
- 37.81%
- Cash-on-cash
- 112.57%
- DSCR
- 6.01
- GRM
- 2.0
CMA / ARV
- ARV (median comp)
- $55,442
- List price
- $50,000
- Delta
- -9.82%
- Verdict
- FAIR
- Comps
- 20 within 1.0 mi
Show comp detail 8 sales within ~0.75 mi
| Address | Dist | Beds/Ba | Sqft | Sold | Price | $/sf | Match |
|---|---|---|---|---|---|---|---|
| 14111 Savannah Ave | 0.12mi | 4/2.0 | 1,924 (+5%) | 2mo | $34,000 | $18 | 85 |
| 13436 Hartford Rd | 0.14mi | 4/2.0 | 1,920 (+5%) | 11mo | $89,500 | $47 | 77 |
| 13428 Hartford Rd | 0.14mi | 4/2.0 | 1,988 (+8%) | 9mo | $34,000 | $17 | 72 |
| 14004 Savannah Ave | 0.08mi | 4/2.0 | 1,996 (+9%) | 13mo | $40,000 | $20 | 71 |
| 14119 Bardwell Ave | 0.19mi | 4/2.5 | 1,582 (-14%) | 3mo | $9,975 | $6 | 64 |
| 14310 Potomac Ave | 0.18mi | 5/2.0 (+1) | 1,982 (+8%) | 12mo | $36,000 | $18 | 63 |
| 14810 Shaw Ave | 0.45mi | 4/2.0 | 1,698 (-7%) | 6mo | $35,000 | $21 | 61 |
| 13500 Third Ave | 0.32mi | 4/2.0 | 2,090 (+14%) | 16mo | $30,000 | $14 | 48 |
Match score weights: distance 35% · size 25% · config 20% · recency 20%. Top-matched comps best support the ARV.
Projected returns pro-forma
-3.0% appreciation · 5.16% rent growth · sell at horizon
- IRR
- —
- Equity multiple
- 6.73×
- Total profit
- $80,173
- Equity at exit
- $7,455
- IRR
- —
- Equity multiple
- 15.10×
- Total profit
- $197,378
- Equity at exit
- $4,323
Cash invested: $14,000 (down + closing). Projections, not guarantees.
Landlord ↔ Tenant lean methodology
- Overall (STATE)
- 73 Landlord-Friendly
- State Ohio
- 73 Landlord-Friendly · R+6
- County
- — inherits STATE
- City
- — inherits STATE
ZIP-level market 44112
- Rents YoY
- 5.2%
- Active inventory
- 99
- Price-to-rent
- 4.0×
Monthly cashflow live
- Estimated rent
- $2,077 high interval (Pro) →
- Mortgage (P&I)
- −$262
- Tax from tax record
- −$44 /mo · $534/yr
- Insurance
- −$21
- HOA
- −$0
- Vacancy / Maint / Mgmt
- −$436
- Net cashflow
- $1,313
Break-even live
2-unit breakdown (identical units grouped — click to expand)
| Units | Beds | Baths | Est. rent |
|---|---|---|---|
| 2× units | 2 | 1 | $2,076 |
| #1 | 2 | 1 | $1,038 |
| #2 | 2 | 1 | $1,038 |
| Total (2 units) | $2,077 | ||
UW: 25.0% down · 7.5% · 30yr · 1.5% tax · 5.0% vac · 8.0% maint · 8.0% mgmt
Financing live
Cash to close
- Down payment
- $12,500
- Closing costs
- $1,500
- Reserves months
- —
- Total cash needed
- —
Loan-product check · same deal, 3 products live
Conventional
25% down · 7.5% · 30yr
- Down + closing
- —
- Monthly P&I
- —
- Monthly cashflow
- —
- DSCR
- —
- Eligible?
- —
Personal DTI + credit; lowest rate.
DSCR
20% down · 8.5% · 30yr
- Down + closing
- —
- Monthly P&I
- —
- Monthly cashflow
- —
- DSCR
- —
- Eligible?
- —
No personal income docs; deal must DSCR.
Hard money
10% down · 12.0% · 12mo
- Down + closing
- —
- Monthly P&I
- —
- Monthly cashflow
- —
- DSCR
- —
- Eligible?
- —
Short-term bridge; refi at stabilization.
Rent comps 19 comps
| Address | Beds | Baths | Sqft | Rent | $/sqft | DOM | Units | Dist |
|---|---|---|---|---|---|---|---|---|
| 14200 Scioto Ave Cleveland, OH | 3.0 | 1.0 | 1256 | $1,350 | $1.07 | 16d | 1 | 0.13mi |
| 12819 Edmonton Ave Cleveland, OH | 4.0 | 1.0 | 1423 | $1,795 | $1.26 | 16d | 1 | 0.39mi |
| 15801 Hazel Rd Cleveland, OH | 3.0 | 1.5 | 1908 | $1,550 | $0.81 | 16d | 1 | 0.90mi |
| 1229 Melbourne Rd Cleveland, OH | 5.0 | 1.5 | 1600 | $2,000 | $1.25 | 43d | 1 | 0.91mi |
| 14120 Superior Ave Unit 4 East Cleveland, OH | 3.0 | 1.0 | 1408 | $1,350 | $0.96 | 43d | 1 | 0.92mi |
| 14120 Superior Ave Unit 1 East Cleveland, OH | 3.0 | 1.0 | 1400 | $1,350 | $0.96 | 10d | 1 | 0.92mi |
| 651 E 115th St Cleveland, OH | 4.0 | 2.0 | 1550 | $1,800 | $1.16 | 21d | 1 | 1.00mi |
| 571 E 115th St Cleveland, OH | 4.0 | 2.0 | 2220 | $1,808 | $0.81 | 16d | 1 | 1.05mi |
| 16000 Terrace Rd Cleveland, OH | 1.0–3.0 | 1.0–2.0 | 1000 | $1,210 | $1.21 | 1d | 39 | 1.08mi |
| 910 Dresden Rd Cleveland, OH | 4.0 | 2.0 | 1839 | $1,800 | $0.98 | 16d | 1 | 1.10mi |
| 1339 E 115th St Cleveland, OH | 5.0 | 2.0 | 1550 | $2,000 | $1.29 | 16d | 1 | 1.38mi |
| 14120 Superior Rd Cleveland, OH | 3.0 | 1.0 | 1390 | $1,400 | $1.01 | 43d | 1 | 1.39mi |
| 1024 Greyton Rd Cleveland, OH | 5.0 | 2.5 | 1800 | $2,500 | $1.39 | 43d | 1 | 1.40mi |
| 915 Nela View Rd Cleveland, OH | 4.0 | 1.0 | 1300 | $2,600 | $2.00 | 16d | 1 | 1.41mi |
| 3337 Sylvanhurst Rd Cleveland, OH | 3.0 | 1.0 | 1334 | $1,800 | $1.35 | 7d | 1 | 1.41mi |
| 983 Greyton Rd Cleveland, OH | 3.0 | 2.0 | 1457 | $1,495 | $1.03 | 16d | 1 | 1.44mi |
| 2827 Avondale Ave Apt 2 Cleveland Heights, OH | 3.0 | 1.0 | 1680 | $1,275 | $0.76 | 23d | 1 | 1.47mi |
| 821 Nela View Rd Cleveland, OH | 4.0 | 2.5 | 2178 | $2,100 | $0.96 | 7d | 1 | 1.49mi |
| 1641 Coventry Rd Cleveland, OH | 3.0 | 1.0 | 1848 | $1,200 | $0.65 | 16d | 1 | 1.50mi |
Listing history 18 events
-
2026-06-18days on market $50,000 Active 177 DOM
-
2026-06-17days on market $50,000 Active 176 DOM
-
2026-06-13days on market $50,000 Active 175 DOM
-
2026-06-13days on market $50,000 Active 174 DOM
-
2026-06-09days on market $50,000 Active 171 DOM
-
2026-06-08days on market $50,000 Active 170 DOM
-
2026-06-07days on market $50,000 Active 169 DOM
-
2026-06-05days on market $50,000 Active 166 DOM
-
2026-06-03days on market $50,000 Active 165 DOM
-
2026-06-02days on market $50,000 Active 164 DOM
-
2026-06-01days on market $50,000 Active 163 DOM
-
2026-05-31days on market $50,000 Active 162 DOM
-
2026-04-05price $50,000 602-char remark
Show marketing remark (602 chars)
Duplex with great bones and exciting potential! Ready for a full renovation. Sound structure but requires a complete rehab throughout, including interior finishes, kitchens, baths, and mechanical updates. Ideal for investors or renovators looking for an opportunity to add value and create strong rental income or a beautifully refreshed multi-family residence for resale. Roof replaced and porches refreshed in 2025. Blind offers will not be accepted. No utilities will be active for inspections. Buyer to handle POS. No Creative Financing Available & No Wholesalers Please. More Photos to Come!
-
2026-03-12price $39,999 602-char remark
Show marketing remark (602 chars)
Duplex with great bones and exciting potential! Ready for a full renovation. Sound structure but requires a complete rehab throughout, including interior finishes, kitchens, baths, and mechanical updates. Ideal for investors or renovators looking for an opportunity to add value and create strong rental income or a beautifully refreshed multi-family residence for resale. Roof replaced and porches refreshed in 2025. Blind offers will not be accepted. No utilities will be active for inspections. Buyer to handle POS. No Creative Financing Available & No Wholesalers Please. More Photos to Come!
-
2026-01-01price $49,999 602-char remark
Show marketing remark (602 chars)
Duplex with great bones and exciting potential! Ready for a full renovation. Sound structure but requires a complete rehab throughout, including interior finishes, kitchens, baths, and mechanical updates. Ideal for investors or renovators looking for an opportunity to add value and create strong rental income or a beautifully refreshed multi-family residence for resale. Roof replaced and porches refreshed in 2025. Blind offers will not be accepted. No utilities will be active for inspections. Buyer to handle POS. No Creative Financing Available & No Wholesalers Please. More Photos to Come!
-
2025-12-21$59,999 Active 602-char remark
Show marketing remark (602 chars)
Duplex with great bones and exciting potential! Ready for a full renovation. Sound structure but requires a complete rehab throughout, including interior finishes, kitchens, baths, and mechanical updates. Ideal for investors or renovators looking for an opportunity to add value and create strong rental income or a beautifully refreshed multi-family residence for resale. Roof replaced and porches refreshed in 2025. Blind offers will not be accepted. No utilities will be active for inspections. Buyer to handle POS. No Creative Financing Available & No Wholesalers Please. More Photos to Come!
-
2025-05-15historical
-
2025-03-06$17,000 Active
ⓘ Source: listings_history table (triggers on properties + properties_extension) + one-shot
backfill from property_details.listing_events for pre-trigger history.
Tax reassessment forecast OH · Partial reset (capped growth)
- Current annual tax
- $534 · $44/mo
- Projected year-2 tax
- $657 · $55/mo
- Expected delta
- +$123/yr (+$10/mo · 23.0%)
ⓘ Screening estimate from a state-policy table — verify with the county assessor before closing.
Climate risk First Street
- Flood 6/10 Major FEMA zone X (unshaded) · 68% chance over 30 yrs
- Wildfire 1/10 Low
- Heat 3/10 Moderate 7 d/yr ≥95°F today · 17 d/yr by 30 yrs out
- Wind 1/10 Low
- Air quality 3/10 Moderate 3 unhealthy d/yr today · 5 by 30 yrs out
Nearby sold comps map
Loading sold comps map…
Walkable amenities ~0.75 mi
Loading nearby amenities…
Taxation est. · year 1
- Rental income
- $24,924
- − Mortgage interest
- −$2,801
- − Property taxes
- −$534
- − Insurance
- −$250
- − Repairs & maintenance
- −$1,994
- − Management
- −$1,994
- − Depreciation
- −$1,455
- Taxable income
- $15,897
- Est. tax owed @ 24.0%
- −$3,815
- After-tax cash flow
- $11,944/yr
For passive investors: Depreciation is non-cash, so a rental often shows a tax loss while cash-flowing — sheltering income. Rental losses are passive: they offset passive income freely, and up to $25,000/yr can offset ordinary (W-2) income if you actively participate and your MAGI is under $100k (phasing out to $0 by $150k); unused losses carry forward. On sale, claimed depreciation is recaptured at up to 25%, and gains may owe capital-gains tax (a 1031 exchange can defer both). Figures are a year-1 estimate at your 24.0% rate — not tax advice; consult a CPA.
Schools (NCES district)
- District
- East Cleveland City School District
- NCES district ID
- 3904390
- Math proficiency
- 4% ▼ -16.00%
- Reading proficiency
- 17% ▼ -13.00%
- Median HH income
- $22,726
- Composite
- 7.38/100
- National rank
- #9954
- State rank
- #652 of 656 in OH
Livability — East Cleveland
- Score
- 66/100
- State rank
- #650
- US rank
- #11510
Category grades
Schools grade is shown separately in the Schools card above.
Census & demographics
- Census place
- East Cleveland, OH
- County
- Cuyahoga County · 1,090,369 people
- City population
- 17,848
- Metro
- Cleveland-Elyria, OH
- Population (ZIP)
- 17,848
- Household income
- $28,799
- Rent vs Own
- Severe rent burden
- 1702.0
Population outlook (Cuyahoga County) Hauer SSP2
- Today (2025)
- 1,244,621 people
- By 2030
- 1,230,093 · -1.2%
- By 2040
- 1,189,108 · -4.5%
- By 2050
- 1,145,706 · -7.9%
- By 2075
- 1,076,557 · -13.5%
- By 2100
- 978,987 · -21.3%
Race, ethnicity, and origin ACS 2023
- Neighborhood character
- Predominantly Black (89%)
- Race & ethnicity
- Black 89% White 7% Two or more races 2% Hispanic / Latino 1%
- Common ancestry
- Lithuanian 1%
- Foreign-born
- 4% · Canada
- Languages at home
- 93% English-only · French/Haitian/Cajun 3% Spanish 2% Russian/Polish/Slavic 1%
Political lean MEDSL · Cuyahoga
- 2024 margin
- Solid D (+31.5) · D 65.4% · R 33.9%
- 2008→2024 swing
- -7.4pp toward R · 2008: 38.9pp · 2024: 31.5pp
- All cycles
- 2024: D+31.5 2020: D+34.1 2016: D+35.0 2012: D+38.7 2008: D+38.9
Not yet ingested
- Civics
- —
Market trends
- HPI YoY
- ▼ -115.61%
- Current HPI
- 67.2162
- Rent YoY
- ▲ 5.16%
- Metro
- Cleveland-Elyria, OH
- State GDP YoY
- ▲ 1.98%
- F500 in state
- 48
Industry mix (Fortune 500 HQ in OH)
| Industry | F500 HQs | Revenue |
|---|---|---|
| Insurance | 3 | $145B |
|
||
| Industrial Machinery | 3 | $49B |
|
||
| Financial Services | 3 | $24B |
|
||
| Consumer Goods | 2 | $93B |
|
||
| Aerospace / Defense | 2 | $47B |
|
||
| Utilities | 2 | $33B |
|
||
Price history
+194.1% since first listed6 events — show timeline
- 2026-04-05 Price Changed $50,000 MLSNOW
- 2026-03-12 Price Changed $39,999 MLSNOW
- 2026-01-01 Price Changed $49,999 MLSNOW
- 2025-12-21 Listed $59,999 MLSNOW
- 2025-05-15 Listing Removed — MLSNOW
- 2025-03-06 Listed $17,000 MLSNOW
Property tax history
-4.4%/yrLatest (2025): $534 · +0.0% YoY. Source: county tax records.
Cash-flow waterfall
monthlySold comps — $/sqft
last 12 mo · ≤1 miLoading sold comps…