954 Green Vines Ln · Houston, TX
Flood risk No data
- FEMA flood zone
- —
- Chance of flooding over 30 yrs
- —
- Est. flood insurance / yr
- —
Fire risk No data
- Est. fire insurance / yr
- —
Heat risk No data
- Hot days now (above threshold)
- —
- Hot days in 30 yrs
- —
Wind risk No data
- Chance of severe wind over 30 yrs
- —
Air-quality risk No data
- Unhealthy air days now
- —
- Unhealthy air days in 30 yrs
- —
Risk factors via First Street. Map © Google.
Why this score? — see what drove the D- grade
The composite is a weighted blend of 9 inputs, each scored 0–100. Each bar is that input's sub-score; the figure is the points it added to the 100-point composite (weight × sub-score).
- ARV discount +15.0/15.0
- Cash flow +7.8/30.0
- Livability +3.7/5.0
- Rent growth +3.0/5.0
- Schools +2.7/10.0
- Condition / age +2.5/5.0
- 1% rule +2.4/10.0
- DSCR +1.9/10.0
- Appreciation +0.0/10.0
$264,990
🖨 Deal sheet 📄 Offer letter ✓ Due diligence
Listing remarks
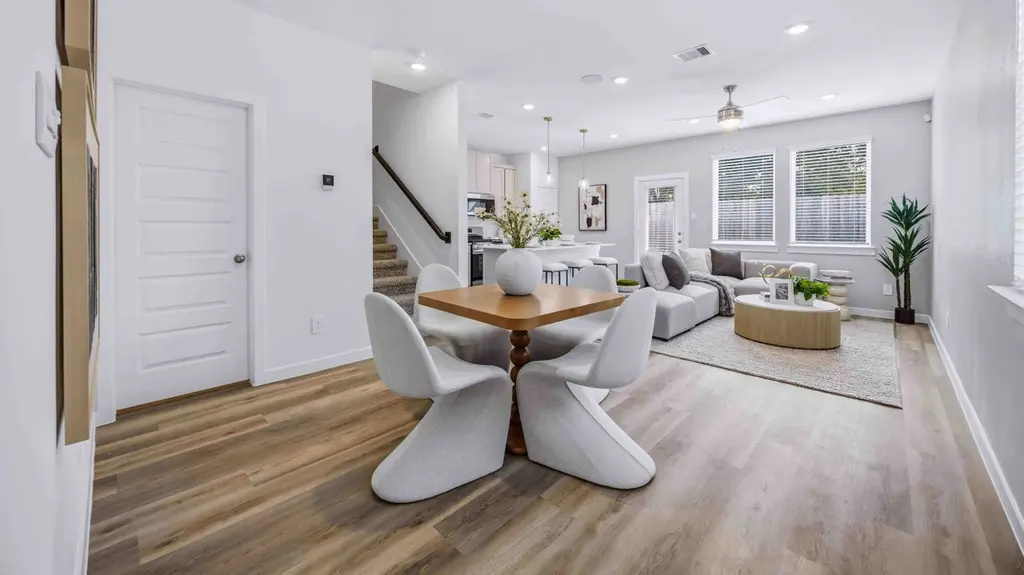
The property is located at 954 Green Vines Lane HOUSTON TX 77091 priced at 264990, the square foot and stories are 1384, 2.The number of bath is 2, halfbath is 1 there are 3 bedrooms and 2 garages. For more details please, call or email.
Key facts
- 2 garage spots
- Built 2026
- Listed 30 days
Neighborhood map
What this means for you Summary
Snapshot
- This is a 3-bed/2.5-bath single-family listed at $265k.
Deal economics
- At list price, monthly cash flow is $-292 ($-4k/yr) — negative.
- To cash-flow at today's rent, offer at most $223k (16.0% below list).
- To meet the 1% rule (rent ≥ 1% of price), the offer needs to be $195k (26.5% below list).
- Recommended offer: $195k (26.5% below list) — sets the bar for 1% rule.
- Cap rate 5.0% vs local median 3.2% in Houston — top-decile yield for the area; either an underpriced asset or a hidden risk that comps aren't pricing in. Stress-test before assuming the spread holds.
Location & tenants
- Location reads 74/100 on livability (#184 in TX, #4,771 nationally) — a middle-class / working-renter tenant base. Strengths: amenities A+, cost of living A+, housing A+; Watch: schools D, crime F.
- Houston ISD (urban): math 27% / reading 35% proficiency, ranked #593 of 826 in TX (top 72%) — families likely to look elsewhere, expect single-tenant / working-renter base with shorter leases; 71% free/reduced lunch — lower-income household profile, screen leases tightly.
- Market conditions: Rents rising (+2.1%/yr); 675 active listings in the ZIP; 33 comparable units currently listed for rent nearby; rentals lingering (median 44d on market — plan ~5-8 weeks vacancy on turnover, expect pricing pressure); 55% of comp listings sitting > 30 days — soft ceiling on asking rent; lower-income renter base — watch delinquency; 29,883 units permitted in Harris County in 2024 (8,621 in 5+ unit buildings).
- At $1,948/mo this rent would consume 66% of the median local household income ($35k/yr) (locally 3210% of renters already pay >50% of income on rent) — very limited rent-growth headroom before tenants either downsize or default.
Forward outlook
- Local home prices are declining (-3.0%/yr); year-one equity from $2k of loan paydown is wiped out by about $8k of value loss. Plan a longer hold.
- Harris County population projected at +47% by 2050 — long-run rental-demand tailwind backs the buy-and-hold thesis.
Negotiation context
- It's been on market 31 days — a 3% lower offer ($257k) is reasonable based on typical stale-listing flexibility.
Questions for the listing agent
- What do current leases actually rent for vs. the listed asking? Can we see a recent rent roll and the last 12 months of T-12 income?
- It's been on market 31 days. Have you received any prior offers? Is the seller open to a 26% concession, seller financing, or rate buy-down credit?
- Is there a deadline driving the sale (1031 exchange, divorce, estate, relocation)? That informs how much negotiation room exists.
- Schools are D-rated, which usually means shorter tenancies and higher turnover. Who's the typical renter profile here, and what's been the actual vacancy rate?
- Crime grade is F in this area — have there been break-ins, vandalism, or insurance claims at this property in the last 3 years? What carrier currently insures it and at what premium?
- The area grade is low — what's the realistic commute time and amenity access for the typical tenant pool here? Any planned neighborhood developments (good or bad) we should know about?
- What's the average days-on-market for RENTAL listings here right now (not sales)? A rising rental-DOM trend means longer vacancies and softer asking-rent achievability than the comps imply.
- What's the recent tenant-quality profile in this submarket — average credit score on applications, eviction rate, late-payment / NSF rate, and stable-employment percentage? A property-management company in the area should have these aggregated.
- How much new for-sale + rental construction is in the pipeline within 1–3 miles? Heavy new supply typically softens prices + rents 12–24 months out; constrained supply supports both.
Investment metrics
- 1% rule
- 0.74% ✗
- Cap rate
- 4.97%
- Cash-on-cash
- -4.73%
- DSCR
- 0.79
- GRM
- 11.3
CMA / ARV
- ARV (median comp)
- $317,861
- List price
- $264,990
- Delta
- -16.63%
- Verdict
- UNDERPRICED
- Comps
- 20 within 1.0 mi
Show comp detail 12 sales within ~0.75 mi
| Address | Dist | Beds/Ba | Sqft | Sold | Price | $/sf | Match |
|---|---|---|---|---|---|---|---|
| 1055 Wheatley Oak Ln | 0.20mi | 3/2.5 | 1,384 (0%) | 4mo | $299,990 | $217 | 87 |
| 961 Mansfield St | 0.02mi | 3/2.5 | 1,586 (+15%) | 2mo | $314,990 | $199 | 73 |
| 955 Mansfield St | 0.01mi | 3/2.5 | 1,586 (+15%) | 3mo | $309,990 | $195 | 72 |
| 862 Rachel St | 0.33mi | 3/2.0 | 1,298 (-6%) | 4mo | $275,900 | $213 | 69 |
| 5827 Highland Sun Ln | 0.30mi | 3/2.5 | 1,497 (+8%) | 6mo | $314,900 | $210 | 68 |
| 845 Elkhart St Unit C | 0.29mi | 3/2.5 | 1,528 (+10%) | 3mo | $309,900 | $203 | 67 |
| 6508 Cohn St | 0.50mi | 3/2.0 | 1,472 (+6%) | 2mo | $275,000 | $187 | 62 |
| 778 Paul Quinn Unit A | 0.49mi | 3/2.5 | 1,556 (+12%) | 6mo | $347,990 | $224 | 51 |
| 776 Paul Quinn Unit A | 0.51mi | 3/2.5 | 1,556 (+12%) | 6mo | $347,990 | $224 | 51 |
| 1540 W Tidwell Rd | 0.66mi | 3/2.5 | 1,516 (+10%) | 6mo | $299,900 | $198 | 48 |
| 1230 W Donovan St | 0.57mi | 4/2.0 (+1) | 1,500 (+8%) | 6mo | $300,000 | $200 | 48 |
| 6729 Arabella St | 0.75mi | 3/2.5 | 1,583 (+14%) | 3mo | $270,000 | $171 | 39 |
Match score weights: distance 35% · size 25% · config 20% · recency 20%. Top-matched comps best support the ARV.
Projected returns pro-forma
-3.0% appreciation · 2.1% rent growth · sell at horizon
- IRR
- -25.3%
- Equity multiple
- 0.15×
- Total profit
- $-63,275
- Equity at exit
- $39,511
- IRR
- -24.4%
- Equity multiple
- -0.16×
- Total profit
- $-85,996
- Equity at exit
- $22,911
Cash invested: $74,197 (down + closing). Projections, not guarantees.
Landlord ↔ Tenant lean methodology
- Overall (STATE)
- 87 Strongly Landlord-Friendly
- State Texas
- 87 Strongly Landlord-Friendly · R+5
- County
- — inherits STATE
- City
- — inherits STATE
ZIP-level market 77091
- Home prices YoY
- -24.9%
- Rents YoY
- 2.1%
- Active inventory
- 675
- Price-to-rent
- 11.3×
Monthly cashflow live
- Estimated rent
- $1,948 high interval (Pro) →
- Mortgage (P&I)
- −$1,390
- Tax est. 1.5%
- −$331 /mo · $3,975/yr
- Insurance
- −$110
- HOA
- −$0
- Vacancy / Maint / Mgmt
- −$409
- Net cashflow
- $-292
Break-even live
UW: 25.0% down · 7.5% · 30yr · 1.5% tax · 5.0% vac · 8.0% maint · 8.0% mgmt
Financing live
Cash to close
- Down payment
- $66,248
- Closing costs
- $7,950
- Reserves months
- —
- Total cash needed
- —
Loan-product check · same deal, 3 products live
Conventional
25% down · 7.5% · 30yr
- Down + closing
- —
- Monthly P&I
- —
- Monthly cashflow
- —
- DSCR
- —
- Eligible?
- —
Personal DTI + credit; lowest rate.
DSCR
20% down · 8.5% · 30yr
- Down + closing
- —
- Monthly P&I
- —
- Monthly cashflow
- —
- DSCR
- —
- Eligible?
- —
No personal income docs; deal must DSCR.
Hard money
10% down · 12.0% · 12mo
- Down + closing
- —
- Monthly P&I
- —
- Monthly cashflow
- —
- DSCR
- —
- Eligible?
- —
Short-term bridge; refi at stabilization.
Rent comps 33 comps
| Address | Beds | Baths | Sqft | Rent | $/sqft | DOM | Units | Dist |
|---|---|---|---|---|---|---|---|---|
| 833 Paul Quinn St Unit A Houston, TX | 3.0 | 2.5 | 1226 | $1,800 | $1.47 | 43d | 1 | 0.34mi |
| 831 Paul Quinn St Unit B Houston, TX | 3.0 | 2.5 | 1226 | $1,800 | $1.47 | 24d | 1 | 0.34mi |
| 1200 W Tidwell Rd Houston, TX | 2.0–3.0 | 1.0–2.0 | 938 | $1,295 | $1.38 | 2d | 12 | 0.41mi |
| 5722 # E Unit Beall St unit Houston, TX | 3.0 | 2.5 | 1474 | $2,011 | $1.36 | 43d | 1 | 0.45mi |
| 5720 Beall St Unit C Houston, TX | 3.0 | 2.5 | 1474 | $2,006 | $1.36 | 43d | 1 | 0.45mi |
| 774 Paul Quinn St Houston, TX | 3.0 | 3.0 | 1651 | $2,350 | $1.42 | 43d | 1 | 0.51mi |
| 6127 W Montgomery Rd Houston, TX | 3.0 | 3.0 | 1786 | $2,000 | $1.12 | 24d | 1 | 0.51mi |
| 6513 Knox St Houston, TX | 4.0 | 3.0 | 1773 | $2,100 | $1.18 | 43d | 1 | 0.52mi |
| 1007 Pinemont Dr Houston, TX | 2.0 | 2.0 | 985 | $1,774 | $1.80 | 43d | 1 | 0.70mi |
| 714 W Tidwell Rd Houston, TX | 2.0 | 1.0 | 1296 | $1,094 | $0.84 | 43d | 1 | 0.74mi |
| 1001 Pinemont Dr Unit 422 Houston, TX | 2.0 | 2.0 | 1155 | $1,389 | $1.20 | 7d | 1 | 0.76mi |
| 1001 Pinemont Dr Unit 2165 Houston, TX | 2.0 | 2.0 | 1155 | $1,381 | $1.20 | 2d | 1 | 0.76mi |
| 1001 Pinemont Dr Unit 1038 Houston, TX | 2.0 | 2.0 | 1155 | $1,413 | $1.22 | 10d | 1 | 0.76mi |
| 1001 Pinemont Dr Unit 1058 Houston, TX | 2.0 | 2.0 | 1155 | $1,414 | $1.22 | 43d | 1 | 0.76mi |
| 1001 Pinemont Dr Unit 96 Houston, TX | 2.0 | 2.0 | 1155 | $1,599 | $1.38 | 43d | 1 | 0.76mi |
| 5115 Royal Heath Dr Houston, TX | 3.0 | 2.5 | 1600 | $2,175 | $1.36 | 24d | 1 | 0.92mi |
| 6555 Sealey St Houston, TX | 3.0 | 2.5 | 1800 | $2,700 | $1.50 | 24d | 1 | 0.95mi |
| 1032 Glen Ln Houston, TX | 3.0 | 3.0 | 1667 | $2,400 | $1.44 | 43d | 1 | 1.08mi |
| 717 Lehman St Houston, TX | 1.0–3.0 | 1.0–3.0 | 1084 | $3,120 | $2.88 | 4d | 263 | 1.11mi |
| 603 W Donovan St Houston, TX | 3.0 | 1.0 | 948 | $1,250 | $1.32 | 43d | 1 | 1.15mi |
| 603 W Donovan St Houston, TX | 3.0 | 1.0 | 948 | $1,250 | $1.32 | 21d | 1 | 1.15mi |
| 910 1/2 Oak St Houston, TX | 3.0 | 2.0 | 1526 | $1,995 | $1.31 | 43d | 1 | 1.21mi |
| 717 Janisch Rd Unit B Houston, TX | 3.0 | 3.5 | 1821 | $2,750 | $1.51 | 43d | 1 | 1.21mi |
| 717 Janisch Rd Unit B Houston, TX | 3.0 | 3.5 | 1821 | $2,750 | $1.51 | 24d | 1 | 1.21mi |
| 5342 Donovan Gardens Ln Unit 1521013P Houston, TX | 3.0 | 3.0 | 1743 | $2,985 | $1.71 | 7d | 1 | 1.27mi |
| 622 Janisch Rd Houston, TX | 3.0 | 4.0 | 1785 | $2,650 | $1.48 | 43d | 1 | 1.29mi |
| 4840 N Shepherd Dr Houston, TX | 3.0 | 1.0–2.0 | 870 | $2,430 | $2.79 | 3d | 21 | 1.30mi |
| 312 W Sunnyside St Houston, TX | 2.0 | 1.0 | 894 | $1,001 | $1.12 | 43d | 1 | 1.33mi |
| 402 Del Norte St Houston, TX | 4.0 | 2.0 | 1790 | $2,300 | $1.28 | 43d | 1 | 1.36mi |
| 2303 W Tidwell Rd Houston, TX | 2.0–3.0 | 2.0 | 1061 | $1,145 | $1.08 | 3d | 3 | 1.36mi |
| 7514 Sandle St Houston, TX | 3.0 | 2.5 | 1523 | $1,999 | $1.31 | 43d | 1 | 1.40mi |
| 7008 Emma Lou St Houston, TX | 3.0 | 2.5 | 1610 | $3,000 | $1.86 | 18d | 1 | 1.42mi |
| 7486 N Shepherd Dr Houston, TX | 3.0 | 2.0 | 1177 | $1,290 | $1.10 | 43d | 1 | 1.46mi |
Listing history 4 events
-
2026-06-01days on market $264,990 Active 31 DOM
-
2026-05-31days on market $264,990 Active 30 DOM
-
2026-05-15price $305,990 237-char remark
-
2026-05-01$310,990 Active 237-char remark
ⓘ Source: listings_history table (triggers on properties + properties_extension) + one-shot
backfill from property_details.listing_events for pre-trigger history.
Nearby sold comps map
Loading sold comps map…
Walkable amenities ~0.75 mi
Loading nearby amenities…
Taxation est. · year 1
- Rental income
- $23,377
- − Mortgage interest
- −$14,844
- − Property taxes
- −$3,975
- − Insurance
- −$1,325
- − Repairs & maintenance
- −$1,870
- − Management
- −$1,870
- − Depreciation
- −$7,709
- Taxable loss
- −$8,215
- Est. tax savings @ 24.0%
- +$1,972
- After-tax cash flow
- $-1,536/yr
For passive investors: Depreciation is non-cash, so a rental often shows a tax loss while cash-flowing — sheltering income. Rental losses are passive: they offset passive income freely, and up to $25,000/yr can offset ordinary (W-2) income if you actively participate and your MAGI is under $100k (phasing out to $0 by $150k); unused losses carry forward. On sale, claimed depreciation is recaptured at up to 25%, and gains may owe capital-gains tax (a 1031 exchange can defer both). Figures are a year-1 estimate at your 24.0% rate — not tax advice; consult a CPA.
Schools (NCES district)
- District
- Houston ISD
- NCES district ID
- 4823640
- Math proficiency
- 27% ▼ -18.00%
- Reading proficiency
- 35% ▼ -6.00%
- Median HH income
- $46,054
- Composite
- 26.63/100
- National rank
- #7173
- State rank
- #593 of 826 in TX
Livability — Houston
- Score
- 74/100
- State rank
- #184
- US rank
- #4771
Category grades
Schools grade is shown separately in the Schools card above.
Census & demographics
- Census place
- Houston, TX
- County
- Harris County · 4,702,590 people
- City population
- 3,226,434
- Metro
- Houston-The Woodlands-Sugar Land, TX
- Population (ZIP)
- 28,728
- Household income
- $35,432
- Rent vs Own
- Severe rent burden
- 3210.0
Population outlook (Harris County) Hauer SSP2
- Today (2025)
- 5,571,493 people
- By 2030
- 6,089,821 · +9.3%
- By 2040
- 7,142,806 · +28.2%
- By 2050
- 8,185,864 · +46.9%
- By 2075
- 10,574,329 · +89.8%
- By 2100
- 12,109,958 · +117.4%
Race, ethnicity, and origin ACS 2023
- Neighborhood character
- Diverse neighborhood (Simpson 0.58)
- Race & ethnicity
- Hispanic / Latino 46% Black 45% Two or more races 15% White 7%
- Hispanic origin (detail)
- Mexican 29%
- Common ancestry
- Italian 1%
- Foreign-born
- 24% · Canada, Jamaica
- Languages at home
- 55% English-only · Spanish 41% French/Haitian/Cajun 2%
Political lean MEDSL · Harris
- 2024 margin
- Lean D (+5.5) · D 52.0% · R 46.4% · Other 1.6%
- 2008→2024 swing
- +3.9pp toward D · 2008: 1.6pp · 2024: 5.5pp
- All cycles
- 2024: D+5.5 2020: D+13.3 2016: D+12.4 2012: D+0.1 2008: D+1.6
Not yet ingested
- Civics
- —
Market trends
- HPI YoY
- ▼ -94.19%
- Current HPI
- 283.7523
- Rent YoY
- ▲ 2.10%
- Metro
- Houston-The Woodlands-Sugar Land, TX
- State GDP YoY
- ▲ 3.95%
- F500 in state
- 110
Industry mix (Fortune 500 HQ in TX)
| Industry | F500 HQs | Revenue |
|---|---|---|
| Energy | 16 | $1,198B |
|
||
| Technology | 5 | $198B |
|
||
| Engineering / Construction | 4 | $72B |
|
||
| Energy Services | 3 | $60B |
|
||
| Utilities | 3 | $41B |
|
||
| Healthcare | 2 | $330B |
|
||
Cash-flow waterfall
monthlySold comps — $/sqft
last 12 mo · ≤1 miLoading sold comps…