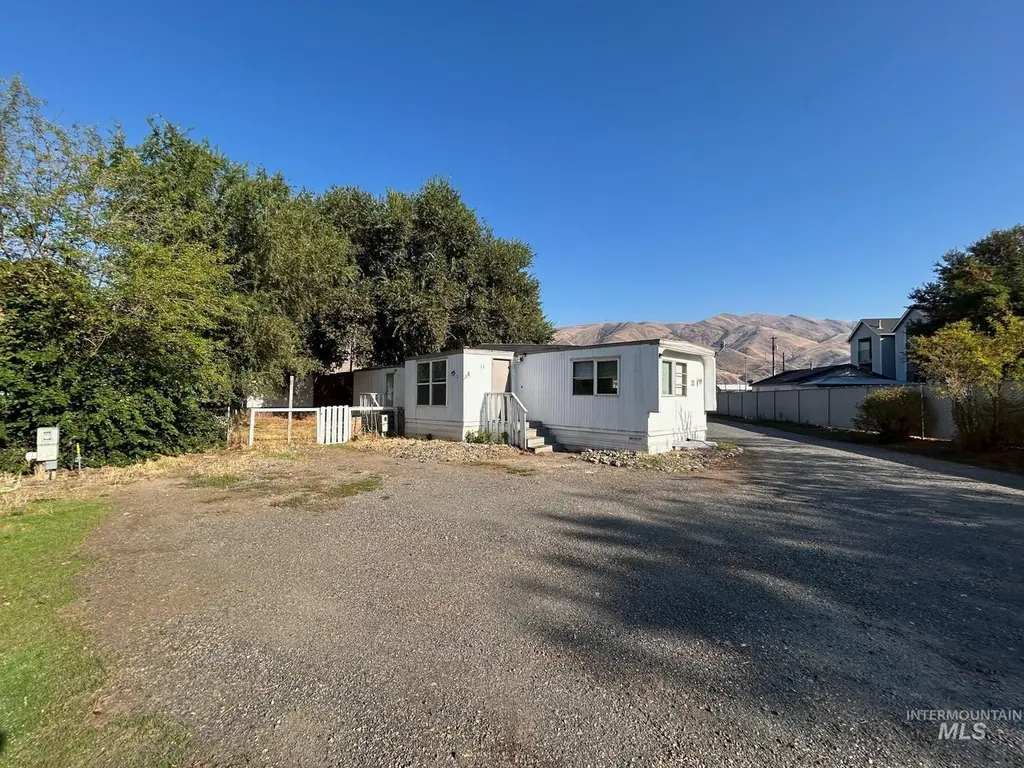
1383 Fair St #11 · Clarkston, WA
Flood risk 7/10 · Major
- FEMA flood zone
- X
- Chance of flooding over 30 yrs
- 0.77%
- Est. flood insurance / yr
- $507 – $1,088
Fire risk 1/10 · Minimal
- Est. fire insurance / yr
- $604 – $1,122
Heat risk 5/10 · Moderate
- Hot days now (above 100°F)
- 7 days/yr
- Hot days in 30 yrs
- 15 days/yr
Wind risk 1/10 · Minimal
- Chance of severe wind over 30 yrs
- —
Air-quality risk 8/10 · Major
- Unhealthy air days now
- 12 days/yr
- Unhealthy air days in 30 yrs
- 17 days/yr
Risk factors via First Street. Map © Google.
Why this score? — see what drove the B grade
The composite is a weighted blend of 9 inputs, each scored 0–100. Each bar is that input's sub-score; the figure is the points it added to the 100-point composite (weight × sub-score).
- Cash flow +30.0/30.0
- 1% rule +10.0/10.0
- DSCR +10.0/10.0
- ARV discount +7.5/15.0
- Schools +4.2/10.0
- Livability +3.5/5.0
- Rent growth +2.5/5.0
- Condition / age +2.5/5.0
- Appreciation +0.0/10.0
$38,500
🖨 Deal sheet 📄 Offer letter ✓ Due diligence
Listing remarks MLS
Welcome to AFFORDABLE housing in a well-maintained and pet-friendly park! This charming home features new flooring throughout, newer vinyl windows that offer energy efficiency and natural light, and washer/dryer hookups for added convenience. The kitchen is equipped with a dishwasher and offers plenty of storage and prep space. Enjoy central air conditioning for year-round comfort. Step outside to a fully fenced yard—perfect for pets, gardening, or outdoor entertaining. The home also offers ample parking, making it ideal for multiple vehicles or guests. Don’t miss this great opportunity for affordable living in a welcoming community!
Key facts
- Newer vinyl windows
- Ample parking
- New flooring
Tags
Neighborhood map
What this means for you Summary
Snapshot
- This is a 2-bed/1.0-bath manufactured listed at $38k.
Deal economics
- At list price, monthly cash flow is $612 ($7k/yr) — positive.
- The deal already cash-flows at list — no discount required.
- Meets the 1% rule at list price ($1k rent vs $38k).
- Recommended offer: $34k (12.0% below list) — sets the bar for market timing.
- Cap rate 27.4% vs local median 3.1% in Clarkston — top-decile yield for the area; either an underpriced asset or a hidden risk that comps aren't pricing in. Stress-test before assuming the spread holds.
Location & tenants
- Location reads 70/100 on livability (#246 in WA) — a middle-class / working-renter tenant base. Strengths: cost of living A+, health & safety A+, housing A; Watch: amenities D, crime F, commute F.
- Clarkston School District (suburban): math 38% / reading 57% proficiency, ranked #172 of 291 in WA (top 59%) — families likely to look elsewhere, expect single-tenant / working-renter base with shorter leases.
- Market conditions: 249 active listings in the ZIP; 1 comparable units currently listed for rent nearby; 101 units permitted in Asotin County in 2024 (72 in 5+ unit buildings).
Forward outlook
- Local home prices are declining (-3.0%/yr); year-one equity from $266 of loan paydown is wiped out by about $1k of value loss. Plan a longer hold.
- Asotin County population projected to shrink 3% by 2050 — rents likely to lag national; underwrite the cash flow, not the appreciation.
- At projected returns (-3.0% appreciation + 3.0% rent growth), your $11k cash investment doubles in ~2 years — after that, you're playing with house money.
Negotiation context
- It's been on market 273 days — a 12% lower offer ($34k) is reasonable based on typical stale-listing flexibility.
Risks & watch-outs
- Watch-outs: flood insurance adds $66/mo.
- Climate carrying-cost: major flood risk; extreme-heat days projected 7→15/yr by 2055 (HVAC capex compounding) — expect insurance premiums to compound above CPI over the hold.
Questions for the listing agent
- It's been on market 273 days. Have you received any prior offers? Is the seller open to a 12% concession, seller financing, or rate buy-down credit?
- Built in 1971 — when were the roof, HVAC, electrical panel, plumbing, and water heater last replaced?
- What's the actual annual flood-insurance premium (NFIP or private), and is the property in a SFHA with mandatory coverage?
- Why hasn't it sold? Are there any deal-killer items the seller is aware of (foundation, flood, title, zoning, code violations)?
- Is there a deadline driving the sale (1031 exchange, divorce, estate, relocation)? That informs how much negotiation room exists.
- Crime grade is F in this area — have there been break-ins, vandalism, or insurance claims at this property in the last 3 years? What carrier currently insures it and at what premium?
- What's the average days-on-market for RENTAL listings here right now (not sales)? A rising rental-DOM trend means longer vacancies and softer asking-rent achievability than the comps imply.
- What's the recent tenant-quality profile in this submarket — average credit score on applications, eviction rate, late-payment / NSF rate, and stable-employment percentage? A property-management company in the area should have these aggregated.
- How much new for-sale + rental construction is in the pipeline within 1–3 miles? Heavy new supply typically softens prices + rents 12–24 months out; constrained supply supports both.
Investment metrics
- 1% rule
- 3.10% ✓
- Cap rate
- 27.42%
- Cash-on-cash
- 75.47%
- DSCR
- 4.36
- GRM
- 2.7
CMA / ARV
- ARV (median comp)
- $85,985
- List price
- $38,500
- Delta
- -55.22%
- Verdict
- UNDERPRICED
- Comps
- 2 within 1.0 mi
Show comp detail 2 sales within ~0.75 mi
| Address | Dist | Beds/Ba | Sqft | Sold | Price | $/sf | Match |
|---|---|---|---|---|---|---|---|
| 1383 Fair St #5 | 0.00mi | 2/1.5 | 768 (+7%) | 3mo | $31,500 | $41 | 84 |
| 1433 Maple St | 0.40mi | 2/1.0 | 720 (0%) | 13mo | $160,000 | $222 | 71 |
Match score weights: distance 35% · size 25% · config 20% · recency 20%. Top-matched comps best support the ARV.
Projected returns pro-forma
-3.0% appreciation · 3.0% rent growth · sell at horizon
- IRR
- 67.5%
- Equity multiple
- 4.04×
- Total profit
- $32,769
- Equity at exit
- $5,740
- IRR
- 71.7%
- Equity multiple
- 8.32×
- Total profit
- $78,926
- Equity at exit
- $3,329
Cash invested: $10,780 (down + closing). Projections, not guarantees.
Landlord ↔ Tenant lean methodology
- Overall (STATE)
- 28 Tenant-Leaning
- State Washington
- 28 Tenant-Leaning · D+8
- County
- — inherits STATE
- City
- — inherits STATE
ZIP-level market 99403
- Active inventory
- 249
- Price-to-rent
- 2.7×
Monthly cashflow live
- Estimated rent
- $1,195 medium interval (Pro) →
- Mortgage (P&I)
- −$202
- Tax est. 1.5%
- −$48 /mo · $578/yr
- Insurance
- −$16
- Flood insurance flood zone
- −$66 /mo · $798/yr
- HOA
- −$0
- Vacancy / Maint / Mgmt
- −$251
- Net cashflow
- $612
Break-even live
UW: 25.0% down · 7.5% · 30yr · 1.5% tax · 5.0% vac · 8.0% maint · 8.0% mgmt
Financing live
Cash to close
- Down payment
- $9,625
- Closing costs
- $1,155
- Reserves months
- —
- Total cash needed
- —
Loan-product check · same deal, 3 products live
Conventional
25% down · 7.5% · 30yr
- Down + closing
- —
- Monthly P&I
- —
- Monthly cashflow
- —
- DSCR
- —
- Eligible?
- —
Personal DTI + credit; lowest rate.
DSCR
20% down · 8.5% · 30yr
- Down + closing
- —
- Monthly P&I
- —
- Monthly cashflow
- —
- DSCR
- —
- Eligible?
- —
No personal income docs; deal must DSCR.
Hard money
10% down · 12.0% · 12mo
- Down + closing
- —
- Monthly P&I
- —
- Monthly cashflow
- —
- DSCR
- —
- Eligible?
- —
Short-term bridge; refi at stabilization.
Rent comps 1 comps
| Address | Beds | Baths | Sqft | Rent | $/sqft | DOM | Units | Dist |
|---|---|---|---|---|---|---|---|---|
| 1600 Chestnut St Clarkston, WA | 1.0–2.0 | 1.0 | 750 | $1,195 | $1.59 | 43d | 3 | 0.89mi |
Listing history 17 events
-
2026-06-19days on market $38,500 Active 273 DOM
-
2026-06-18days on market $38,500 Active 272 DOM
-
2026-06-17days on market $38,500 Active 271 DOM
-
2026-06-16days on market $38,500 Active 270 DOM
-
2026-06-15days on market $38,500 Active 269 DOM
-
2026-06-14days on market $38,500 Active 267 DOM
-
2026-06-12pricedays on market $38,500 Active 266 DOM
-
2026-06-09days on market $41,500 Active 263 DOM
-
2026-06-08days on market $41,500 Active 262 DOM
-
2026-06-07days on market $41,500 Active 261 DOM
-
2026-06-03days on market $41,500 Active 257 DOM
-
2026-06-02days on market $41,500 Active 256 DOM
-
2026-06-01days on market $41,500 Active 255 DOM
-
2026-05-31days on market $41,500 Active 254 DOM
-
2026-05-30days on market $41,500 Active 253 DOM
-
2026-01-19price $41,500 653-char remark
Show marketing remark (653 chars)
Welcome to AFFORDABLE housing in a well-maintained and pet-friendly park! This charming home features new flooring throughout, newer vinyl windows that offer energy efficiency and natural light, and washer/dryer hookups for added convenience. The kitchen is equipped with a dishwasher and offers plenty of storage and prep space. Enjoy central air conditioning for year-round comfort. Step outside to a fully fenced yard—perfect for pets, gardening, or outdoor entertaining. The home also offers ample parking, making it ideal for multiple vehicles or guests. Don’t miss this great opportunity for affordable living in a welcoming community!
-
2025-09-19$45,000 Active 653-char remark
Show marketing remark (653 chars)
Welcome to AFFORDABLE housing in a well-maintained and pet-friendly park! This charming home features new flooring throughout, newer vinyl windows that offer energy efficiency and natural light, and washer/dryer hookups for added convenience. The kitchen is equipped with a dishwasher and offers plenty of storage and prep space. Enjoy central air conditioning for year-round comfort. Step outside to a fully fenced yard—perfect for pets, gardening, or outdoor entertaining. The home also offers ample parking, making it ideal for multiple vehicles or guests. Don’t miss this great opportunity for affordable living in a welcoming community!
ⓘ Source: listings_history table (triggers on properties + properties_extension) + one-shot
backfill from property_details.listing_events for pre-trigger history.
Climate risk First Street
- Flood 7/10 Severe FEMA zone X · 77% chance over 30 yrs
- Wildfire 1/10 Low
- Heat 5/10 Major 7 d/yr ≥100°F today · 15 d/yr by 30 yrs out
- Wind 1/10 Low
- Air quality 8/10 Severe 12 unhealthy d/yr today · 17 by 30 yrs out
Nearby sold comps map
Loading sold comps map…
Walkable amenities ~0.75 mi
Loading nearby amenities…
Taxation est. · year 1
- Rental income
- $14,340
- − Mortgage interest
- −$2,157
- − Property taxes
- −$578
- − Insurance
- −$990
- − Repairs & maintenance
- −$1,147
- − Management
- −$1,147
- − Depreciation
- −$1,120
- Taxable income
- $7,202
- Est. tax owed @ 24.0%
- −$1,728
- After-tax cash flow
- $5,610/yr
For passive investors: Depreciation is non-cash, so a rental often shows a tax loss while cash-flowing — sheltering income. Rental losses are passive: they offset passive income freely, and up to $25,000/yr can offset ordinary (W-2) income if you actively participate and your MAGI is under $100k (phasing out to $0 by $150k); unused losses carry forward. On sale, claimed depreciation is recaptured at up to 25%, and gains may owe capital-gains tax (a 1031 exchange can defer both). Figures are a year-1 estimate at your 24.0% rate — not tax advice; consult a CPA.
Schools (NCES district)
- District
- Clarkston School District
- NCES district ID
- 5301320
- Math proficiency
- 38% ▼ -4.00%
- Reading proficiency
- 57% ▲ 1.00%
- Median HH income
- $42,030
- Composite
- 42.03/100
- National rank
- #7065
- State rank
- #172 of 291 in WA
Livability — Clarkston
- Score
- 70/100
- State rank
- #246
- US rank
- #7868
Category grades
Schools grade is shown separately in the Schools card above.
Census & demographics
- Census place
- Clarkston, WA
- Population (ZIP)
- 20,483
Population outlook (Asotin County) Hauer SSP2
- Today (2025)
- 22,623 people
- By 2030
- 22,746 · +0.5%
- By 2040
- 22,597 · -0.1%
- By 2050
- 21,947 · -3.0%
- By 2075
- 19,478 · -13.9%
- By 2100
- 16,206 · -28.4%
Race, ethnicity, and origin ACS 2023
- Neighborhood character
- Predominantly White (87%)
- Race & ethnicity
- White 87% Two or more races 6% Hispanic / Latino 5% Native American 1% Asian 1%
- Common ancestry
- Portuguese 3% Lithuanian 2% Slovak 2%
- Foreign-born
- 2% · Canada
- Languages at home
- 97% English-only · Spanish 2% Tagalog/Filipino 1%
Political lean MEDSL · Asotin
- 2024 margin
- Strong R (+25.6) · D 35.8% · R 61.5% · Other 2.7%
- 2008→2024 swing
- -12.2pp toward R · 2008: -13.4pp · 2024: -25.6pp
- All cycles
- 2024: R+25.6 2020: R+25.7 2016: R+26.8 2012: R+16.7 2008: R+13.4
Not yet ingested
- Civics
- —
Market trends
- HPI YoY
- ▼ -346.91%
- Current HPI
- 173.3027
- Rent YoY
- —
- Metro
- —
- State GDP YoY
- ▲ 4.65%
- F500 in state
- 22
Industry mix (Fortune 500 HQ in WA)
| Industry | F500 HQs | Revenue |
|---|---|---|
| Retail | 2 | $269B |
|
||
| Technology / Retail | 1 | $638B |
|
||
| Technology | 1 | $245B |
|
||
| Telecommunications | 1 | $38B |
|
||
| Food / Beverage | 1 | $36B |
|
||
| Automotive / Trucks | 1 | $34B |
|
||
Price history
-7.8% since first listed2 events — show timeline
- 2026-01-19 Price Changed $41,500 IMLS
- 2025-09-19 Listed $45,000 IMLS
Cash-flow waterfall
monthlySold comps — $/sqft
last 12 mo · ≤1 miLoading sold comps…