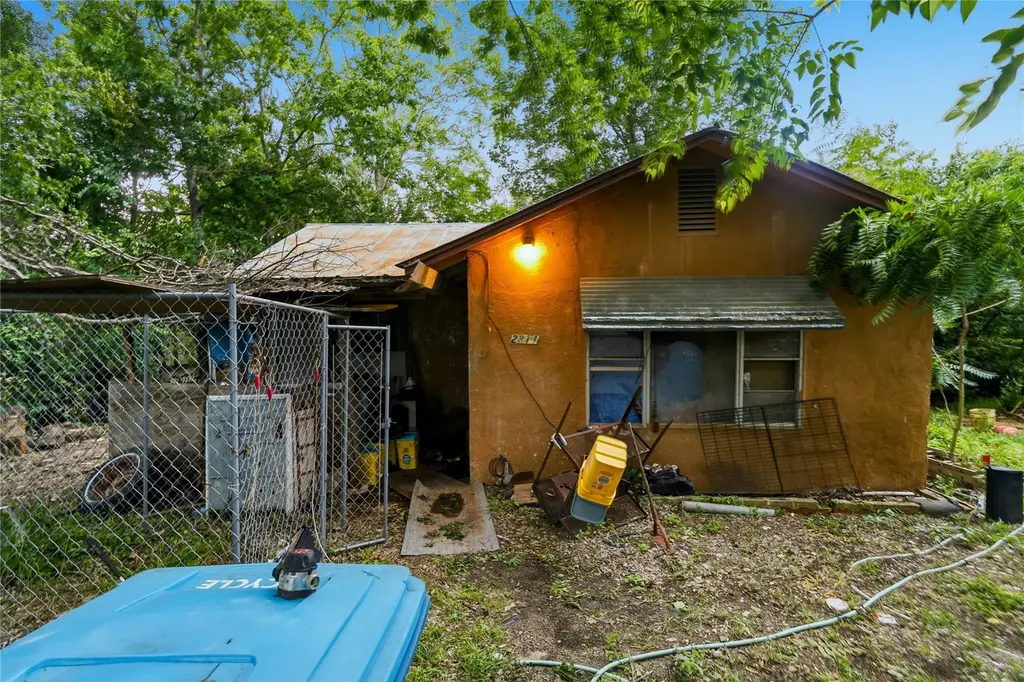
2811 Locust St · Kerrville, TX
Flood risk 1/10 · Minimal
- FEMA flood zone
- X (unshaded)
- Chance of flooding over 30 yrs
- 0.0%
- Est. flood insurance / yr
- $507 – $1,088
Fire risk 4/10 · Minor
- Est. fire insurance / yr
- $1,222 – $2,270
Heat risk 6/10 · Moderate
- Hot days now (above 103°F)
- 7 days/yr
- Hot days in 30 yrs
- 21 days/yr
Wind risk 6/10 · Moderate
- Chance of severe wind over 30 yrs
- 48.0%
Air-quality risk 1/10 · Minimal
- Unhealthy air days now
- 0 days/yr
- Unhealthy air days in 30 yrs
- 0 days/yr
Risk factors via First Street. Map © Google.
Why this score? — see what drove the B+ grade
The composite is a weighted blend of 9 inputs, each scored 0–100. Each bar is that input's sub-score; the figure is the points it added to the 100-point composite (weight × sub-score).
- Cash flow +30.0/30.0
- ARV discount +15.0/15.0
- 1% rule +10.0/10.0
- DSCR +10.0/10.0
- Schools +4.1/10.0
- Livability +4.0/5.0
- Rent growth +3.3/5.0
- Condition / age +2.5/5.0
- Appreciation +0.0/10.0
$120,000
🖨 Deal sheet 📄 Offer letter ✓ Due diligence
Listing remarks
Rare Kerrville investment opportunity on TWO residential lots with excellent redevelopment or renovation potential. Located outside the flood zone and less than 0.5 miles from the Guadalupe River. This property offers a large footprint in an established neighborhood near schools, Schreiner University, multiple parks/playgrounds, and the Kerrville VA Medical Center. Sitting just 2.5 miles from downtown, it is ideal for investors, builders, or buyers looking to create something new in a prime Kerrville location. Conveniently Located Near:?• Guadalupe River – less than 0.5 miles?• Daniels Elementary School – 1.2 miles?• Hal Peterson Middle School – 1.7 miles?&b
Key facts
- Residential lot
- Rebuild or tear down
- Guadalupe river
Tags
Property features AI
Exterior
- Parking: Two parking spaces (see remarks for details)
- Utilities: Above-ground utilities; Public water; Public sewer
- Home design: Single-story home; Faces northeast; Resale property
- Construction: Year built (per public records); Construction details: See remarks
- Exterior features: Backyard; Native plants; See remarks (additional exterior details)
Interior
- Bedrooms: Two main-level bedrooms
- Flooring: Wood flooring
- Bathrooms: One full bathroom
- Heating & cooling: Electric heating; Electric cooling
- Interior features: Main-level primary bedroom; No interior steps; See remarks (additional interior details)
- Laundry & utility: Laundry details: See remarks
Neighborhood map
What this means for you Summary
Snapshot
- This is a 3-bed/1.0-bath single-family listed at $120k.
Deal economics
- At list price, monthly cash flow is $678 ($8k/yr) — positive.
- The deal already cash-flows at list — no discount required.
- Meets the 1% rule at list price ($2k rent vs $120k).
- Recommended offer: $118k (1.5% below list) — sets the bar for market timing.
- Cap rate 13.1% vs local median 2.1% in Kerrville — top-decile yield for the area; either an underpriced asset or a hidden risk that comps aren't pricing in. Stress-test before assuming the spread holds.
Location & tenants
- Location reads 81/100 on livability (#25 in TX, #1,483 nationally) — a professional / high-income tenant draw. Strengths: crime A+, cost of living A+, housing A+; Watch: employment C-, commute F.
- Kerrville ISD (town): math 45% / reading 51% proficiency, ranked #220 of 826 in TX (top 27%) — families likely to look elsewhere, expect single-tenant / working-renter base with shorter leases.
- Market conditions: Rents rising (+3.0%/yr); 753 active listings in the ZIP; 4 comparable units currently listed for rent nearby; rentals lingering (median 44d on market — plan ~5-8 weeks vacancy on turnover, expect pricing pressure); 75% of comp listings sitting > 30 days — soft ceiling on asking rent; 422 units permitted in Kerr County in 2024 (322 in 5+ unit buildings).
- This rent runs 33% of the median local income ($67k/yr) — at the standard rent-burdened threshold; future hikes will face affordability resistance.
Forward outlook
- Local home prices are declining (-3.0%/yr); year-one equity from $830 of loan paydown is wiped out by about $4k of value loss. Plan a longer hold.
- Kerr County population projected at +15% by 2050 — long-run rental-demand tailwind backs the buy-and-hold thesis.
- At projected returns (-3.0% appreciation + 3.0% rent growth), your $34k cash investment doubles in ~6 years — after that, you're playing with house money.
Negotiation context
- It's been on market 22 days — a 2% lower offer ($118k) is reasonable based on typical stale-listing flexibility.
Risks & watch-outs
- Watch-outs: built in 1940 — expect roof / HVAC / electrical / plumbing capex.
- Climate carrying-cost: major wind risk, 48% chance of damaging wind over 30y; extreme-heat days projected 7→21/yr by 2055 (HVAC capex compounding) — expect insurance premiums to compound above CPI over the hold.
Questions for the listing agent
- Built in 1940 — when were the roof, HVAC, electrical panel, plumbing, and water heater last replaced?
- Is there a deadline driving the sale (1031 exchange, divorce, estate, relocation)? That informs how much negotiation room exists.
- Schools are B-rated — typically a magnet for longer-tenancy family renters. What's the average tenant stay here, and is there a school-zone premium baked into asking?
- What's the average days-on-market for RENTAL listings here right now (not sales)? A rising rental-DOM trend means longer vacancies and softer asking-rent achievability than the comps imply.
- What's the recent tenant-quality profile in this submarket — average credit score on applications, eviction rate, late-payment / NSF rate, and stable-employment percentage? A property-management company in the area should have these aggregated.
- How much new for-sale + rental construction is in the pipeline within 1–3 miles? Heavy new supply typically softens prices + rents 12–24 months out; constrained supply supports both.
Investment metrics
- 1% rule
- 1.52% ✓
- Cap rate
- 13.07%
- Cash-on-cash
- 24.20%
- DSCR
- 2.08
- GRM
- 5.5
CMA / ARV
- ARV (on-the-fly)
- $232,448
- Comps found
- 5
Show comp detail 5 sales within ~0.75 mi
| Address | Dist | Beds/Ba | Sqft | Sold | Price | $/sf | Match |
|---|---|---|---|---|---|---|---|
| 405 N Goss St | 0.35mi | 3/2.0 | 1,003 (-2%) | 4mo | $255,000 | $254 | 73 |
| 104 Amelia Ct | 0.23mi | 3/2.0 | 1,166 (+14%) | 3mo | $264,900 | $227 | 60 |
| 112 N Ivy Ln | 0.22mi | 2/2.0 (-1) | 1,080 (+6%) | 15mo | $237,000 | $219 | 59 |
| 4050 Loop 534 | 0.74mi | 3/1.0 | 1,176 (+15%) | 5mo | $259,000 | $220 | 36 |
| 2305 Memorial Blvd | 0.67mi | 2/1.0 (-1) | 1,135 (+11%) | 23mo | $280,000 | $247 | 26 |
Match score weights: distance 35% · size 25% · config 20% · recency 20%. Top-matched comps best support the ARV.
Projected returns pro-forma
-3.0% appreciation · 3.03% rent growth · sell at horizon
- IRR
- 17.5%
- Equity multiple
- 1.71×
- Total profit
- $23,752
- Equity at exit
- $17,892
- IRR
- 26.0%
- Equity multiple
- 3.27×
- Total profit
- $76,428
- Equity at exit
- $10,375
Cash invested: $33,600 (down + closing). Projections, not guarantees.
Landlord ↔ Tenant lean methodology
- Overall (STATE)
- 87 Strongly Landlord-Friendly
- State Texas
- 87 Strongly Landlord-Friendly · R+5
- County
- — inherits STATE
- City
- — inherits STATE
ZIP-level market 78028
- Rents YoY
- 3.0%
- Active inventory
- 753
- Price-to-rent
- 5.5×
Monthly cashflow live
- Estimated rent
- $1,825 medium interval (Pro) →
- Mortgage (P&I)
- −$629
- Tax from tax record
- −$85 /mo · $1,023/yr
- Insurance
- −$50
- HOA
- −$0
- Vacancy / Maint / Mgmt
- −$383
- Net cashflow
- $678
Break-even live
UW: 25.0% down · 7.5% · 30yr · 1.5% tax · 5.0% vac · 8.0% maint · 8.0% mgmt
Financing live
Cash to close
- Down payment
- $30,000
- Closing costs
- $3,600
- Reserves months
- —
- Total cash needed
- —
Loan-product check · same deal, 3 products live
Conventional
25% down · 7.5% · 30yr
- Down + closing
- —
- Monthly P&I
- —
- Monthly cashflow
- —
- DSCR
- —
- Eligible?
- —
Personal DTI + credit; lowest rate.
DSCR
20% down · 8.5% · 30yr
- Down + closing
- —
- Monthly P&I
- —
- Monthly cashflow
- —
- DSCR
- —
- Eligible?
- —
No personal income docs; deal must DSCR.
Hard money
10% down · 12.0% · 12mo
- Down + closing
- —
- Monthly P&I
- —
- Monthly cashflow
- —
- DSCR
- —
- Eligible?
- —
Short-term bridge; refi at stabilization.
Rent comps 4 comps
| Address | Beds | Baths | Sqft | Rent | $/sqft | DOM | Units | Dist |
|---|---|---|---|---|---|---|---|---|
| 125 Amelia Ct Kerrville, TX | 3.0 | 2.0 | 1091 | $1,650 | $1.51 | 43d | 1 | 0.10mi |
| 486 Bridal Path Kerrville, TX | 4.0 | 2.0 | 1450 | $2,000 | $1.38 | 43d | 1 | 0.52mi |
| 2105 Singing Wind Dr Kerrville, TX | 1.0–3.0 | 1.0–1.5 | 822 | $1,375 | $1.67 | 2d | 5 | 0.57mi |
| 2105 Singing Wind Dr Kerrville, TX | 1.0–3.0 | 1.0–1.5 | 822 | $1,375 | $1.67 | 43d | 1 | 0.57mi |
Listing history 17 events
-
2026-06-19days on market $120,000 Active 22 DOM
-
2026-06-18days on market $120,000 Active 21 DOM
-
2026-06-17days on market $120,000 Active 20 DOM
-
2026-06-16days on market $120,000 Active 19 DOM
-
2026-06-15days on market $120,000 Active 18 DOM
-
2026-06-14days on market $120,000 Active 16 DOM
-
2026-06-12days on market $120,000 Active 15 DOM
-
2026-06-09days on market $120,000 Active 12 DOM
-
2026-06-08days on market $120,000 Active 11 DOM
-
2026-06-07days on market $120,000 Active 10 DOM
-
2026-06-05days on market $120,000 Active 7 DOM
-
2026-06-03days on market $120,000 Active 6 DOM
-
2026-06-02days on market $120,000 Active 5 DOM
-
2026-06-01days on market $120,000 Active 4 DOM
-
2026-05-31days on market $120,000 Active 3 DOM
-
2026-05-30days on market $120,000 Active 2 DOM
-
2026-05-28$120,000 Active
ⓘ Source: listings_history table (triggers on properties + properties_extension) + one-shot
backfill from property_details.listing_events for pre-trigger history.
Tax reassessment forecast TX · Resets to sale price
- Current annual tax
- $1,023 · $85/mo
- Projected year-2 tax
- $2,196 · $183/mo
- Expected delta
- +$1,173/yr (+$98/mo · 114.7%)
ⓘ Screening estimate from a state-policy table — verify with the county assessor before closing.
Climate risk First Street
- Flood 1/10 Low FEMA zone X (unshaded) · 0% chance over 30 yrs
- Wildfire 4/10 Moderate
- Heat 6/10 Major 7 d/yr ≥103°F today · 21 d/yr by 30 yrs out
- Wind 6/10 Major 48% chance of damaging wind over 30 yrs
- Air quality 1/10 Low 0 unhealthy d/yr today · 0 by 30 yrs out
Nearby sold comps map
Loading sold comps map…
Walkable amenities ~0.75 mi
Loading nearby amenities…
Taxation est. · year 1
- Rental income
- $21,905
- − Mortgage interest
- −$6,722
- − Property taxes
- −$1,023
- − Insurance
- −$600
- − Repairs & maintenance
- −$1,752
- − Management
- −$1,752
- − Depreciation
- −$3,491
- Taxable income
- $6,565
- Est. tax owed @ 24.0%
- −$1,576
- After-tax cash flow
- $6,555/yr
For passive investors: Depreciation is non-cash, so a rental often shows a tax loss while cash-flowing — sheltering income. Rental losses are passive: they offset passive income freely, and up to $25,000/yr can offset ordinary (W-2) income if you actively participate and your MAGI is under $100k (phasing out to $0 by $150k); unused losses carry forward. On sale, claimed depreciation is recaptured at up to 25%, and gains may owe capital-gains tax (a 1031 exchange can defer both). Figures are a year-1 estimate at your 24.0% rate — not tax advice; consult a CPA.
Schools (NCES district)
- District
- Kerrville ISD
- NCES district ID
- 4825590
- Math proficiency
- 45% ▼ -10.00%
- Reading proficiency
- 51% ▼ -1.00%
- Median HH income
- $44,050
- Composite
- 40.54/100
- National rank
- #3702
- State rank
- #220 of 826 in TX
Livability — Kerrville
- Score
- 81/100
- State rank
- #25
- US rank
- #1483
Category grades
Schools grade is shown separately in the Schools card above.
Census & demographics
- Census place
- Kerrville, TX
- County
- Kerr County · 41,206 people
- City population
- 41,206
- Metro
- Kerrville, TX
- Population (ZIP)
- 41,206
- Household income
- $66,991
- Rent vs Own
- Severe rent burden
- 1092.0
Population outlook (Kerr County) Hauer SSP2
- Today (2025)
- 54,010 people
- By 2030
- 55,651 · +3.0%
- By 2040
- 58,923 · +9.1%
- By 2050
- 62,117 · +15.0%
- By 2075
- 71,809 · +33.0%
- By 2100
- 77,004 · +42.6%
Race, ethnicity, and origin ACS 2023
- Neighborhood character
- Predominantly White (69%)
- Race & ethnicity
- White 69% Hispanic / Latino 26% Two or more races 12% Black 2%
- Hispanic origin (detail)
- Mexican 22%
- Common ancestry
- Lithuanian 3% Slovak 3% Portuguese 2%
- Foreign-born
- 6% · Canada
- Languages at home
- 89% English-only · Spanish 10%
Political lean MEDSL · Kerr
- 2024 margin
- Solid R (+54.3) · D 22.4% · R 76.8%
- 2008→2024 swing
- -4.8pp toward R · 2008: -49.6pp · 2024: -54.3pp
- All cycles
- 2024: R+54.3 2020: R+51.7 2016: R+56.3 2012: R+59.1 2008: R+49.6
Not yet ingested
- Civics
- —
Market trends
- HPI YoY
- ▼ -260.97%
- Current HPI
- 213.3663
- Rent YoY
- ▲ 3.03%
- Metro
- Kerrville, TX
- State GDP YoY
- ▲ 3.95%
- F500 in state
- 110
Industry mix (Fortune 500 HQ in TX)
| Industry | F500 HQs | Revenue |
|---|---|---|
| Energy | 16 | $1,198B |
|
||
| Technology | 5 | $198B |
|
||
| Engineering / Construction | 4 | $72B |
|
||
| Energy Services | 3 | $60B |
|
||
| Utilities | 3 | $41B |
|
||
| Healthcare | 2 | $330B |
|
||
Price history
1 event — show timeline
- 2026-05-28 Listed $120,000 Unlock MLS
Property tax history
+6.2%/yrLatest (2025): $1,023 · +3.2% YoY. Source: county tax records.
Cash-flow waterfall
monthlySold comps — $/sqft
last 12 mo · ≤1 miLoading sold comps…