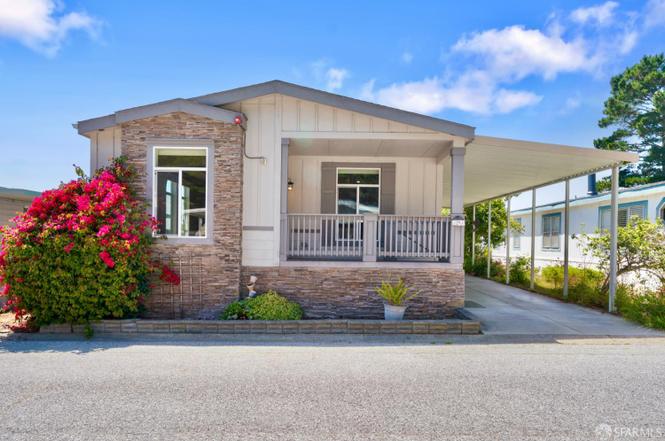
29 Yacht Ln · Daly City, CA
Flood risk 1/10 · Minimal
- FEMA flood zone
- X (unshaded)
- Chance of flooding over 30 yrs
- 0.0%
- Est. flood insurance / yr
- $507 – $1,088
Fire risk 4/10 · Minor
- Est. fire insurance / yr
- $659 – $1,223
Heat risk 1/10 · Minimal
- Hot days now (above 77°F)
- 5 days/yr
- Hot days in 30 yrs
- 11 days/yr
Wind risk 1/10 · Minimal
- Chance of severe wind over 30 yrs
- —
Air-quality risk 7/10 · Major
- Unhealthy air days now
- 13 days/yr
- Unhealthy air days in 30 yrs
- 13 days/yr
Risk factors via First Street. Map © Google.
Why this score? — see what drove the D grade
The composite is a weighted blend of 9 inputs, each scored 0–100. Each bar is that input's sub-score; the figure is the points it added to the 100-point composite (weight × sub-score).
- Cash flow +16.7/30.0
- Schools +5.6/10.0
- DSCR +5.2/10.0
- 1% rule +4.5/10.0
- Rent growth +4.3/5.0
- Livability +4.1/5.0
- Condition / age +2.5/5.0
- ARV discount +0.0/15.0
- Appreciation +0.0/10.0
$488,000
🖨 Deal sheet 📄 Offer letter ✓ Due diligence
Listing remarks
A beautifully maintained 2010 Skyline manufactured home located in the Franciscan Park community. This spacious residence features 3 bedrooms, 2 bathrooms, an open-concept layout, generous living and dining areas, and abundant natural light throughout. The well-designed floor plan provides comfortable everyday living with ample room for entertaining, relaxing, and working from home. Beyond the home itself, residents enjoy the added peace of mind of a community security check point at the entrance, along with an impressive array of resort-style amenities. Franciscan Park features a clubhouse complete with a card room, game room, library, kitchen, and community office, as well as a swimming p
Key facts
- Clubhouse
- Spa
- Swimming pool
Tags
Property features AI
Finance
- HOA & community: Association fee listed as 0; Pets allowed: cats, dogs, service animals
Exterior
- Parking: Has a 3-space carport; Covered parking for 3 vehicles; Guest parking; no garage
- Security: Smoke detectors; Carbon monoxide detectors; Fire alarm; Double-strapped water heater
- Utilities: Public water; Public sewer; Electricity available (220V in laundry); Gas plumbed
- Home design: Manufactured in park (double wide); Built in 2010; Located in The Franciscan Park; Original and updated/remodeled condition; Board approval required
- Construction: Vinyl skirting; Model: J239ct; Manufacturer: Skyline Homes Inc.
- Exterior features: Awning(s) and porch awning; Patio and porch with steps; Shed/storage; Fenced yard; Front and back yard; Garden and landscaped front
Interior
- Kitchen: Dishwasher; Disposal; Free-standing refrigerator; Gas cooktop; Range hood; Microwave
- Bedrooms: 3 bedrooms
- Flooring: Carpet; Laminate; Tile
- Bathrooms: 2 full bathrooms
- Heating & cooling: Central heating; Gas heating; Fireplace heating; Ceiling fans for cooling
- Interior features: Formal entry; One fireplace located in the living room; Unfurnished
- Laundry & utility: Washer and dryer included; Gas dryer hookup; Laundry located inside
Neighborhood map
What this means for you Summary
Snapshot
- This is a 3-bed/2.0-bath manufactured listed at $488k.
Deal economics
- At list price, monthly cash flow is $304 ($4k/yr) — positive.
- The deal already cash-flows at list — no discount required.
- To meet the 1% rule (rent ≥ 1% of price), the offer needs to be $465k (4.6% below list).
- Recommended offer: $465k (4.6% below list) — sets the bar for 1% rule.
- Cap rate 7.0% vs local median 2.2% in Daly City — top-decile yield for the area; either an underpriced asset or a hidden risk that comps aren't pricing in. Stress-test before assuming the spread holds.
Location & tenants
- Location reads 82/100 on livability (#35 in CA, #1,221 nationally) — a professional / high-income tenant draw. Strengths: amenities A+, commute A+, employment A+; Watch: cost of living F.
- Jefferson Union High (suburban): math 50% / reading 75% proficiency, ranked #66 of 517 in CA (top 13%) — acceptable for families but not a draw, mixed tenant base, ~2y average lease.
- Market conditions: Rents rising fast (+7.1%/yr); 60 active listings in the ZIP; 4 comparable units currently listed for rent nearby; rentals leasing fast (median 2d on market — plan ~1-2 weeks tenant-placement turnaround); high-income renter base; 1,019 units permitted in San Mateo County in 2024 (484 in 5+ unit buildings).
- At $4,653/mo this rent would consume 45% of the median local household income ($123k/yr) (locally 1517% of renters already pay >50% of income on rent) — very limited rent-growth headroom before tenants either downsize or default.
Forward outlook
- Local home prices are declining (-3.0%/yr); year-one equity from $3k of loan paydown is wiped out by about $15k of value loss. Plan a longer hold.
- San Mateo County population projected at +24% by 2050 — long-run rental-demand tailwind backs the buy-and-hold thesis.
Negotiation context
- Only 7 days on market — expect competitive offers; lowballing is unlikely to land.
Questions for the listing agent
- Is there a deadline driving the sale (1031 exchange, divorce, estate, relocation)? That informs how much negotiation room exists.
- The area grade is low — what's the realistic commute time and amenity access for the typical tenant pool here? Any planned neighborhood developments (good or bad) we should know about?
- What's the average days-on-market for RENTAL listings here right now (not sales)? A rising rental-DOM trend means longer vacancies and softer asking-rent achievability than the comps imply.
- What's the recent tenant-quality profile in this submarket — average credit score on applications, eviction rate, late-payment / NSF rate, and stable-employment percentage? A property-management company in the area should have these aggregated.
- How much new for-sale + rental construction is in the pipeline within 1–3 miles? Heavy new supply typically softens prices + rents 12–24 months out; constrained supply supports both.
Investment metrics
- 1% rule
- 0.95% ✗
- Cap rate
- 7.04%
- Cash-on-cash
- 2.67%
- DSCR
- 1.12
- GRM
- 8.7
CMA / ARV
- ARV (on-the-fly)
- $406,560
- Comps found
- 3
Show comp detail 3 sales within ~0.75 mi
| Address | Dist | Beds/Ba | Sqft | Sold | Price | $/sf | Match |
|---|---|---|---|---|---|---|---|
| 50 Harbor Dr | 0.31mi | 2/2.0 (-1) | 1,600 (-9%) | 14mo | $365,000 | $228 | 54 |
| 59 Franciscan Dr #432 | 0.39mi | 3/2.0 | 1,593 (-10%) | 18mo | $491,000 | $308 | 51 |
| 51 Haven Dr | 0.30mi | 2/2.0 (-1) | 1,512 (-14%) | 18mo | $350,000 | $231 | 43 |
Match score weights: distance 35% · size 25% · config 20% · recency 20%. Top-matched comps best support the ARV.
Projected returns pro-forma
-3.0% appreciation · 7.1% rent growth · sell at horizon
- IRR
- -7.6%
- Equity multiple
- 0.71×
- Total profit
- $-39,683
- Equity at exit
- $72,762
- IRR
- 6.6%
- Equity multiple
- 1.58×
- Total profit
- $79,890
- Equity at exit
- $42,193
Cash invested: $136,640 (down + closing). Projections, not guarantees.
Landlord ↔ Tenant lean methodology
- Overall (STATE)
- 18 Strongly Tenant-Friendly
- State California
- 18 Strongly Tenant-Friendly · D+13
- County
- — inherits STATE
- City
- — inherits STATE
ZIP-level market 94014
- Rents YoY
- 7.1%
- Active inventory
- 60
- Price-to-rent
- 8.7×
Monthly cashflow live
- Estimated rent
- $4,653 medium interval (Pro) →
- Mortgage (P&I)
- −$2,559
- Tax est. 1.5%
- −$610 /mo · $7,320/yr
- Insurance
- −$203
- HOA
- −$0
- Vacancy / Maint / Mgmt
- −$977
- Net cashflow
- $304
Break-even live
UW: 25.0% down · 7.5% · 30yr · 1.5% tax · 5.0% vac · 8.0% maint · 8.0% mgmt
Financing live
Cash to close
- Down payment
- $122,000
- Closing costs
- $14,640
- Reserves months
- —
- Total cash needed
- —
Loan-product check · same deal, 3 products live
Conventional
25% down · 7.5% · 30yr
- Down + closing
- —
- Monthly P&I
- —
- Monthly cashflow
- —
- DSCR
- —
- Eligible?
- —
Personal DTI + credit; lowest rate.
DSCR
20% down · 8.5% · 30yr
- Down + closing
- —
- Monthly P&I
- —
- Monthly cashflow
- —
- DSCR
- —
- Eligible?
- —
No personal income docs; deal must DSCR.
Hard money
10% down · 12.0% · 12mo
- Down + closing
- —
- Monthly P&I
- —
- Monthly cashflow
- —
- DSCR
- —
- Eligible?
- —
Short-term bridge; refi at stabilization.
Rent comps 4 comps
| Address | Beds | Baths | Sqft | Rent | $/sqft | DOM | Units | Dist |
|---|---|---|---|---|---|---|---|---|
| 7800 El Camino Real Colma, CA | 3.0 | 1.0–2.0 | 879 | $3,548 | $4.03 | 1d | 1 | 0.94mi |
| 606 Southhill Blvd Daly City, CA | 4.0 | 2.0 | 1500 | $5,300 | $3.53 | 1d | 1 | 1.32mi |
| 101 McLellan Dr South San Francisco, CA | 2.0 | 1.0–2.0 | 779 | $3,825 | $4.91 | 2d | 8 | 1.43mi |
| 781 Alta Loma Dr South San Francisco, CA | 3.0 | 2.0 | 1700 | $5,995 | $3.53 | 43d | 1 | 1.47mi |
Listing history 7 events
-
2026-06-18days on market $488,000 Active 7 DOM
-
2026-06-17days on market $488,000 Active 6 DOM
-
2026-06-16days on market $488,000 Active 5 DOM
-
2026-06-15days on market $488,000 Active 4 DOM
-
2026-06-13days on market $488,000 Active 2 DOM
-
2026-06-13remarks 699-char remark
-
2026-06-13$488,000 Active 1 DOM
ⓘ Source: listings_history table (triggers on properties + properties_extension) + one-shot
backfill from property_details.listing_events for pre-trigger history.
Climate risk First Street
- Flood 1/10 Low FEMA zone X (unshaded) · 0% chance over 30 yrs
- Wildfire 4/10 Moderate
- Heat 1/10 Low 5 d/yr ≥77°F today · 11 d/yr by 30 yrs out
- Wind 1/10 Low
- Air quality 7/10 Severe 13 unhealthy d/yr today · 13 by 30 yrs out
Nearby sold comps map
Loading sold comps map…
Walkable amenities ~0.75 mi
Loading nearby amenities…
Taxation est. · year 1
- Rental income
- $55,839
- − Mortgage interest
- −$27,336
- − Property taxes
- −$7,320
- − Insurance
- −$2,440
- − Repairs & maintenance
- −$4,467
- − Management
- −$4,467
- − Depreciation
- −$14,196
- Taxable loss
- −$4,387
- Est. tax savings @ 24.0%
- +$1,053
- After-tax cash flow
- $4,696/yr
For passive investors: Depreciation is non-cash, so a rental often shows a tax loss while cash-flowing — sheltering income. Rental losses are passive: they offset passive income freely, and up to $25,000/yr can offset ordinary (W-2) income if you actively participate and your MAGI is under $100k (phasing out to $0 by $150k); unused losses carry forward. On sale, claimed depreciation is recaptured at up to 25%, and gains may owe capital-gains tax (a 1031 exchange can defer both). Figures are a year-1 estimate at your 24.0% rate — not tax advice; consult a CPA.
Schools (NCES district)
- District
- Jefferson Union High
- NCES district ID
- 0618930
- Math proficiency
- 50% ▲ 15.00%
- Reading proficiency
- 75% ▲ 19.00%
- Median HH income
- $82,212
- Composite
- 56.13/100
- National rank
- #1180
- State rank
- #66 of 517 in CA
Livability — Daly City
- Score
- 82/100
- State rank
- #35
- US rank
- #1221
Category grades
Schools grade is shown separately in the Schools card above.
Census & demographics
- Census place
- Daly City, CA
- County
- San Mateo County · 733,415 people
- City population
- 109,406
- Metro
- San Francisco-Oakland-Berkeley, CA
- Population (ZIP)
- 45,315
- Household income
- $122,966
- Rent vs Own
- Severe rent burden
- 1517.0
Population outlook (San Mateo County) Hauer SSP2
- Today (2025)
- 864,008 people
- By 2030
- 910,523 · +5.4%
- By 2040
- 997,285 · +15.4%
- By 2050
- 1,071,189 · +24.0%
- By 2075
- 1,197,206 · +38.6%
- By 2100
- 1,192,523 · +38.0%
Race, ethnicity, and origin ACS 2023
- Neighborhood character
- Diverse neighborhood (Simpson 0.61)
- Race & ethnicity
- Asian 54% Hispanic / Latino 30% Two or more races 11% White 9% Black 2% Native American 1%
- Hispanic origin (detail)
- Mexican 12%
- Common ancestry
- Lithuanian 1% Scotch-Irish 1%
- Foreign-born
- 54% · Canada, China, Vietnam
- Languages at home
- 34% English-only · Spanish 23% Tagalog/Filipino 20% Chinese 17%
Political lean MEDSL · San Mateo
- 2024 margin
- Solid D (+50.3) · D 73.5% · R 23.2% · Other 3.3%
- 2008→2024 swing
- +1.6pp toward D · 2008: 48.7pp · 2024: 50.3pp
- All cycles
- 2024: D+50.3 2020: D+57.7 2016: D+57.7 2012: D+44.8 2008: D+48.7
Not yet ingested
- Civics
- —
Market trends
- HPI YoY
- ▼ -1224.05%
- Current HPI
- 275.8666
- Rent YoY
- ▲ 7.10%
- Metro
- San Francisco-Oakland-Berkeley, CA
- State GDP YoY
- ▲ 3.21%
- F500 in state
- 116
Industry mix (Fortune 500 HQ in CA)
| Industry | F500 HQs | Revenue |
|---|---|---|
| Technology | 27 | $1,492B |
|
||
| Financial Services | 3 | $174B |
|
||
| Retail | 3 | $44B |
|
||
| Insurance | 3 | $26B |
|
||
| Media / Entertainment | 2 | $115B |
|
||
| Pharmaceuticals / Biotech | 2 | $62B |
|
||
Price history
1 event — show timeline
- 2026-06-11 Listed $488,000 San Francisco MLS
Property tax history
+0.6%/yrLatest (2024): $608 · -12.5% YoY. Source: county tax records.
Cash-flow waterfall
monthlySold comps — $/sqft
last 12 mo · ≤1 miLoading sold comps…